DOI:
10.1039/C5RA14768A
(Paper)
RSC Adv., 2015,
5, 81038-81044
On the morphology of MoS2 slabs on MoS2/Al2O3 catalysts: the influence of Mo loading†
Received
25th July 2015
, Accepted 18th September 2015
First published on 18th September 2015
Abstract
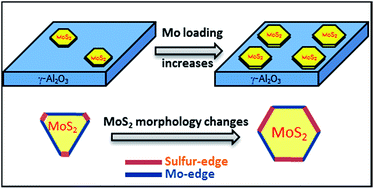
Two-dimensional MoS2 is an important material with diverse catalytic applications. The edge sites exposed by MoS2 are of great importance to its catalytic performance since the catalytic reactions generally occur on the edge sites rather than on the basal planes. In this work, low temperature (100 K) CO adsorption followed by IR spectroscopy (IR/CO) was used to in situ probe the edge sites of the MoS2 phase on MoS2/Al2O3 catalysts. It is found that the morphology of the MoS2 phase on an Al2O3 support is a truncated triangle exposing mainly Mo-terminated edges (M-edge). However, the proportion of sulfur-terminated edges (S-edge) increases with increasing the Mo loading, resulting in a more heavily truncated triangle morphology of MoS2. The change of MoS2 morphology with Mo loading can be explained by the modification of MoS2–Al2O3 interactions, indicating the importance of phase-support interactions in supported MoS2 catalysts.
1 Introduction
The two-dimensional (2D) molybdenum sulfide (MoS2) nanostructure (slab) is one of the most important materials with diverse applications. While supported MoS2 is used in the traditional hydrodesulfurization (HDS) process to remove sulfur from crude oil feedstock,1 an exciting application of MoS2 was recently found in the hydrogen evolution reaction (HER).2 Since the catalytic reactions usually proceed on the edge sites of MoS2 slabs and the basal planes are generally catalytically inert,3 the type and number of edges exposed under different synthesis conditions are of crucial importance to MoS2 catalytic performance.
In its perfect crystallographic (100) plane, MoS2 exposes principally two types of edges: the Mo terminated edge (M-edge) and the sulfur terminated edge (S-edge).4 Recently, it was found that the relative ratio of M-edge and S-edge, i.e. the morphology of MoS2, is strongly influenced by MoS2-support interactions. With STM (scanning tunneling microscopy), Walton and co-workers observed that MoS2 adopts a triangle shape exposing only one edge on Au support, whereas it presents a hexagon shape with both M-edge and S-edge on graphite and TiO2.5 On the support of Al2O3, we recently found that the MoS2 morphology can be stepwise tuned from a slightly truncated triangle to a heavily truncated triangle by addition of chelating agent during catalyst preparation.6 In addition, DFT simulations show that the ratio of anchored and free edge sites (including the relative proportion of M-edge and S-edge sites) differs with MoS2-support interactions.7
As an important parameter in supported MoS2 catalysts, the effect of Mo loading on the catalyst structure and activity was intensively investigated.8–17 While several studies suggest that the MoS2–Al2O3 interactions may differ with Mo loading,13,18,19 the correlation of Mo loading and MoS2 morphology is never considered. Therefore, in this work the effect of Mo loading on the morphology of MoS2 phase on MoS2/Al2O3 catalysts is investigated. For this purpose, a series of oxidic Mo/Al2O3 precursors with different Mo loading was prepared by conventional impregnation method. The MoS2/Al2O3 catalysts were obtained by sulfiding the Mo/Al2O3 precursors with 10% H2S/H2 at atmospheric pressure or 4.0 MPa. The MoS2 morphologies on these catalysts were determined with IR spectroscopy using CO as probe molecule that adsorbs on MoS2 edge sites at low temperature (100 K).
2 Experimental
2.1. Catalyst preparation
A set of oxidic Mo/Al2O3 catalyst precursors with variable Mo loading (6%, 9%, and 12%, wt Mo) was prepared by the one-step pore volume impregnation method. Firstly, variable amount of ammonium heptamolybdate tetrahydrate ((NH4)6Mo7O24·4H2O, Acros Organics) for the designed Mo loading was dissolved in 3.30 mL deionized water. Secondly, 3.00 gram of pretreated γ-Al2O3 support (Sasol, specific surface area of 252 m2 g−1 and pore volume of 0.84 mL g−1, pre-calcined in air at 723 K for 2 hours) was added into the solutions and strongly shaken for 2 hours. Finally, the matured slurry was dried at 383 K for 3 hours and then calcined at 773 K for 3 hours under air.
2.2. Infrared (IR) spectroscopy characterization
IR characterization was performed on a newly designed setup called CellEx. The CellEx consists of three parts: (i) a stainless steel reactor for catalyst sulfidation and other treatment under different temperatures, pressures and gas phases; (ii) an IR cell equipped with a spectrometer for spectroscopic characterization; and (iii) a transfer connection for transferring the sample from reactor into IR cell under inert gas. With the CellEx, the catalysts can be treated under different conditions and sequentially in situ characterized by IR spectroscopy without any air pollution. More details about CellEx were described in ref. 20.
2.2.1. Catalyst sulfidation. Catalyst sulfidation were performed in the stainless steel reactor of CellEx. Catalyst sample was firstly grounded and pressed into self-supporting pellet. The pellet was introduced into the reactor which was then evacuated to 1.33 Pa to remove the air. After that the pellet was sulfided at 0.1 MPa or 4.0 MPa with the following procedure. (i) 0.1 MPa sulfidation: firstly, a gas mixture of 0.1 MPa 30 mL min−1 10% H2S/H2 (Air Liquide France, H2S: 9.97% ± 0.3%, v/v) was introduced into the reaction. Then the reactor was heated with a rate of 3 K min−1 to 623 K and maintained for 2 hours. Sequentially, the reactor was flushed with Ar at 623 K and then cooled down to room temperature under Ar. Finally, the sulfided pellet was transferred under Ar to the IR cell for IR characterization. (ii) 4.0 MPa sulfidation: the pressure of reactor was firstly increased to 4.0 MPa with 10% H2S/H2 mixture. Then the reactor was heated with a rate of 3 K min−1 to 623 K and maintained for 2 hours. During this period, the flow rate of H2S/H2 was fixed at 30 mL min−1. After that, the reactor pressure was decreased to atmospheric pressure. Sequentially, the reactor was flushed with Ar at 623 K and then cooled down to room temperature under Ar. Finally, the sulfided pellet was transferred under Ar to the IR cell for IR characterization.
2.2.2. Low-temperature CO adsorption followed by IR spectroscopy characterization (IR/CO). In the IR cell, the sulfided pellet was firstly heated at 6 K min−1 up to 623 K and kept for 1 hour under evacuation. The final pressure in the IR cell after evacuation should reach 10−3 Pa. After that, the pellet was cooled down to 100 K for CO adsorption. CO adsorption was performed by introducing small calibrated doses of CO (Air Liquide France, 99.9973%, purified by trapping in liquid nitrogen before use) at different pressures (0.03–1.20 μmol of CO) and finally with 133 Pa CO at equilibrium in the IR cell. IR spectra of adsorbed CO were recorded using a Thermo Scientific Nicolet FT-spectrometer equipped with a MCT detector with 256 scans. Note that the graphical resolution is 0.5 cm−1. For comparison, all the spectra presented were normalized to a sulfided catalyst pellet of 5 mg cm−2.The obtained IR spectra were further decomposed with Peakfit V4.12 using “Autofit peak II—Second derivative Methods”. Then the concentration of each type of MoS2 edge sites was determined using the molar extinction coefficient of CO adsorbed on M-edge (εM-edge) and S-edge (εS-edge) previous measured (εM-edge and εS-edge are 20 ± 3 μmol−1 cm and 35 ± 9 μmol−1 cm, respectively6). Details for spectral decomposition, εM-edge and εS-edge measurement, and edge site concentration calculation were described in ref. 6.
2.3. TEM characterization
Transmission electron microscopy (TEM) was carried out on a JEOL 2010 FEG operated at 200 kV. The catalyst precursors were firstly sulfided with the same procedure as that used in IR/CO characterization. To limit detrimental exposure to air, the sulfided catalysts were unloaded from the sulfidation reactor under argon flow into ethanol. A few drops of a suspension of catalyst were put on a copper grid. Slab length and stacking degree distributions of sulfide slabs were determined manually by measuring at least 300 slabs per sample from the TEM images. All the TEM images were recorded at the same magnification and digitized using a 2k × 2k CCD camera. The image treatment was performed using the commercial software from GATAN (DIGITALMICROGRAPH).
3 Results
3.1. Catalyst characterization
Both the oxidic Mo/Al2O3 precursor and the sulfide MoS2/Al2O3 catalyst were widely characterized in the literature.21–25 For the oxidic precursors, it is generally agreed that the isolated and tetrahedral coordinated molybdenum oxide species present at low Mo loadings while the hepta- and octamolybdates species increase with increasing Mo loading.23,24 The as-prepared oxidic Mo/Al2O3 samples in this work were characterized by Raman spectroscopy, and such conclusion is confirmed (ESI, Fig. S1†). Due to the good dispersion of MoS2 phase on Al2O3 support, the X-ray diffraction (XRD) patterns of MoS2/Al2O3 samples shows mainly the characteristics of Al2O3 without or with only weak signals according to crystalline MoS2 phases up to the MoO3 loading around 15 wt%.26–28
The obtained 9 wt% MoS2/Al2O3 catalysts were also characterized by the high resolution TEM (Transmission Electron Microscopy). The MoS2 phase is imaged as tiny slabs (Fig. 1) with an average length around 2 nm and average stacking around 1.5 layers (Fig. 2). On calcined catalyst, the sulfidation pressure has slight effect on the average slab length and the average stacking number (Fig. 2 and ref. 29). Because of the contrast disturbance from alumina support, the HRTEM provides neither the morphology of MoS2 clusters nor the type of edges that MoS2 exposes (Fig. 1 and ref. 25).
 |
| Fig. 1 TEM images of the MoS2 slabs on MoS2/Al2O3 catalyst sulfided at 623 K with 0.1 MPa (A) or 4.0 MPa (B) 10% H2S/H2. The Mo loading is 9 wt% on this catalyst. | |
 |
| Fig. 2 TEM analysis of the average slab length and stacking of MoS2 on MoS2/Al2O3 catalyst sulfided at 623 K with 0.1 MPa or 4.0 MPa 10% H2S/H2. The Mo loading is 9 wt% on this catalyst. The average slab length is 1.9 nm for the 0.1 MPa sulfided catalyst, and 2.2 nm for the 4.0 MPa sulfided one. The average slab stackings are respectively 1.56 (0.1 MPa) and 1.67 (4.0 MPa). | |
3.2. IR spectra of low-temperature CO adsorption on MoS2/Al2O3 catalyst
In order to investigate the MoS2 morphology on MoS2/Al2O3 catalyst, low temperature (100 K) CO adsorption followed by IR spectroscopy (IR/CO) was employed to probe the MoS2 edge sites. For comparison, the IR spectrum of CO adsorption on pure Al2O3 support sulfided by the same procedure is also provided. As shown in Fig. 3, low temperature CO adsorption on pure Al2O3 support leads to two ν(CO) bands located at 2189 and 2156 cm−1, which are assigned respectively to CO adsorption on Al3+ sites and OH groups on Al2O3 support.30 When MoS2 phase is introduced onto Al2O3 surface, distinct IR/CO bands in the region of 2125–1950 cm−1 were observed. The ν(CO) band located at 2111 cm−1, as well as the shoulder at 2064 cm−1, correspond to CO adsorption on the edge sites of MoS2 phase. Combining experimental IR/CO data with theoretical DFT calculations, Travert and co-workers31,32 assigned the former band (∼2111 cm−1) to CO adsorption on the Mo-terminated edge (M-edge) of MoS2 slabs, and the later one (∼2064 cm−1) to CO adsorption on the sulfur-terminated edge (S-edge) of MoS2 phase. With increasing Mo loading, the intensity of ν(CO) bands on Al3+ sites and OH groups stepwise decrease, indicating that more Al2O3 surface is covered by MoS2 phase, which is in good agreement with the augmentation of Mo loading. Meanwhile, the intensity of ν(CO) bands on both M-edge and S-edge gradually increases, indicating more MoS2 edge sites are formed with the increasing Mo loading. Nevertheless, it should be underlined that these two bands do not increase proportionately. The ν(CO) shoulder band on S-edge becomes more evident with Mo loading.
 |
| Fig. 3 IR spectra of CO adsorption (133 Pa CO at equilibrium, 100 K) on MoS2/Al2O3 prepared with different Mo loading. The MoS2/Al2O3 catalysts were obtained by sulfiding the oxidic Mo/Al2O3 precursors at 623 K and 0.1 MPa with 10% H2S/H2. | |
In order to go further in the parameters that affects the relative change of M-edge and S-edge with Mo loading, the set of oxidic Mo/Al2O3 precursors were further sulfided with 10% H2S/H2 at high pressure (4.0 MPa) and then in situ characterized by IR/CO. As shown in Fig. 4, no new IR band appears on the high pressure sulfided MoS2/Al2O3 catalysts. Nevertheless, the ν(CO) band on S-edge (∼2064 cm−1) is more clearly observed after high pressure sulfidation than after sulfidation at atmospheric pressure. With increasing Mo loading, this band is an ill-defined shoulder on 6 wt% MoS2/Al2O3 catalyst and becomes a well-defined band on 12 wt% MoS2/Al2O3 samples, indicating an increasing of S-edge proportion on the MoS2 phase.
 |
| Fig. 4 IR spectra of CO adsorption (133 Pa CO at equilibrium, 100 K) on MoS2/Al2O3 prepared with different Mo loading. The MoS2/Al2O3 catalysts were obtained by sulfiding the oxidic Mo/Al2O3 precursors at 623 K and 4.0 MPa with 10% H2S/H2. | |
Fig. 5 compares the IR/CO spectra on 9 wt% MoS2/Al2O3 catalysts sulfided at atmospheric (0.1 MPa) and high pressure (4.0 MPa). As can be seen, the CO adsorption intensity on MoS2 phase is strongly modified by sulfidation pressure. With elevating the sulfidation pressure, the CO adsorption intensity on M-edge is decreased, whereas the CO band on S-edge becomes more pronounced. Besides, the CO adsorption intensity on OH groups is also significantly enhanced after high-pressure sulfidation.
 |
| Fig. 5 Comparison of IR spectra of CO adsorption (133 Pa at equilibrium, 100 K) on MoS2/Al2O3 sulfided at 623 K with 0.1 MPa (thin line) or 4.0 MPa (bold line) 10% H2S/H2. The Mo loading is 9 wt% on this catalyst. | |
To depict the MoS2 morphologies on MoS2/Al2O3 catalysts, the IR/CO spectra in Fig. 3 and 4 were further decomposed with the software Peakfit V4.12 and the concentration of M-edge and S-edge sites detected by low-temperature CO adsorption was calculated. The details for spectral decomposition and sites calculation were reported previously.6 As shown in Fig. 6, the ratio of S-edge/M-edge on the series of MoS2/Al2O3 catalysts are steadily increased with Mo loading. Assuming that the ratio of M-edge and S-edge on a single MoS2 slab is in line with the overall ratio of each edge detected by CO adsorption, the data in Fig. 6 suggests that with increasing Mo loading, the morphology of MoS2 slabs changes from a slightly truncated triangle exposing mainly M-edge to a more heavily truncated triangle exposing relatively more S-edge. For the same Mo loading, the S-edge/M-edge ratios on the 4.0 MPa sulfided MoS2/Al2O3 catalysts are always higher than the ones on the 0.1 MPa sulfided samples, indicating that MoS2 morphology is probably also influenced by sulfidation pressure. Nevertheless, the S-edge/M-edge ratios, even on the high pressure sulfided samples, are much smaller than 1, showing that the MoS2 phase with typical Mo loadings in HDS catalysts mainly exposes M-edge, which is consistent with the DFT results that the M-edge is energetically more stable than S-edge under HDS conditions.33
 |
| Fig. 6 The ratios of S-edge/M-edge on MoS2/Al2O3 catalysts as a function of Mo loadings. | |
4 Discussion
4.1. On the assignment of CO adsorption bands on MoS2 phase
Although the IR/CO data in this work clearly show that the relative intensity of the two CO adsorption bands on MoS2 phase varies with Mo loading, the conclusion that MoS2 morphology is changed relies firstly on the assignment of the two ν(CO) bands. Besides the M-edge/S-edge assignment used above, another competing assignment in the literature is the edge/corner assignment. By comparison with CO adsorption on metal particles, Muller and co-workers34 attributed the two ν(CO) bands at 2111 and 2064 cm−1 to respectively edge and corner sites of MoS2 slabs. This assignment was used in several studies without further validation.35,36 However, this assignment is contradicted with the experimental results present in this paper. Indeed, whatever the morphology of MoS2 slabs is (triangle or hexagon), the corner/edge site ratio should decreases with increasing MoS2 slab size. Since the MoS2 slab size increases with Mo loading,8,19,37,38 the 2064/2111 ν(CO) band ratio should decreases with increasing Mo loading. However, as shown in Fig. 6, the 2064/2111 ν(CO) band ratio steadily increases with increasing Mo loading. Therefore, the assignment of these two bands to CO adsorption on edge and corner sites of MoS2 slabs can be discarded.
Using the density functional method, Zeng and co-workers39 calculated the CO adsorption on triangular MoSx clusters. Accordingly, they assigned the ν(CO) band at ∼2111 cm−1 to symmetric coupled stretching of double-CO adsorption on corner site (frequency calculated is 2102 cm−1), and the band at ∼2064 cm−1 to either mono-adsorption stretching or asymmetric coupled stretching on the corner site. Firstly, this assignment of double CO adsorption is contradicted with the co-adsorption results of 12CO/13CO mixtures on MoS2/Al2O3 catalyst.40,41 Secondly, the assignment of these two ν(CO) bands to CO adsorption on corner sites makes it impossible the opposite intensity change of this two bands. However, our recent experimental data on citric acid effect6 show a decrease of the ν(CO) band at ∼2111 cm−1 with an increase of the ν(CO) band at ∼2064 cm−1. Therefore, this assignment can also be discarded.
The assignment of CO adsorption on other species, such as Mo carbide, can also be excluded, since the catalysts used in the present work were prepared without any carbon additives and calcined at 773 K under air before sulfidation. Another assignment to be considered for these two CO bands is the effect of MoS2 stacking. However, this assignment is unlikely since the relative intensity of the two bands varies significantly while the average stacking of MoS2 slabs stays comparable (Fig. 2 and ref. 6). In the same way, the ν(CO) band at ∼2064 cm−1 cannot be attributed to the nanometer-sized entities as observed by Kooyman and co-workers,25 since these nanoparticles, which predominantly occur under mild sulfidation, cannot be the major species on well sulfided MoS2/Al2O3 catalyst.
In summary, it is reasonable to assign the two CO adsorption bands at ∼2111 and ∼2064 cm−1 to respectively M-edge and S-edge of MoS2 slabs. The recent work of Labruyere with parallel studies of IR/CO and DFT calculations on the effect of sulfidation temperature confirms again this assignment.42 Consequently, with this assignment, the IR/CO data presented in this work clearly show that the morphology of MoS2 slab is changed with Mo loading on supported MoS2/Al2O3 catalysts.
4.2. The influence of Mo loading on MoS2 morphology
The question of the origin of the MoS2 morphology change with Mo loading arises. Many factors allowed us to interpret this effect by a change in MoS2–Al2O3 interactions. The MoS2 phase interacts with Al2O3 support by the so-called Mo–O–Al linkages, which are located at the edges of MoS2 slabs rather than at the bulk sites.7,43 Therefore, the concentration of Mo–O–Al linkages (normalized by the total number of Mo in MoS2) will decreases with increasing MoS2 size. Since it is well established in the literature that the MoS2 size increases with Mo loading,8,19,37,38 the concentration of Mo–O–Al linkages decreases with increasing Mo loading. Moreover, The Mo–O–Al linkages are formed by the reaction of Mo atoms with hydroxyl groups on Al2O3 surface.44 Since the hydroxyl groups on Al2O3 support have different acidity, the Mo atoms preferentially react with the most basic hydroxyl groups, and the excess Mo atoms will react with less basic or neutral OH groups to form Mo–O–Al linkages.44 Therefore, the strength of Mo–O–Al linkages also decreases with Mo loading. All these results suggest that the MoS2–Al2O3 interactions decrease with increasing Mo loading.
According to the Wulff construction,45 the morphology of MoS2 is determined by the relative free energies of M-edge and S-edge. These edge energies are related to the chemical potential of sulfur in sulfidation,33 but also sensitive to other parameters such as MoS2-support interactions.5 The role of MoS2-support interactions on MoS2 morphology can be understood as an extra energy obtained by the edges when interacting with support.5 We surmise that such additional energy is not the same on M-edge and S-edge. Therefore, the growth of one edge will be promoted, and thus the MoS2 morphology is changed when changing MoS2-support interactions.
The above explanations of MoS2 morphology change with Mo loadings are consistent with the previous report. Our previous study on citric acid6 demonstrated that the reduction of MoS2–Al2O3 interactions by chelating agent addition promotes the growth of S-edge, thus leading to the morphology change of MoS2 slabs from a slightly truncated triangle exposing mainly M-edge to a hexagon with both M-edge and S-edge. In this paper, the reduction of MoS2–Al2O3 interactions can also be expected with increasing Mo loadings. Accordingly, it is observed that the MoS2 slabs on MoS2/Al2O3 catalysts expose relatively more S-edge with increasing Mo loading.
4.3. The effect of high pressure sulfidation
The role of the sulfidation pressure on MoS2 morphology is even more crucial since the effect of Mo loading on morphology is more prominent after 4.0 MPa sulfidation. The results in this work point out that MoS2 morphology is also influenced by the sulfidation pressure since the S-edge/M-edge ratio is always greater on the high pressure sulfided samples for the same Mo loading. According to Le Chatelier's principle, the effect of sulfidation pressure can be tentatively interpreted as that the increase of the total gas phase pressure (PH2S + PH2) will favor the thiolysis of Mo–O–Al linkages toward the formation of Mo-SH and Al-OH,46 and thus lowers the MoS2–Al2O3 interactions. Besides, it was also observed that the CO uptake on the high pressure sulfided MoS2 is lower than that on the atmospheric sulfided one (Fig. 5), implying that sulfidation pressure probably also changes the sulfur coverage on MoS2 edge sites as suggested by DFT calculations.47 The effect of sulfidation pressure on MoS2 morphology and edge structure will be further investigated in another work.
5 Conclusion
In this work, low temperature CO adsorption followed by IR spectroscopy (IR/CO) is used to demonstrate the MoS2 morphology change with Mo loading on real type MoS2/Al2O3 catalysts. It is found that the morphology of MoS2 on Al2O3 support is a truncated triangle exposing both M-edge and S-edge, and that the truncation degree, i.e., ratio of S-edge/M-edge, increases with Mo loading. The effect of Mo loading on MoS2 morphology can be explained by the modification of MoS2–Al2O3 interactions. Nevertheless, because of the strong interactions between MoS2 and Al2O3 support, MoS2 presents mainly M-edge rather than S-edge even at high Mo loading and high pressure sulfidation, indicating that M-edge is energetically much more stable than S-edge on Al2O3 support.
Acknowledgements
The French Ministry of Research is acknowledged for the Ph.D. grant of J. Chen. Yoann Levaque, Valérie Ruaux, and Philippe Bazin are greatly acknowledged for the technical support on IR experiment. Guillaume CLET is greatly acknowledged for the Raman characterization.
References
- H. Topsoe, B. S. Clausen and F. E. Massoth, Hydrotreating catalysis, Springer, Berlin-Heidelberg, 1996 Search PubMed.
- I. Song, C. Park and H. C. Choi, RSC Adv., 2015, 5, 7495–7514 RSC.
- T. F. Jaramillo, K. P. Jorgensen, J. Bonde, J. H. Nielsen, S. Horch and I. Chorkendorff, Science, 2007, 317, 100–102 CrossRef CAS PubMed.
- J. V. Lauritsen, J. Kibsgaard, S. Helveg, H. Topsoe, B. S. Clausen, E. Laegsgaard and F. Besenbacher, Nat. Nanotechnol., 2007, 2, 53–58 CrossRef CAS PubMed.
- A. S. Walton, J. V. Lauritsen, H. Topsoe and F. Besenbacher, J. Catal., 2013, 308, 306–318 CrossRef CAS PubMed.
- J. Chen, F. Maugé, J. El Fallah and L. Oliviero, J. Catal., 2014, 320, 170–179 CrossRef CAS PubMed.
- D. Costa, C. Arrouvel, M. Breysse, H. Toulhoat and P. Raybaud, J. Catal., 2007, 246, 325–343 CrossRef CAS PubMed.
- L. Jalowiecki-Duhamel, J. Grimblot and J. P. Bonnelle, J. Catal., 1991, 129, 511–518 CrossRef CAS.
- E. Etienne, E. Ponthieu, E. Payen and J. Grimblot, J. Non-Cryst. Solids, 1992, 147–148, 764–768 CrossRef CAS.
- Y. Yokoyama, N. Ishikawa, K. Nakanishi, K. Satoh, A. Nishijima, H. Shimada, N. Matsubayashi and M. Nomura, Catal. Today, 1996, 29, 261–266 CrossRef CAS.
- R. Iwamoto and J. Grimblot, Stud. Surf. Sci. Catal., 1997, 106, 195–210 CrossRef CAS.
- R. Iwamoto and J. Grimblot, Stud. Surf. Sci. Catal., 1999, 121, 289–294 CrossRef CAS.
- E. J. M. Hensen, V. H. J. de Beer, J. A. R. van Veen and R. A. van Santen, Catal. Lett., 2002, 84, 59–67 CrossRef CAS.
- A. Ishihara, F. Dumeignil, D. H. Wang, X. G. Li, H. Arakawa, E. W. Qian, S. Inoue, A. Muto and T. Kabe, Appl. Catal., A, 2005, 292, 50–60 CrossRef CAS PubMed.
- P. Blanchard, C. Lamonier, A. Griboval and E. Payen, Appl. Catal., A, 2007, 322, 33–45 CrossRef CAS PubMed.
- A. Ishihara, J. Jpn. Pet. Inst., 2008, 51, 73–82 CrossRef CAS.
- J. Mazurelle, C. Lamonier, C. Lancelot, E. Payen, C. Pichon and D. Guillaume, Catal. Today, 2008, 130, 41–49 CrossRef CAS PubMed.
- P. Arnoldy, J. A. M. Vandenheijkant, G. D. Debok and J. A. Moulijn, J. Catal., 1985, 92, 35–55 CrossRef CAS.
- H. Shimada, N. Matsubayashi, T. Sato, Y. Yoshimura, M. Imamura, T. Kameoka and A. Nishijima, Catal. Lett., 1993, 20, 81–86 CrossRef CAS.
- L. Oliviero, L. Mariey, M.-A. Lelias, S. Aiello, J. van Gestel and F. Mauge, Catal. Lett., 2010, 135, 62–67 CrossRef CAS.
- G. M. Dhar, B. N. Srinivas, M. S. Rana, M. Kumar and S. K. Maity, Catal. Today, 2003, 86, 45–60 CrossRef CAS.
- G. Mestl and T. K. K. Srinivasan, Catal. Rev.: Sci. Eng., 1998, 40, 451–570 CAS.
- H. C. Hu, I. E. Wachs and S. R. Bare, J. Phys. Chem., 1995, 99, 10897–10910 CrossRef CAS.
- K. V. R. Chary, K. R. Reddy, G. Kishan, J. W. Niemantsverdriet and G. Mestl, J. Catal., 2004, 226, 283–291 CrossRef CAS PubMed.
- P. J. Kooyman, E. J. M. Hensen, A. M. de Jong, J. W. Niemantsverdriet and J. A. R. van Veen, Catal. Lett., 2001, 74, 49–53 CrossRef CAS.
- B. Liu, Y. M. Chai, Y. P. Li, A. J. Wang, Y. Q. Liu and C. G. Liu, Appl. Catal., A, 2014, 471, 70–79 CrossRef CAS PubMed.
- W. B. Chen, F. Mauge, J. van Gestel, H. Nie, D. D. Li and X. Y. Long, J. Catal., 2013, 304, 47–62 CrossRef CAS PubMed.
- D. Liu, Z. Li, Q. Sun, X. Kong, A. Zhao and Z. Wang, Fuel, 2012, 92, 77–83 CrossRef CAS PubMed.
- A. I. Dugulan, E. J. M. Hensen and J. A. R. van Veen, Catal. Today, 2008, 130, 126–134 CrossRef CAS PubMed.
- K. I. Hadjiivanov and G. N. Vayssilov, Adv. Catal., 2002, 47, 307–511 CAS.
- A. Travert, C. Dujardin, F. Mauge, S. Cristol, J. F. Paul, E. Payen and D. Bougeard, Catal. Today, 2001, 70, 255–269 CrossRef CAS.
- A. Travert, C. Dujardin, F. Mauge, E. Veilly, S. Cristol, J. F. Paul and E. Payen, J. Phys. Chem. B, 2006, 110, 1261–1270 CrossRef CAS PubMed.
- H. Schweiger, P. Raybaud, G. Kresse and H. Toulhoat, J. Catal., 2002, 207, 76–87 CrossRef CAS.
- B. Muller, A. D. Vanlangeveld, J. A. Moulijn and H. Knozinger, J. Phys. Chem., 1993, 97, 9028–9033 CrossRef.
- L. P. A. F. Elst, S. Eijsbouts, A. D. van Langeveld and J. A. Moulijn, J. Catal., 2000, 196, 95–103 CrossRef CAS.
- F. Cesano, S. Bertarione, A. Piovano, G. Agostini, M. M. Rahman, E. Groppo, F. Bonino, D. Scarano, C. Lamberti, S. Bordiga, L. Montanari, L. Bonoldi, R. Millini and A. Zecchina, Catal. Sci. Technol., 2011, 1, 123–136 CAS.
- Y. P. Li, A. T. Li, F. F. Li, D. P. Liu, Y. M. Chai and C. G. Liu, J. Catal., 2014, 317, 240–252 CrossRef CAS PubMed.
- E. Payen, S. Kasztelan, S. Houssenbay, R. Szymanski and J. Grimblot, J. Phys. Chem., 1989, 93, 6501–6506 CrossRef CAS.
- T. Zeng, X. D. Wen, Y. W. Li and H. J. Jiao, J. Phys. Chem. B, 2005, 109, 13704–13710 CrossRef CAS PubMed.
- M. A. Lelias, A. Travert, J. van Gestel and F. Mauge, J. Phys. Chem. B, 2006, 110, 14001–14003 CrossRef CAS PubMed.
- X.-D. Wen, T. Zeng and H. Jiao, J. Phys. Chem. B, 2006, 110, 14004–14005 CrossRef CAS.
- V. Labruyere, Ph.D thesis, Universite of Caen, 2014.
- C. Arrouvel, M. Breysse, H. Toulhoat and P. Raybaud, J. Catal., 2005, 232, 161–178 CrossRef CAS PubMed.
- N. Y. Topsoe and H. Topsoe, J. Catal., 1993, 139, 631–640 CrossRef CAS.
- G. Wulff, Z. Kristallogr. Mineral., 1901, 34, 449–530 CAS.
- Y. V. Joshi, P. Ghosh, M. Daage and W. N. Delgass, J. Catal., 2008, 257, 71–80 CrossRef CAS PubMed.
- P. Y. Prodhomme, P. Raybaud and H. Toulhoat, J. Catal., 2011, 280, 178–195 CrossRef CAS PubMed.
Footnote |
† Electronic supplementary information (ESI) available. See DOI: 10.1039/c5ra14768a |
|
This journal is © The Royal Society of Chemistry 2015 |
Click here to see how this site uses Cookies. View our privacy policy here.