DOI:
10.1039/C5RA14618F
(Paper)
RSC Adv., 2015,
5, 66271-66277
Solvothermal synthesis of 1D nanostructured Mn2O3: effect of Ni2+ and Co2+ substitution on the catalytic activity of nanowires†
Received
23rd July 2015
, Accepted 30th July 2015
First published on 30th July 2015
Abstract
In this paper, cation modified one dimensional Mn2O3 nanowires were synthesized via a solvothermal synthesis and calcination free from the template-assisted method. The samples were characterized in detail by transmission electron microscopy (TEM), scanning electron microscopy (SEM), X-ray diffraction (XRD), Raman spectroscopy, high resolution transmission electron microscopy (HRTEM), X-ray photoelectron spectroscopy (XPS). XRD results revealed the homogeneity of Ni–Mn–O/Co–Mn–O solid solutions. By introducing the two different cations the Mn2O3 nanowires can be freely manipulated. The H2-TPR measurement showed the enhanced reduction behaviors of the doped manganese oxide (Mn2O3) samples. The presence of Ni2+ and Co2+ produced lattice defects and promoted the production of oxygen vacancies, which explained the results that Ni2+/Co2+ doped Mn2O3 showed higher catalytic activity than the pure sample.
1 Introduction
For decades, nanostructured materials have become one of the hottest topics in the field of materials science, among which one-dimensional (1D) metal-oxide nanostructures have attracted special attention because metal oxides are the most fascinating functional materials.1–4 The 1D morphologies can easily enhance the practical applications of metal-oxide nanostructures, including gas sensors,5–7 supercapacitors,8,9 nanocatalysts,10–13 and biosensors.14,15 Additionally, low-dimensional nano-structured materials make it possible to improve their functionalities through an increase in the surface area and quantum confinement effects.2 Manganese oxides (Mn2O3), as one of the most important transition oxides, is commonly used as the oxide support in a three-way catalyst. Generally, the catalytic activity of Mn2O3 originates from the terminated surface oxygen and is affected by the large specific surface area. Thus, an increase in the specific surface area and in concentration of the active oxygen located at the Mn2O3 surface are favorable methods to promote catalytic activity. Notably, the active oxygen located at the Mn2O3 surface is relative to reactive facets, surface defects (oxygen vacancies) and surface element composition.16–18 As is known, the shape-selective synthesis of Mn2O3 nanostructures is demonstrated to be a powerful method to promote their catalytic performance. For example, Zhang et al. reported flower-liked Mn2O3 dominated by (211) and (200) planes, selectively prepared by a facile hydrothermal method, showed an enhanced catalytic activity towards CO oxidation compared with Mn2O3 nanocubes.19
It is well known that cation substitution can provide an effective tool for tailoring the physicochemical properties of metal oxides,20,21 in which case the functionalities of Mn2O3 nanomaterials can be optimized by goal-directed control of the cation composition. So far, there are only a few reports about the method by changing surface element composition to promote the active oxygen content at the Mn2O3 surface, which will ultimately reveals strikingly high catalytic activity. For one instance, Ca2+ ion doped manganese oxides (CaMn2O4, CaMnO3 and Ca2Mn2O8) have been reported to enhance the catalytic activity of manganese oxides for water oxidation.22–24 Indeed, the homogeneously Ni doped CeO2 nanostructures displayed excellent catalytic activity towards CO oxidation.25 Copper doped ceria nanospheres exhibit higher catalytic activity than pure CeO2 nanospheres.26 We have previously shown that doping of carbonate with cobalt ions can produce enhanced catalytic performance towards CO oxidation.27 Generally, surface oxygen vacancies promote high dispersion and strong anchoring of transition metal ions on the metal oxides surface. Compared with the three-dimensional (3D) nanostructure, the high aspect ratio of 1D nanowires expose the surface oxygen vacancies on the surface of the nanostructure rather than embedding them in the bulk.28
Thus, in this work, we for the fist time present the fabrication of Ni2+ and Co2+ ions-substituted manganese oxide nanowires via the template-free solvothermal synthesis. The samples were characterized by TEM, HRTEM, XRD, Raman spectroscopy and XPS. The preliminary catalytic studies revealed that the Ni2+, Co2+ ions-doped Mn2O3 nanowires had strikingly higher catalytic activity than pure Mn2O3 nanowires and commercial Mn2O3.
2 Experimental
2.1 Materials
All the chemical reagents were of analytical grade, purchased from Sinopharm Chemical Reagent Co. Ltd (China) and used as received without further purification.
2.2 The synthesis of Ni2+- and Co2+-doped Mn2O3 nanowires
0.1 g of PVP (K30) and 0.06 g ethylenediaminetetraacetic acid disodium salt (EDTA disodium salt) were dissolved into the mixture solution of 5 mL H2O and 1 mL of N,N-dimethylformamide (DMF), Ni(Ac)2·4H2O and Co(Ac)2·4H2O weighed in molar ratios (M/(M + Mn)) of 5% were separately added to the above two mixture solution. After stirring for 30 min, 180 μL of Mn(NO3)2 solution (50 wt%) was added to the homogeneous solution. After stirring for another 20 min, the two mixture were transferred to two 25 mL Teflon-lined stainless steel autoclaves, respectively. All were maintained for 21 h at 180 °C. When the autoclave was cooled at room temperature, the products were collected and washed with absolute alcohol four times sequentially. Finally, the products were dried and were further annealed at 400 °C for 12 h in air with a temperate rate of 2 °C min−1. The pure without Ni2+ or Co2+-doped Mn2O3 nanowires were also produced via the same procedure to make as a comparison.
2.3 Physical characterization
The crystal structure information of the synthesized samples was established by powder X-ray diffraction (XRD Bruker D8 diffractometer with Cu-Kα radiation (λ = 0.15418 nm)). The microstructure morphology of the powders was observed by using a transmission electron microscope (TEM, JEM 1011-CXII, 100 kV). The field-emission scanning electron microscope (FE-SEM, Hitachi, S4800) equipped with energy-dispersive X-ray spectroscopy (EDS) and a high-resolution transmission electron microscope (HRTEM, JEM-2100, 200 kV) was used to characterize the specific morphologies. X-ray photoelectron spectroscopy (XPS) data were acquired on an ESCALAB 250 X-ray photoelectron spectrometer with Al Kα radiation and the binding energies were determined utilizing the C 1s spectrum as reference at 284.7 eV. The surface areas were calculated by the Brunauer–Emmett–Teller (BET) method. Raman data were obtained using a Lab RAM HR4800 spectrometer while using a 632 nm laser line as an excitation source. The Co2+, Ni2+ doping molar ratio in the samples were detected by an inductively coupled plasma spectrometer (ICP-AES) on an IRIS Intrepid II XSP instrument (Thermo Electron Corporation).
2.4 Temperature programmed reduction (TPR)
TPR experiments under a H2 environment were performed on a PCA-1200 instrument. Typically, 50 mg Mn2O3 catalyst was pretreated under a 5% He–Ar stream at 300 °C for 0.5 h (heating rate = 5 °C min−1). After cooling down to room temperature, a flow of 5% H2–Ar was introduced into the Mn2O3 sample with a flow rate of 30 mL min−1 and the temperature was raised to 800 °C at a rate of 10 °C min−1.
2.5 Catalytic experiments
The catalytic activity of the as-obtained samples was evaluated on a continuous flow fixed-bed micro-reactor operating under atmospheric pressure. In a typical experiment, 25 mg catalyst particles with 250 mg quartz sand were placed into a stainless steel tube reactor. The composition of the raw material gas is CO/O2/N2 (1![[thin space (1/6-em)]](https://www.rsc.org/images/entities/char_2009.gif) :10:89). The flow rate is 60 mL min−1. The temperature of the reactor was monitored by the thermocouple placed on the catalysts, and the heating rate was 1.7 K min−1. The products from the outlet of the reactor were analyzed using an online gas chromatograph (Gasboard-3121, China Wuhan Cubic Co).
:10:89). The flow rate is 60 mL min−1. The temperature of the reactor was monitored by the thermocouple placed on the catalysts, and the heating rate was 1.7 K min−1. The products from the outlet of the reactor were analyzed using an online gas chromatograph (Gasboard-3121, China Wuhan Cubic Co).
3 Results and discussions
3.1 Characteristics of nanowires
In general, crystal growth at the nanoscale is an intricate process, affected by additives such as surfactant, inorganic ions.29 Furthermore, the crystal lattice will contract when large-sized impurities are doped to substitute the host ions (small-sized) for hetero-valence ion doping into the host lattice.30 Here, when the reaction was carried out in the absence of Ni2+, Co2+ (with larger radii), nanowire samples can be obtained. Fig. 1 shows TEM and SEM of as-prepared nanowire samples. On the whole, the as-obtained nanowires were in queues length distribution. Observed in the TEM and corresponding SEM images, pure precursors (Fig. 1A1,2) have smooth surfaces with its length tens of micrometers. The Ni-doped precursors (Fig. 1B1,2) and Co-doped precursors (Fig. 1C1,2) remained the nanowire-shape well. However, the amorphous precursors were further exposed to the surroundings of 400 °C for 12 h to obtain the final manganese oxides.
 |
| | Fig. 1 TEM and SEM of the precursors of pure (A1,2) and Ni doped (B1,2) Co-doped (C1,2) Mn2O3. | |
It should be noted that the 1D nanostructure in all samples were quite thermally stable without structural collapse. Fig. 2 displays the panoramic views of the as-prepared manganese oxides. The pure sample keeps integral alignment structure with its mean diameter below 90 nm shown in Fig. 2a and the inserted magnified image. Amazingly, the Ni-doped Mn2O3 exposes its linearized surface with nanocrystallites (Fig. 2b) A magnified image (inserted in Fig. 2b) reveals that the well-defined Ni-doped Mn2O3 nanowires are constructed of nanocrystallites with a width of 50 nm, making up the diameters smaller than that of pure manganese oxides. Similarly, Fig. 2c indicates the Co-doped Mn2O3 nanowires consist of nano-crystallites to keep its whole nanostructures; also, the nanowires decrease its diameter to 75 nm. The decreased diameters of the Mn2O3 nanowires reveal that the cobalt and nickel ions have played a pivotal role during the growth process of the Mn2O3. In fact, both Co2+ (0.072 nm) and Ni2+ (0.069 nm) ions can accelerate the crystal nucleation rate,27 leading shorter time for maturity, resulting in the decreased size. Inductively coupled plasma (ICP) analysis indicated that the molar ratio of doping ions in Mn2O3 nanostructures are 1.34% for Ni-doped Mn2O3, which is lower than theoretical doping and 4.95% for Co-doped Mn2O3, which is close to the initial reactant composition (Table 1 in ESI†). Furthermore, the corresponding EDS mapping provides a direct elemental distribution in nanowire structure. As shown in Fig. 3, Mn, O, and Ni and Mn, O, Co are uniformly distributed in the Ni-doped and Co-doped Mn2O3 nanowires, which confirm the homogeneity of these manganese oxide nanowires.
 |
| | Fig. 2 SEM of the obtained Mn2O3: pure (a), Ni-doped (b), Co-doped (c) Mn2O3. The magnified images inserted on the left top. | |
 |
| | Fig. 3 A1 SEM image of the Ni-doped Mn2O3 nanowires and (A2–A4) the corresponding EDS mapping patterns: Mn (blue), O (red), and Ni (green). B1 SEM image of the Co-doped Mn2O3 nanowires and (B2–B4) the corresponding EDS mapping patterns: Mn (blue), O (red), and Co (green). | |
The crystal structure of the products was examined by powder X-ray diffraction (XRD). All of the samples, Mn2O3, Ni-doped Mn2O3 and Co-doped Mn2O3 display several peaks, corresponding to Mn2O3 (211), (222), (400) and (440) planes, indicating bixbyite crystal phase α-Mn2O3 (JCPDS no. 41-1442) (Fig. 4). It was noticed that no other peaks stemming from manganese carbonate, cobalt oxides or nickel oxides could be found, which confirm the formation of homogeneous oxide solid solutions for both samples (Ni-doped and Co-doped Mn2O3). In addition, a clear decrease in the peak intensity was observed in the nickel and cobalt doped samples compared to the pure Mn2O3, because of that doping resulted in the decrease of the degree of crystallization.
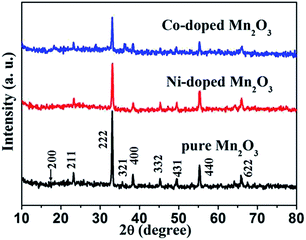 |
| | Fig. 4 XRD patterns of the synthesized pure Mn2O3, Ni-doped Mn2O3 and Co-doped Mn2O3. | |
Raman scattering is an effective tool for measuring and comprehending the catalytic activity of manganese oxides and for investigating the presence of defects (such as oxygen vacancies) among doped nanomaterials.31 The contrastive Raman spectra of pure, Ni- and Co-doped Mn2O3 are displayed in Fig. 5a. For pure one, three main bands at ∼312, ∼368, ∼653 cm−1 can be attributed to the out-of-plane bending modes of Mn2O3, asymmetric stretching of bridge oxygen species (Mn–O–Mn), and symmetric stretching of Mn2O3 groups, respectively.32,33 The absence of the Ni–O/Co–O characteristic peak (550/680 cm−1) is indicative of the formation of solid solutions as indicated by the XRD results.34,35 For doped Mn2O3, the incorporation of Co2+/Ni2+ leads to blue shifts of the lattice Raman vibrational peak positions (Fig. 5b), confirming local structure distortion.30,36,37 In addition, the intensity reduction and the broadening of the main Raman peak are observed, demonstrating the lattice defects occur when heterovalent Ni/Co ions are introduced as well.37 These defects are correlated with oxygen vacancy creation for charge compensation when Mn3+ ions are replaced with divalent cations. As a result, these will favor oxygen mobility and enhance the catalytic behavior of the as-prepared material.38–40
 |
| | Fig. 5 Raman spectra of as-obtained Mn2O3, Ni-doped Mn2O3 and Co-doped Mn2O3 (a), and the magnified pattern from 600 to 720 cm−1 (b). | |
The elementary composition and chemical valence on the surface of the as-prepared nanowires were detected by X-ray photoelectron spectra (XPS). Fig. 6 shows the XPS spectrum of pure Ni-doped and Co-doped Mn2O3 samples. The typical binding energy (BE) peaks (such as those at 641.8 and 653.6 eV) of the Mn 2p spectrum (Fig. 6b) are observed in the as-obtained samples, which suggest the existence of Mn(III) in our products.40 The core level peak of Co 2p (Fig. 6d blue line) at 781.8 eV is powerful to determine that the valence of Co is 2+.41,42 The Ni 2p spectrum (Fig. 6d red line) depicts the weak peaks due to the low Ni concentration which is verified by the above ICP analysis, but (BE) peaks at 855.2 can be applied to predicate that the valence state of Ni is +2.43 In the O 1s XPS spectrum (Fig. 6c), the BE peak located at 529.9 eV can be indexed to the lattice oxygen of Mn2O3.44 It is obvious that the shoulder width of the main BE peak is much broader than that in the pure Mn2O3 (black line), corresponding to the appearance of defective oxygen regions or adsorbed oxygen, indicating a better capacity for oxygen storage, which is also related to the activity of oxidization reaction.37,45,46
 |
| | Fig. 6 (a) The corresponding XPS survey spectrum of nano-wires: pure Mn2O3 (black line), Ni-doped Mn2O3 (red line) and Co-doped Mn2O3 (blue line); (b) Mn 2p; (c) O 1s, and (d) Co 2p and Ni 2p. (a), (b) and (c) are pure, Ni-doped and Co-doped Mn2O3 curves, respectively. | |
High-resolution TEM (HRTEM) imaging was applied to investigate the detailed structure of the Co-doped Mn2O3, which is shown in Fig. 7. Clear lattice fringes were detected in the images of Fig. 7a and b. An interplanar spacing of about 0.479 nm corresponded to the (200) planes of Mn2O3, and another at about 0.355 nm was attributed to the (211) planes. Moreover, the selected-area electron diffraction (SAED) pattern (Fig. 7c) showed the characteristic diffraction rings, which were assigned to the (200), (211), (222), (321), (332) and (622) crystal planes. Indeed, the SAED pattern exhibits a set of regular spots, which demonstrate the products are formed of many small nanoparticles. Interestingly, the nanoparticles are closely packed and oriented in the same way, as confirmed by a set of electron diffraction spots in the SAED pattern. In addition, the lattice fringes with ad-spacing of 0.479 nm (see the HRTEM image in Fig. 7a) from different nanoparticles are parallel to each other.
 |
| | Fig. 7 HR-TEM images (a) and (b), the corresponding SAED pattern (c) of the as-prepared 5 mol% Co-doped Mn2O3. | |
3.2 TPR
H2-TPR tests can reveal the properties of the oxygen vacancies for Mn2O3, which is an important factor affecting the catalytic activity.47 H2-TPR measurements were performed on the as-prepared pure and Co-/Ni-doped Mn2O3 nanowires to reveal their redox properties (Fig. 8). The reduction of Mn2O3 sample exhibits two well-defined peaks with the maxima at 469, 541 °C. The former (α-peak) is probably attributed to the reduction of Mn2O3 to Mn3O4 and the higher temperature peak (β-peak) can correspond to the further reduction of Mn3O4 to MnO. The reduction of MnO to Mn metal was not detected even up to a reduction temperature of 800 °C, because of its larger negative value of reduction potential.48 Clearly observed that the reduction peaks firstly shifts to lower temperature, which can be attributed to the reduction of Co2+/Ni2+ ion that is incorporated to the crystal lattice of the Mn2O3 host. Furthermore, there is a direct proportion relationship between the peak areas of the curves and the amount of H2 consumption.49 Here, peak areas of the above three samples (pure, Co2+-, Ni2+-) are with a sequence Co2+ → Ni2+ → pure, which indicates the doped samples have better reduction behavior. All the above confirms the lattice defects and the more surface oxygen species of the doped samples which lead to excellent catalytic properties.
 |
| | Fig. 8 H2-TPR profiles of pure Mn2O3, Ni-doped Mn2O3 and Co-doped Mn2O3. | |
3.3 Catalytic properties
Because of its particular redox property, Mn2O3 is an important catalyst. It was discovered that the oxygen in the lattice of Mn2O3 surface could react with CO while releasing the oxidation product CO2 and creating an O vacancy in the lattice.50 Here, the CO conversion reaction was selected to evaluate the catalytic property of our prepared samples. Fig. 9 displays the catalytic activities of the samples (Ni-doped Mn2O3 and Co-doped Mn2O3), along with the pure Mn2O3 nanowires. No matter pure or doped Mn2O3, it can be clearly seen that the catalytic performance of our products have been sharply improved by comparison with commercial Mn2O3. As shown in Table 1 (ESI†) the series of our samples have a large surface area while the commercial ceria are only 5.816 m2 g−1. The BET surface areas data can be a first evidence to explain the difference catalytic property between our products and commercial Mn2O3 as a result of the higher surface area can increase more active sites for conversion.51,52 It was worth mentioning that the rates of the CO conversion of Ni-doped and Co-doped Mn2O3 nanowires were considerably fast with a temperature scale of about 80 °C and 75 °C, respectively.
 |
| | Fig. 9 Percentage conversion versus temperature plots for the oxidation of CO over Mn2O3, Ni-doped Mn2O3 and Co-doped Mn2O3. | |
But, the evaluated temperature of the pure Mn2O3 nanowires is from 170 °C to 270 °C. The increased catalytic activity of the doped products is due to the increased surface area and the promoted active oxygen content caused by ions' substitution. Luo et al. has reported the oxidizing of CO on the α-Mn2O3 surfaces may proceed through the Langmuir–Hinshelwood mechanism (<220 °C) to Mars–van-Krevelen mechanism (>350 °C) with the increasing of reaction temperature.32 In fact, all of our Mn2O3 nanowire materials oxidize CO by a Langmuir–Hinshelwood mechanism, in which the role of the dopant is to facilitate the formation of oxygen vacancies. The CO oxidization process can be divided into three stages, the O2 dissociative adsorption [eqn (1) and (2)] and its surface reaction with CO [eqn (3)]53
| | |
CO–* + O–⊕ → CO2(g) + * + ⊕
| (3) |
* and ⊕ denote metal and support sites, respectively.
In the case of Mn2O3, a surface phase transformation from α-Mn2O3 to MnO-like species, during the adsorption and oxidation of CO for the first time. An oxygen vacancy is created in the process. The oxygen gas then reacts with the surface to regenerate a surface oxygen atom [eqn (1) and (2)]. Highly reactive atomic oxygen is formed due to the dissociation of molecular oxygen at the vacancy site.26 Finally, CO reacts with the highly active atomic oxygen to generate CO2 [eqn (3)]. When Ni2+, Co2+ cations were incorporated into Mn2O3 lattice, the extra oxygen vacancies were generated to compensate for the valence mismatch between Ni2+/Co2+ and Mn3+. A large amount of oxygen vacancies not only promote the dissociation of reactants by strong binding, but also produce excess electrons,54,55 which tend to localize on the near pair of Mn3+ due to unreducible Co2+ and Ni2+ doped into the lattice, and result in highly reducible Mn2O3. More than that, the smaller Ni and Co dopants can set some space free to accommodate the bigger Mn2+, which helps to release the lattice strain and to get the lattice energy down.56 Therefore, the enhanced catalytic activity of Ni2+-/Co2+-doped Mn2O3 can be attributed to the lattice change and the promoted oxygen vacancies, which can increase catalytically active sites. Notably, it's worth considering the higher catalytic performance Co-doped Mn2O3 nanowires have than Ni-doped Mn2O3 was due to the actual doping amount and the intrinsic characteristics of cobalts and nickel on the catalytic activity. In fact, the essential distinction is under investigation, which will be presented in our future work.
To demonstrate the thermal stability of the as-prepared Mn2O3 nanowires, the recycling catalytic tests were performed 6 times. It was found that the catalytic efficiency remains nearly constant for Co-doped (Fig. 10a), and Ni-doped (Fig. 10b) along with pure (Fig. S3†) Mn2O3, which can be demonstrating its excellent stability and recycling performance. Expectedly, the features of the catalysts remain almost unchanged after the 6 times' catalysis, which are confirmed by the SEM images (Fig. S1†) and XRD patterns (Fig. S2) (ESI†). It is obvious that our as-prepared cation-doped Mn2O3 nanowires catalysts possess a desirable stability.
 |
| | Fig. 10 Catalytic performance of Co-doped Mn2O3 (a) and Ni-doped Mn2O3 (b) in different runs. | |
4 Conclusions
In summary, we have obtained Ni-doped and Co-doped manganese oxides (Mn2O3) 1 D nanowire via a solvothermal synthesis followed by calcination that free of template-assisted route, and the composition and morphology can be easily controlled by the use of different dopants as reactants. Preliminary catalytic results indicated that Ni-, Co-doped Mn2O3 had excellent catalytic activity towards CO oxidation. With the help of SEM, XRD, Raman, EDS mapping and HRTEM, XPS, H2-TPR, we achieved a better understanding of the phenomena that Ni2+, Co2+ incorporated into the Mn2O3 lattice leading to richer oxygen vacancies, which contributed to the improvement of the catalytic performance in CO oxidation of our doped samples.
Acknowledgements
This work was supported by the Natural Science Foundation of China (grant no. 21276142 and 21476129).
References
- B. H. Liang, S. Liu and S. Yu, Adv. Mater., 2010, 22, 3925–3937 CrossRef PubMed.
- B. H. Park, S. Lee, T. W. Kim, S. T. Lim, S. Hwang, Y. Yoon, Y. Lee and J. Choy, Adv. Funct. Mater., 2007, 17, 2949–2956 CrossRef CAS PubMed; Q. Javed, F. P. Wang, M. Y. Rafique, A. M. Toufiq, Q. S. Li, H. Mahmood and W. Khan, Nanotechnology, 2012, 23, 415603 CrossRef PubMed.
- Y. Guo, L. Xu, H. Liu, Y. Li, C. Che and Y. Li, Adv. Mater., 2015, 27, 985–1013 CrossRef CAS PubMed.
- R. S. Devan, R. A. Patil, J. Lin and Y. Ma, Adv. Funct. Mater., 2012, 22, 3326–3370 CrossRef CAS PubMed.
- Y. L. Wang, X. C. Jiang and Y. N. Xia, J. Am. Chem. Soc., 2003, 125, 16176–16177 CrossRef CAS PubMed.
- G. X. Wang, J. S. Park, M. S. Park and X. L. Gou, Sens. Actuators, B, 2008, 131, 313–317 CrossRef CAS PubMed.
- V. T. Le, T. N. L. Le and V. H. Nguyen, Sens. Actuators, B, 2010, 150, 112–119 CrossRef CAS PubMed.
- Z. Zeng, P. Sun, J. Zhu and X. Zhu, RSC Adv., 2015, 5, 17550–17558 RSC.
- Y. B. He, G. R. Li, Z. L. Wang, C. Y. Su and Y. X. Tong, Energy Environ. Sci., 2011, 4, 1288–1292 CAS.
- C. Pan, D. Zhang, L. Shi and J. Fang, Eur. J. Inorg. Chem., 2008, 10, 2429–2436 CrossRef PubMed.
- C. Pan, D. Zhang and L. Shi, J. Solid State Chem., 2008, 181, 1298–1306 CrossRef CAS PubMed.
- S. Liang, F. Teng, G. Bulgan, R. Zong and Y. Zhu, J. Phys. Chem. C, 2008, 112, 5307–5315 CAS.
- V. B. R. Boppana and F. Jiao, Chem. Commun., 2011, 47, 8973–8975 RSC.
- W. Zheng, Y. F. Zheng, K. W. Jin and N. Wang, Talanta, 2008, 74, 1414–1419 CrossRef CAS PubMed.
- M. A. Kumar, S. Jung and T. Ji, Sensors, 2011, 11, 5087–5111 CrossRef PubMed.
- S. Carrettin, P. Concepcion, A. Corma, J. M. L. Nieto and V. F. Puntes, Angew. Chem., Int. Ed., 2004, 43, 2538–2540 CrossRef CAS PubMed.
- H. X. Mai, L. D. Sun, Y. W. Zhang, R. Si, W. Feng, H. P. Zhang, H. C. Liu and C. H. Yan, J. Phys. Chem. B, 2005, 109, 24380–24385 CrossRef CAS PubMed.
- M. Nolan, S. C. Parker and G. W. Watson, Surf. Sci., 2005, 595, 223–232 CrossRef CAS PubMed.
- C. Zhang, L. Han, W. Liu, H. Yang, X. Zhang, X. Liu and Y. Z. Yang, CrystEngComm, 2013, 15, 5150–5155 RSC.
- B. Ammundsen and J. Paulsen, Adv. Mater., 2001, 13, 943–956 CrossRef CAS.
- S. J. Hwang, H. S. Park, J. H. Choy and G. Campet, J. Phys. Chem. B, 2000, 104, 7612–7618 CrossRef CAS.
- D. Hong, Y. Yamada, A. Nomura and S. Fukuzumi, Phys. Chem. Chem. Phys., 2013, 15, 19125–19128 RSC.
- M. M. Najafpour, T. Ehrenberg, M. Wiechen and P. Kurz, Angew. Chem., Int. Ed., 2010, 49, 2233–2237 CrossRef CAS PubMed.
- M. M. Najafpour, B. Pashaei and S. Nayeri, Dalton Trans., 2012, 41, 4799–4805 RSC.
- T. Y. Li, G. L. Xiang, J. Zhuang and X. Wang, Chem. Commun., 2011, 47, 6060–6062 RSC.
- F. Yang, J. Wei, W. Liu, J. Guo and Y. Yang, J. Mater. Chem. A, 2014, 2, 5662–5667 CAS.
- X. Niu, H. Wei, W. Liu, S. Wang, J. Zhang and Y. Yang, RSC Adv., 2015, 5, 33615–33622 RSC.
- H. Zhou, Y. Shi, Q. Dong, J. Lin, A. Wang and T. Ma, J. Phys. Chem. C, 2014, 118, 20100–20106 CAS.
- Y. Yin and A. P. Alivisatos, Nature, 2005, 437, 664–670 CrossRef CAS PubMed.
- D. Chen and Y. Wang, Nanoscale, 2013, 5, 4621–4637 RSC.
- Y. Dai, H. Jiang, Y. Hu and C. Li, RSC Adv., 2013, 3, 19778–19781 RSC.
- Y. Luo, Y. Deng, W. Mao, X. Yang, K. Zhu, J. Xu and Y. Han, J. Phys. Chem. C, 2012, 116, 20975–20981 CAS.
- Y. Han, K. Ramesh, L. Chen, E. Widjaja, S. Chilukoti and F. Chen, J. Phys. Chem. C, 2007, 111, 2830–2833 CAS.
- J. Zhang, G. Cai, D. Zhou, H. Tang, X. Wang, C. Gu and J. Tu, J. Mater. Chem. C, 2014, 2, 7013–7021 RSC.
- M. A. Vuurman, D. J. Stufkens, A. Oskam, G. Deo and I. E. Wachs, J. Chem. Soc., Faraday Trans., 1996, 92, 3259–3265 RSC.
- F. Arena, G. Trunfio, J. Negro, B. Fazio and L. Spadaro, Chem. Mater., 2007, 19, 2269–2276 CrossRef CAS.
- W. Liu, X. F. Liu, L. J. Feng, J. X. Guo, A. R. Xie, S. P. Wang, J. C. Zhang and Y. Z. Yang, Nanoscale, 2014, 6, 10693–10700 RSC.
- Y. Lee, G. H. He, A. J. Akey, R. Si, M. Flytzani-Stephanopoulos and I. P. Herman, J. Am. Chem. Soc., 2011, 133, 12952–12955 CrossRef CAS PubMed.
- G. Avgouropoulos, T. Ioannides, H. K. Matralis, J. Batista and S. Hocevar, Catal. Lett., 2001, 73, 33–40 CrossRef CAS.
- L. Zhao, X. Li and J. Zhao, Appl. Surf. Sci., 2013, 268, 274–277 CrossRef CAS PubMed.
- L. Fu, Z. Liu, Y. Liu, B. Han, P. Hu, L. Cao and D. Zhu, Adv. Mater., 2005, 17, 217–221 CrossRef CAS PubMed.
- B. Ernst, S. Libs, P. Chaumette and A. Kiennemann, Appl. Catal., A, 1999, 186, 145–168 CrossRef CAS.
- D. Hong, Y. Yamada, T. Nagatomi, Y. Takai and S. Fukuzumi, J. Am. Chem. Soc., 2012, 134, 19572–19575 CrossRef CAS PubMed.
- M. M. Rahman, S. B. Khan, M. Faisal, M. A. Rub, A. O. Al-Youbi and A. M. Asiri, Talanta, 2012, 99, 924–931 CrossRef CAS PubMed.
- X. Y. Zhang, J. J. Wei, H. X. Yang, X. F. Liu, W. Liu, C. Zhang and Y. Yang, Eur. J. Inorg. Chem., 2013, 25, 4443–4449 CrossRef PubMed.
- S. P. Wang, X. C. Zheng, X. Y. Wang, S. R. Wang, S. M. Zhang, L. H. Yu, W. P. Huang and S. H. Wu, Catal. Lett., 2005, 105, 163–168 CrossRef CAS.
- J. Ke, J. W. Xiao, W. Zhu, H. C. Liu, R. Si, Y. W. Zhang and C. H. Yan, J. Am. Chem. Soc., 2013, 135, 15191–15200 CrossRef CAS PubMed.
- M. Luo, X. Yuan and X. Zheng, Appl. Catal., A, 1998, 175, 121–129 CrossRef CAS.
- J. Zhang, H. Yang, S. Wang, W. Liu, X. Liu, J. Guo and Y. Yang, CrystEngComm, 2014, 16, 8777–8785 RSC.
- D. K. Kim, K. Stöwe, F. Müller and W. F. Maier, J. Catal., 2007, 247, 101–111 CrossRef CAS PubMed.
- C. M. A. Parlett, K. Wilson and A. F. Lee, Chem. Soc. Rev., 2013, 42, 3876–3893 RSC.
- S. Y. Lai, Y. Qiu and S. Wang, J. Catal., 2006, 237, 303–313 CrossRef CAS PubMed.
- S. Royer and D. Duprez, ChemCatChem, 2011, 3, 24–65 CrossRef CAS PubMed.
- M. Nolan, S. C. Parker and G. W. Watson, J. Phys. Chem. B, 2006, 110, 2256–2262 CrossRef CAS PubMed.
- M. Nolan, S. C. Parker and G. W. Watson, Surf. Sci., 2006, 600, 175–178 CrossRef PubMed.
- Z. Yang, Z. Fu, Y. Wei and Z. Lu, J. Phys. Chem. C, 2008, 112, 15341–15347 CAS.
Footnote |
| † Electronic supplementary information (ESI) available: The surface areas and the compositional data of the as prepared Mn2O3 samples. SEM and XRD of Ni-doped Mn2O3 and Co-doped Mn2O3 nanowires after catalysis for 6 times. Catalytic performance of pure Mn2O3 nanowires in different runs. See DOI: 10.1039/c5ra14618f |
|
| This journal is © The Royal Society of Chemistry 2015 |
Click here to see how this site uses Cookies. View our privacy policy here. 


