
Synthesis and size-dependent electrochemical nonenzymatic H2O2 sensing of cuprous oxide nanocubes
Lingyu
Meng
,
Deli
Jiang
,
Chaosheng
Xing
,
Xiaomeng
Lü
and
Min
Chen
*
School of Chemistry and Chemical Engineering, Jiangsu University, Zhenjiang 212013, China. E-mail: chenmin3226@sina.com
First published on 24th September 2015
Abstract
In this work, we reported an electrochemical approach for the nonenzymatic detection of H2O2 based on a cuprous oxide (Cu2O) nanocube-based sensor. The Cu2O nanocubes were synthesized with controllable sizes from 40 nm to 360 nm through a facile additive-free aqueous solution route at room temperature. The electrocatalytic activities of the Cu2O nanocubes with five different sizes towards H2O2 were systematically explored, and it was found that the electrocatalytic activity was strongly dependent on the size of the Cu2O nanocubes. The cyclic voltammetry and amperometry results show that these Cu2O nanocubes exhibited good electrocatalytic activity with a linear response ranging from 0.5 to 8.5 mM at −0.2 V and a detection limit of 1.61 μM (S/N = 3). Furthermore, the Cu2O nanocubes of five different sizes have good selectivity for H2O2 detection with ascorbic acid (AA), uric acid (UA) and glucose (Glu).
1. Introduction
Research on the quantitative detection of H2O2 has been given considerable attention, since H2O2 is a common oxidizing agent and an essential intermediate in biomedical, pharmaceutical, industrial and environmental protection and electrochemistry.1–4 Many traditional techniques, including chemiluminescence, titrimetry spectrophotometry, fluorescence and electrochemical method have been employed to detect H2O2.5–11 Among those techniques, non-enzymatic electrode-based electrochemical method holds a leading position among various techniques due to its high sensitivity, simple operation, low cost, and the possibility for real-time detection.12–15 For the last two decades, nanomaterial-modified electrodes are widely applied as transducers in various fields like sensors due to their better physical, chemical, electrochemical properties and higher surface area compared to their counter bulk materials. Many nanomaterials, including metal nanoparticles, metal hexacyanoferrate, metal oxide, have been employed to construct electrochemical H2O2 sensors.16–21 Our group has recently synthesized Ag/C nanocomposites and silver deposited porous graphitic C3N4 nanocomposites (Ag/p-g-C3N4) for nonenzymatic electrochemical H2O2 sensing which exhibited high sensitivity and low detection limit.22,23 However, using the materials above in electrochemical sensors to promote the redox reaction processes and electrochemical detection H2O2 still remains in the early stage. Therefore, it is greatly desirable to explore new nanomaterials for the fast and accurate detection of H2O2.Among various oxide materials, cuprous oxide (Cu2O), an important p-type semiconductor with a band gap of 2.17 eV, has been paid much attention to in recent years because of its intrinsic properties and wide potential applications in many fields such as photochemical catalysis, biosensing, gas sensor, electrochemical sensing and solar/photovoltaic energy conversion.24–31 The Cu2O nanocrystals have been used to modify electrode for detecting H2O2.32,33 As an instance, Zhang et al. synthesized porous cuprous oxide microcubes through a simple sonochemical route and studied its electrocatalytic activities as a nonenzymatic H2O2 sensor with the low detection limit, wide linear detection ranges and a high sensitivity.34 As is well known, shape, size and microstructures are the main factors that determine the chemical and physical properties of nanomaterials. For example, Li and co-workers synthesized four different morphologies of cuprous oxide (Cu2O) nanocrystals (cube, rhombic dodecahedra, octahedra, and extended hexapod) by a hydrothermal method and systematically explored the electrocatalytic activities of the four different Cu2O nanocrystals towards H2O2, which are strongly dependent on the shape of the Cu2O nanocrystals.35 Equally important, size effect has been regularly utilized to tune the catalytic activity and selectivity of nanoparticles (NPs). However, there is a lack of understanding of the size effect in the electrocatalytic reduction of H2O2. Therefore, studying the influence of the size of cuprous oxide on its electrochemical properties is of great importance and desirable.
In this work, we synthesize the Cu2O nanocubes of five different sizes with well-defined cubic shape, uniform size and good dispersibility by a facile method. To compare the electrocatalytic activity of the Cu2O nanocubes with five different sizes, we designed an enzymeless H2O2 sensor by direct deposition of the Cu2O on a bare glassy carbon electrode (GCE) surface. By analyzing cyclic voltammograms (CVs) and amperometric response, the influence of Cu2O nanocubes size on electrocatalytic properties toward H2O2 were investigated. This work provides a valuable reference for synthesizing high-efficiency nonenzymatic Cu2O-based or other H2O2 sensor.
2. Experimental section
2.1. Materials
Ascorbic acid (AA), uric acid, glucose, hydrogen peroxide (H2O2, 30 wt%), ethanol, sodium hydroxide and copper acetate monohydrate were purchased from Sinopharm Chem. Reagent Co., Ltd (Shanghai, China). All chemicals were used as received without further purification. The water used was double distilled after a deionized exchange.2.2. Synthesis of the Cu2O nanocrystals
Cu2O nanocrystals of five different sizes were synthesized according to the method reported previously, and the details are described as follows.36 In a typical synthesis, a mixture of 20.0 mL of 0.009 M AA solution and 32.0 mL of NaOH solution with different concentration (0.078 M, 0.156 M, 0.234 M, 0.312 M and 0.391 M) was added into 32.0 mL of previously prepared 0.005 M Cu(Ac)2·H2O solution under stirring. The mixed solution was then stirred vigorously for 30 min, during which the solution became yellow and turbid, indicating the formation of Cu2O. Finally, the precipitates were collected, washed with distilled water and absolute ethanol several times and dried in vacuum at 60 °C for 5 h. In addition, the sample was dispersed in ethanol for further characterization. All the experiments were carried out at room temperature. Five different samples are recorded as S-1, S-2, S-3, S-4 and S-5, respectively.2.3. Preparation of the modified electrode and electrochemical measurements
1.0 mg of Cu2O nanocrystals and 10 μL of Nafion solution (5 wt%) were dispersed in 1 mL water–isopropanol mixed solvent (3![[thin space (1/6-em)]](https://www.rsc.org/images/entities/char_2009.gif) :1 v/v) by at least 30 min sonication to form a homogeneous catalyst solution. The GCE was carefully polished in 0.3 and 0.05 nm alumina slurry, respectively, and washed with ultrapure water followed by sonication in water for 10 min. Then 10 μL of the catalyst solution was dropped onto the surface of the cleaned GCE and left to dry at room temperature to get Cu2O-modified GCE, referred to as Cu2O/GCE. Amperometric and cyclic voltammetry (CV) experiments were carried out by a CHI 650D electrochemical analyzer, in a home-made three electrode electrochemical cell consisting of a twisted platinum wire as an auxiliary electrode, a saturated calomel electrode (SCE) as a reference electrode and a modified-GCE (0.20 cm2) as a working electrode. All experiments were carried out at the ambient temperature. Prior to the experiment, the electrolyte consisting of a solution of 0.2 M phosphate buffer solution (PBS, pH 7.4), was purged with high-purity nitrogen for at least 30 min and a nitrogen atmosphere was maintained over the solution.
:1 v/v) by at least 30 min sonication to form a homogeneous catalyst solution. The GCE was carefully polished in 0.3 and 0.05 nm alumina slurry, respectively, and washed with ultrapure water followed by sonication in water for 10 min. Then 10 μL of the catalyst solution was dropped onto the surface of the cleaned GCE and left to dry at room temperature to get Cu2O-modified GCE, referred to as Cu2O/GCE. Amperometric and cyclic voltammetry (CV) experiments were carried out by a CHI 650D electrochemical analyzer, in a home-made three electrode electrochemical cell consisting of a twisted platinum wire as an auxiliary electrode, a saturated calomel electrode (SCE) as a reference electrode and a modified-GCE (0.20 cm2) as a working electrode. All experiments were carried out at the ambient temperature. Prior to the experiment, the electrolyte consisting of a solution of 0.2 M phosphate buffer solution (PBS, pH 7.4), was purged with high-purity nitrogen for at least 30 min and a nitrogen atmosphere was maintained over the solution.
2.4. Characterization
Purity and crystallization of the samples were characterized by powder X-ray diffraction on a D/max-gA X-ray spectrometer (Rigaku, Japan) at 40 kV and 200 mA with monochromatic Cu Kα (λ = 1.5418 Å) radiation. Transmission electron microscopy (TEM) images were taken on a TECNAI12 TEM instrument (Philips) with an accelerating voltage of 200 kV. Scanning electron micrograph (SEM) was taken on a field emission SEM instrument (Hitachi S-4800 II, Japan). The Brunauer–Emmett–Teller (BET) specific surface areas of the powders were analyzed by nitrogen adsorption/desorption at 77 K by a TriStar II 3020-BET/BJH Surface Area. Each sample was degassed at 150 °C prior to nitrogen adsorption measurement. The BET surface area was determined using adsorption data in the relative pressure (P/P0) range of 0.05–0.3. Electrochemical measurements were performed with a CHI 650D electrochemical analyzer (CH Instruments, Inc., Shanghai).3. Results and discussion
3.1. Morphology and structure of the Cu2O nanocrystals
XRD was used to identify and determine the phase structures of the as-prepared samples. As shown in Fig. 1, the XRD pattern of the five Cu2O samples reveals six distinct diffraction peaks at 29.5°, 36.4°, 42.3°, 61.3°, 73.5° and 77.3°, corresponding to the (110), (111), (200), (220), (311) and (222) diffraction planes of the pure cubic phase Cu2O, which is consistent with the standard value (cuprite, JCPDS no. 05-0667) without the presence of any impurities. The diffraction peaks are strong and narrow, indicating that the products are highly crystallized.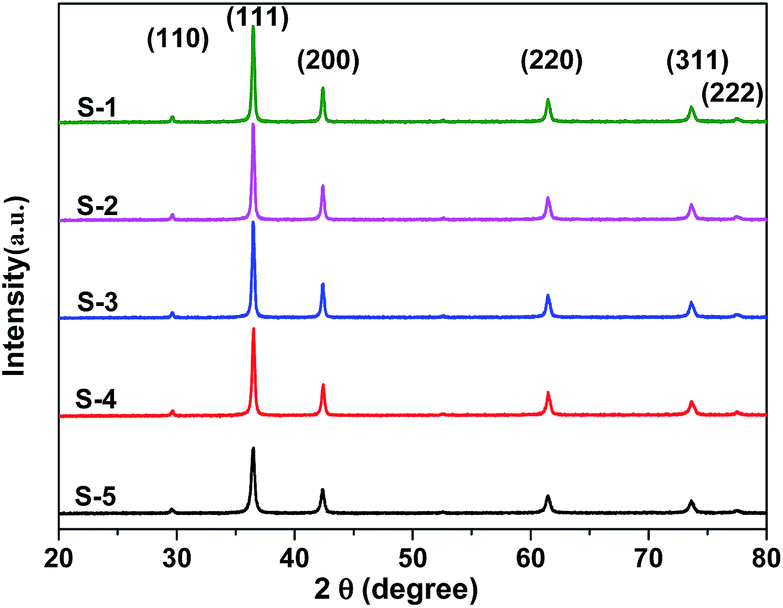 | ||
| Fig. 1 XRD patterns for the as-prepared samples: S-1, S-2, S-3, S-4, S-5. | ||
The shapes and particle size of the five different Cu2O samples can be clearly observed by FESEM. As shown in Fig. 2a–e, each sample is composed of a large amount of well-defined nanocubes with high uniformity and monodispersion. In addition, the sizes of the nanocubes increased with the increasing of the NaOH concentration added in the experimental process. Schematic diagram for the size of the Cu2O nanocubes samples increased with the increasing of sodium hydroxide concentration in the synthesis process is shown in Scheme 1. Because the size of the nuclei is expected to be always essentially the same, the size of the primary particles in a given system is a function of the initial number of nuclei and the concentration of the remaining precursors.36 In the case of oxidation–reduction processes, the equilibrium constant Ke is a function of reduction potential, lnKe = nFΔE0/RT. In general, one should expect that a larger value of ΔE0 leads to a higher supersaturation and, consequently, a larger number of nuclei formed. Since the redox potentials of both Cu2+ and starch have pronounced pH dependence, the magnitude of ΔE0 must change with the pH value, having an impact on the primary particle size.37 NaOH can serve as a ligand and form a Cu(OH)42− complex with Cu2+, which decreases the reducing potential, the reduction rate of Cu2+, and the supersaturation of the solution.38 However, the reduction rate is enhanced by high pH, in which the reduction reaction can occur at room temperature under highly alkaline conditions, and then leads to higher supersaturation. The supersaturation of Cu2O crystals was decreased owing to the complexation of OH−, thus few nuclei were formed, favoring the formation of large polyhedra. At higher or lower pH, a large number of nuclei were formed due to enhanced reducing ability and weak complexation ability. Then, a large number of nuclei were formed and small polyhedra could be crystallized. The competition between the complexation and reduction reactions is the reason for the pH-dependent size control.
 | ||
| Fig. 2 SEM images of Cu2O nanocubes samples: (a): S-1; (b): S-2; (c): S-3; (d): S-4; (e): S-5 and the corresponding size distribution histogram (inset). TEM images of Cu2O nanocubes samples: (f) S-1; (g) S-2; (h) S-3; (i) S-4; (j) S-5 and HRTEM images of S-1 (inset of f). | ||
 | ||
| Scheme 1 Schematic diagram for the size of the Cu2O nanocubes samples increased with the increasing of sodium hydroxide concentration in the synthesis process. | ||
For purpose of presenting the specific diameter size of the five Cu2O samples in more detail, size distribution histogram of Fig. 2a–e were carried out (inset of Fig. 2a–e). When 2.49 mmol of NaOH was added into the reaction system, the Cu2O nanocubes with an average size of around 69 nm was produced (Fig. 2a). When we increased the amount of NaOH to 5.0 mmol, the average size of products increased to 73 nm (Fig. 2b). Further increase the NaOH concentration, Cu2O nanocubes with average sizes of 87 nm, 178 nm, and 301 nm were formed (Fig. 2c–e).
In order to further study the microstructure of the five different Cu2O samples, TEM observations were carried out. The TEM image shown in Fig. 2f–j also verified that the products were nanocubes with well-defined shape, uniform size and good dispersibility. As can be seen from the TEM images, the sizes of five different Cu2O simples increase in the order from (f) to (j). The HRTEM image of one S-1 nanoparticle gives us further insight into the microstructure and crystallinity of the as-prepared Cu2O nanocubes (inset of Fig. 2f). The lower right inset of Fig. 2f shows two sets of clear lattice fringes with interplanar distance of 0.213 and 0.246 nm, corresponding to (200) and (111) lattice planes, respectively, in good agreement with the standard card JCPDS no.05-0667. These results are consistent with above XRD and SEM observations.
3.2. Electrochemical sensing of H2O2
H2O2 is a chemical used widely in the food, pharmaceutical, paper, and chemical industries. It is also a by-product of the reaction catalyzed by a large number of oxidase enzymes. The precise and rapid detection of H2O2 is of practical significance for both biochemical and environmental applications. Electrochemical H2O2 sensors, especially nonenzymatic amperometric sensors, have attracted extensive attention due to their high sensitivity, simplicity, good compatibility and long term stability. The promising application as an enzyme-free sensor for H2O2 was selected as a preliminary test of the electrocatalytic behaviors of as-prepared five different Cu2O nanocubes.To compare the electrocatalytic activity of the Cu2O nanocubes with five different sizes, we designed an enzymeless H2O2 sensor by direct deposition of the Cu2O on a bare GCE surface. The cyclic voltammograms of the S-1/GCE, S-2/GCE, S-3/GCE, S-4/GCE and S-5/GCE in N2 saturated 0.2 M pH 7.4 PBS containing 5.0 mM H2O2 are shown in Fig. 3. There is a strong redox peaks between −0.3 and −0.2 V in the five modified electrodes, the anodic and cathodic peak can be ascribed to the oxidation of Cu2O to CuO and the reduction of CuO to Cu2O.
 | ||
| Fig. 3 Cyclic voltammograms (CVs) of bare GCE, S-1/GCE, S-2/GCE, S-3/GCE, S-4/GCE and S-5/GCE in N2-saturated 0.2 M PBS at pH 7.4 in the presence of 5.0 mM H2O2 (scan rate: 50 mV s−1). | ||
The reaction equation can be expressed as:
| 2CuO + H2O + 2e → Cu2O + 2OH− | (1) |
| Cu2O + H2O2 → 2CuO + H2O | (2) |
It can be obviously seen that the responses of the bare GCE towards the reduction of H2O2 are quite weak. On the contrary, the Cu2O nanocubes of five different sizes shows a strong response towards the reduction of H2O2. Furthermore, it can be found that the reduction peak currents of the Cu2O nanocubes of five different sizes modified electrodes increased with the size decreased of Cu2O nanocubes. Compared with other samples, the reduction peak current of the sample S-1 is relatively strong, which exhibits a remarkable catalytic current peak about 395 μA in intensity at −0.298 V. The experimental results demonstrated that the as-synthesized Cu2O nanocubes have electrocatalytic activity for the H2O2 reduction. Moreover, the order of increase reduction peak currents of these five electrodes toward H2O2 reduction is S-1 > S-2 > S-3 > S-4 > S-5, indicating that the electrocatalytic ability toward H2O2 reduction is S-1 > S-2 > S-3 > S-4 > S-5, which can be attributed to the size of Cu2O nanocubes. The smaller size can effectively increase the electrocatalytic active areas and promote electron transfer in the reduction of H2O2. As shown in Fig. 4, the isotherms for the Cu2O nanocubes and Cu2O/Nafion/GCE electrodes with five different sizes exhibit a type IV with a H3 hysteresis loop according to the IUPAC classification. The corresponding data have been shown in Table 1. As can be expected, the orders of the specific surface area are S-1 > S-2 > S-3 > S-4 > S-5 and S-1/Nafion/GCE > S-2/Nafion/GCE > S-3/Nafion/GCE > S-4/Nafion/GCE > S-5/Nafion/GCE, which corresponding to the order of electrocatalytic ability toward H2O2, namely, both of the smallest cubic Cu2O and its electrode with the largest surface area show the best electrocatalytic activity towards H2O2 reduction. This indicates that the electrocatalytic activity towards H2O2 reduction is highly dependent on the size of the Cu2O nanocubes.
 | ||
| Fig. 4 Nitrogen sorption isotherm of the Cu2O nanocubes with five different sizes (a) and the corresponding Cu2O/Nafion/GCE electrodes (b). | ||
| The Cu2O nanocubes | The surface area of each Cu2O (m2 g−1) | The surface area of each Cu2O/Nafion/GCE electrode (m2 g−1) |
|---|---|---|
| S-1 | 18.42 | 37.02 |
| S-2 | 8.33 | 30.47 |
| S-3 | 2.58 | 23.73 |
| S-4 | 2.32 | 16.27 |
| S-5 | 1.22 | 10.39 |
Fig. 5a shows I–t curves of the Cu2O nanocubes of five different sizes electrodes in 0.2 M pH 7.4 PBS for the addition of 0.5 mM H2O2. To avoid or decrease the interference of other electro-active species and minimize the background current, an applied potential of −0.2 V was used for the amperometric determination of H2O2.35 As H2O2 is added to the stirred PBS solution, well-defined steady state current responses are obtained within 2 s at the applied potential, and the current increases stepwise with successive additions of H2O2, indicating a sensitive and rapid response to H2O2 reduction with the current response of S-1 > S-2 > S-3 > S-4 > S-5. The five calibration curves as shown in Fig. 5b, the H2O2 concentration showed a terrific linear relationship with the response current on the five electrodes. The linear relation equation can be expressed as:
 | ||
| Fig. 5 (A) Typical steady-state response of the Cu2O nanocubes with five different sizes to successive injection of H2O2 into the stirred N2-saturated 0.2 M PBS at pH 7.4 (applied potential: −0.2 V), (B) the corresponding calibration curves of oxidation currents vs. H2O2 concentrations. | ||
S-1/Nafion/GCE:
| I (μA) = (19.19 ± 0.50) + (24.99 ± 0.50)C (mM), R = 0.996 |
S-2/Nafion/GCE:
| I (μA) = (13.42 ± 0.39) + (21.67 ± 0.39)C (mM), R = 0.997 |
S-3/Nafion/GCE:
| I (μA) = (11.57 ± 0.72) + (16.71 ± 0.72)C (mM), R = 0.985 |
S-4/Nafion/GCE:
| I (μA) = (6.93 ± 0.38) + (13.64 ± 0.38)C (mM), R = 0.993 |
S-5/Nafion/GCE:
| I (μA) = (5.05 ± 0.43) + (10.38 ± 0.43)C (mM), R = 0.986 |
From the linear equation, the Cu2O nanocubes of five different sizes display the linear range from 0.5 to 8.5 mM for H2O2. The limits of detection (LOD) were 1.61 μM (S/N = 3) and the sensitivities were respectively 24.99, 21.67, 16.71, 13.64 and 10.38 μA cm−2 mM−1 for H2O2 detection on the five simples. It is obviously that the LOD and sensitivities of the S-1/Nafion/GCE are correspondingly superior to other four Cu2O/Nafion/GCE non-enzymatic H2O2 sensors. The detailed comparison of our present work with other sensors regarding the performance of H2O2 assays is presented in Table 2. With a wider linear response range, a relatively lower limit of detection (1.61 μM) and fast current response for H2O2 are achieved, which are superior to those of most Cu2O and Cu2O-based nonenzymatic H2O2 sensors.34,35,39,40 Furthermore, it is worth noting that the preparation of this sensor is much cheaper and easier as compared with those of enzyme-based H2O2 sensors.41
| Sensors | Sensitivity (μA μM−1 cm−2) | Linear range (μM) | Detection limit (μM) | Ref. |
|---|---|---|---|---|
| Cu2O–rGOop | 0.0155 | 100–9800 | 79 | 39 |
| Cu2O–rGOis | 0.0195 | 100–7800 | 55.5 | 39 |
| Cu2O–rGOpa | 0.0207 | 30–12800 |
21.7 | 39 |
| Cu2O MCs | 0.0506 | 1.5–150 | 1.5 | 34 |
| The Cu2O nanowires | 0.7450 | 0.25–5000 | 0.12 | 40 |
| The rhombic dodecahedral Cu2O | 0.0440 | 50–3400 | 12.3 | 35 |
| The octahedral Cu2O | 0.0783 | 50–3500 | 6.1 | 35 |
| The extended hexapod Cu2O | 0.0944 | 50–3600 | 5.4 | 35 |
| The cubic Cu2O | 0.0136–0.0250 | 500–8500 | 1.61 | This work |
For practical applications, we also investigate the selectivity of the Cu2O nanocubes modified electrode for H2O2 detection. The influence from common interference species such as ascorbic acid (AA), uric acid (UA) and glucose (Glu) was investigated by using their relevant physiological levels. It is seen that the Cu2O/GCE shows the anti-interference advantage by comparing the amperometric responses of four relevant electroactive species (UA, AA, 1.0 mM, and glucose, 2.0 mM, respectively) and H2O2 (1.0 mM) at a working potential of −0.2 V as shown in Fig. 6. The good ability of anti-interference is largely attributed to the low working potential of −0.2 V used in the determination of H2O2. The observation indicates that the electrode could be applied to the selective determination of H2O2 in real samples. To study the reproducibility of the electrode preparation, five electrodes were prepared under the same conditions. The as-prepared Cu2O modified GCE shows good repeatability with a relative standard deviation (RSD) of 3.7% for five successive detections at 1.0 mM H2O2. Also, it exhibits an acceptable reproducibility with a RSD of 4.5% for five individual electrodes. Additionally, the current response retained 92% of its initial value after a storage period of 3 weeks, indicating the good long-term stability of as-prepared Cu2O nanocubes.
 | ||
| Fig. 6 Current–time curves for the S-1 exposed to AA, UA (1.0 mM), glucose (2 mM) and H2O2 (1 mM) each. | ||
4. Conclusions
In summary, Cu2O nanocubes with different sizes were synthesized by a facile method. The size of the Cu2O nanocubes samples increased with the increasing of sodium hydroxide concentration in the synthesis process. Their electrocatalytic properties for the detection of H2O2 which depend on the size were studied. The electrocatalysts with smallest size were found to show the highest electrocatalytic activity due to the fact that the smaller size can effectively increase the electrocatalytic active areas and promote electron transfer in the reduction of H2O2. The cyclic voltammetry and amperometry results show that these Cu2O nanocubes exhibited good electrocatalytic activity with the linear response ranging from 0.5 to 8.5 mM at −0.2 V and the detection limit of 1.61 μM (S/N = 3). In addition, Cu2O nanocubes of five different sizes have good selectivity for the H2O2 detection in the presence of AA, Glu and UA. This work highlights the importance of size control of the electrocatalysts and provides a valuable reference for synthesizing high-efficiency nonenzymatic Cu2O-based or other H2O2 sensor.Acknowledgements
This work was supported by the financial supports of National Nature Science Foundation of China (No. 21406091), Natural Science Foundation of Jiangsu Province (BK20140530), College Natural Science Research Program of Jiangsu Province (13KJB610003), the Research Innovation Program for College Graduates of Jiangsu Province (SJLX_0479) and Science and Technology Support Program of Nantong City (AA2014022).References
- R. C. Matos, J. J. Pedrotti and L. Angnes, Anal. Chim. Acta, 2001, 441, 73 CrossRef CAS.
- D. J. Barrington and A. Ghadouani, Environ. Sci. Technol., 2008, 45, 8916 CrossRef.
- Y. Lin, X. Cui and L. Li, Electrochem. Commun., 2005, 7, 166 CrossRef CAS PubMed.
- G. Shi, J. Lu, F. Xu, H. G. Zhou, L. Jin and J. Jin, Anal. Chim. Acta, 2000, 413, 131 CrossRef CAS.
- B. X. Li, Z. J. Zhang and Y. Jin, Sens. Actuators, B, 2001, 72, 115 CrossRef CAS.
- E. C. Hurdis and H. Romeyn, Anal. Chem., 1954, 26, 320 CrossRef CAS.
- K. Sunil and B. Narayana, Bull. Environ. Contam. Toxicol., 2008, 81, 422 CrossRef CAS PubMed.
- Y. Z. Li and A. Townshend, Anal. Chim. Acta, 1998, 359, 149 CrossRef CAS.
- S. Y. Xu, B. Peng and X. Z. Han, Biosens. Bioelectron., 2007, 22, 1807 CrossRef CAS PubMed.
- Q. Rui, K. K. Komori, Y. Tian, H. Q. Liu, Y. P. Luo and Y. Sakai, Anal. Chim. Acta, 2010, 670, 57 CrossRef CAS PubMed.
- S. Liu, L. M. Li, Q. Y. Hao, X. M. Yin, M. Zhang, Q. H. Li, L. B. Chen and T. H. Wang, Talanta, 2010, 81, 727 CrossRef CAS PubMed.
- A. I. López-Lorente, B. M. Simonet and M. Valcárcel, Anal. Bioanal. Chem., 2011, 339, 43 CrossRef PubMed.
- C. Batchelor-McAuley, Y. Du, G. G. Wildgoose and R. G. Compton, Sens. Actuators, B, 2008, 135, 230 CrossRef CAS PubMed.
- Y. Li, J. J. Zhang, J. Xuan, L. P. Jiang and J. J. Zhu, Electrochem. Commun., 2010, 12, 777 CrossRef CAS PubMed.
- C. Y. Lin, Y. H. Lai, A. Balamurugan, R. Vittal, C. W. Lin and K. C. Ho, Talanta, 2010, 82, 340 CrossRef CAS PubMed.
- S. Guo, D. Wen, S. Dong and E. Wang, Talanta, 2009, 77, 1510 CrossRef CAS PubMed.
- N. A. Sitnikova, A. V. Borisova, M. A. Komkova and A. A. Karyakin, Anal. Chem., 2011, 83, 2359 CrossRef CAS PubMed.
- Z. Wang, S. Sun, X. Hao, X. Ma, G. Guan, Z. Zhang and S. Liu, Sens. Actuators, B, 2012, 171, 1073 CrossRef PubMed.
- A. Noorbakhsh and A. Salimi, Electrochim. Acta, 2009, 54, 6312 CrossRef CAS PubMed.
- W. D. Zhang, J. Chen, L. C. Jiang, Y. X. Yu and J. Q. Zhang, Microchim. Acta, 2010, 168, 259 CrossRef CAS.
- A. Gu, G. Wang, X. Zhang and B. Fang, Bull. Mater. Sci., 2010, 33, 17 CrossRef CAS.
- D. L. Jiang, Y. Zhang, M. H. Huang, J. Liu, J. Wan, H. Y. Chu and M. Chen, J. Electroanal. Chem., 2014, 728, 26 CrossRef CAS PubMed.
- D. L. Jiang, Y. Zhang, H. Y. Chu, J. Liu, J. Wan and M. Chen, RSC Adv., 2014, 31, 16163 RSC.
- W. C. Huang, L. M. Lyu, Y. C. Yang and M. H. Huang, J. Am. Chem. Soc., 2012, 134, 1261 CrossRef CAS PubMed.
- H. Zhu, J. Wang and G. Xu, Cryst. Growth Des., 2008, 9, 633 Search PubMed.
- S. Deng, V. Tjoa, H. M. Fan, H. R. Tan, D. C. Sayle, M. Olivo, S. Mhaisalkar, J. Wei and C. H. Sow, J. Am. Chem. Soc., 2012, 134, 4905 CrossRef CAS PubMed.
- F. Zhang, Y. Li, Y. E. Gu, Z. Wang and C. Wang, Microchim. Acta, 2011, 173, 103 CrossRef CAS.
- L. Guan, H. Pang, J. Wang, Q. Lu, J. Yin and F. Gao, Chem. Commun., 2010, 46, 7022 RSC.
- M. Liu, R. Liu and W. Chen, Biosens. Bioelectron., 2013, 45, 206 CrossRef CAS PubMed.
- X. Wang, X. Chen, D. G. Evans and W. Yang, Sens. Actuators, B, 2011, 160, 1444 CrossRef CAS PubMed.
- B. D. Yuhas and P. Yang, J. Am. Chem. Soc., 2009, 131, 3756 CrossRef CAS PubMed.
- S. Li, Y. Zheng, G. W. Qin, Y. Ren, W. Pei and L. Zuo, Talanta, 2011, 85, 1260 CrossRef CAS PubMed.
- Z. Gao, J. Liu, J. Chang, D. Wu, J. He, K. Wang, F. Xu and K. Jiang, CrystEngComm, 2012, 14, 6639 RSC.
- L. Zhang, H. Li, Y. H. Ni, J. Li, K. M. Liao and G. C. Zhao, Electrochem. Commun., 2009, 11, 812 CrossRef CAS PubMed.
- Y. M. Zhong, Y. C. Li, S. X. Li, S. Q. Feng and Y. Y. Zhang, RSC Adv., 2014, 76, 40638 RSC.
- Y. Y. Cao, Y. Y. Xun, H. Y. Hao and G. Y. Zhang, Mater. Lett., 2014, 114, 88 CrossRef CAS PubMed.
- D. V. Goia and E. Matijević, Colloids Surf., A, 1999, 146, 139 CrossRef CAS.
- F. Meng and S. Jin, Nano Lett., 2012, 12, 234 CrossRef CAS PubMed.
- F. Xu, M. Deng, G. Li, S. Chen and L. Wang, Electrochim. Acta, 2013, 88, 59 CrossRef CAS PubMed.
- Z. Yan, J. Zhao, L. Qin, F. Mu, P. Wang and X. Feng, Microchim. Acta, 2013, 180, 145 CrossRef CAS.
- C. J. Mao, X. B. Chen, H. L. Niu, J. M. Song, S. Y. Zhang and R. J. Cui, Biosens. Bioelectron., 2012, 31, 544 CrossRef CAS PubMed.
| This journal is © The Royal Society of Chemistry 2015 |