DOI:
10.1039/C5RA14332B
(Paper)
RSC Adv., 2015,
5, 84782-84789
Memory effect in weakly-interacting Fe3O4 nanoparticles†
Received
20th July 2015
, Accepted 29th September 2015
First published on 30th September 2015
Abstract
This study addresses the issue of whether the magnetite Fe3O4 nanoparticle shows a true spin-glass like behavior or if this is an artifact of interparticle interaction. Transmission electron microscopy and X-ray diffraction pattern analysis confirms the formation of pseudospherical Fe3O4 nanoparticles with a grain size of 8(1) nm. The magnetic moment relaxation M(t) follows a stretched exponential and power law function, confirming the presence of multiple-magnetic anisotropic barriers (β = 0.51(1)) and weak-interparticle interaction (n = 0.60(4)). The observed field cooling (FC) memory effect occurs because of the presence of magnetic anisotropy arising from a broad size distribution and weak-interparticle interactions. The absence of the zero-field-cooled (ZFC) memory effect signals that the Fe3O4 nanoparticle system is not a true spin-glass system, and the observed decreasing behavior of magnetization in FC measurement is an artifact of the weak-interparticle interaction.
Introduction
The thermoremanent magnetization decay and consequently the magnetic stability of nanoparticles are characterized by the magnetic anisotropy energy barrier, which plays an important role in shaping the properties of the magnetic nanoparticles. Magnetic nanoparticles having enhanced magnetic anisotropy have recently gained attention because of their enormous potential technological applications.1,2 The anisotropy of the magnetic nanoparticle systems can be enhanced further in a number of different ways. For example, through the particle size distribution in a superparamagnetic (SPM) system,3 by an increase of the inter-particle interaction in a spin-glass (SG) system4 and because of inter-coupling between FM and AFM spins at the interface in a ferromagnetic (FM)/antiferromagnetic (AFM) core/shell system.5 Conventionally the effect of enhanced magnetic anisotropy energy barriers on the magnetic properties of nanoparticles has been studied through observing the decay of the thermoremanent spin dynamics.4 Recently, the effect of magnetic anisotropy in SG and SPM nanoparticle systems has also been studied by measuring memory and the effect of aging using field-cooled (FC) and zero-field-cooled (ZFC) protocols. Interestingly the SG system shows aging with both FC and ZFC, whereas the SPM system shows only weak FC aging. Therefore these effects are considered to be decisive in their proper identification and characterization.3,6–9 The phenomenon has been studied and observed in a number of FM and AFM systems, there are only a few reports related to ferrimagnetic systems such as CoFe2O4,10,11 GaFeO3,9 or Fe3O4.12,13 Ferrite magnetite Fe3O4 (FeO·Fe2O3) has a cubic spinel structure above the Verwey transition (TV) ∼ 120 K and has gained increased attention in recent years because of its high Curie temperature (TC) ∼ 850 K. The Fe3+ ions in Fe2O3 are located at tetrahedral sites (A) and the Fe2+ and Fe3+ ions at octahedral sites (B) in an antiparallel arrangement, yielding a ferrimagnetic order below TC. Nanomagnetite Fe3O4 has seen widespread use in electronics, magneto-optics, magneto caloric refrigeration, dynamic scaling, high-density information storage, catalysis, magnetic resonance imaging and magnetically targeted drug delivery.14 Most of these applications are based on magnetic properties and therefore influenced by several factors such as size, morphology, point defects (cation/anion vacancies), inter- and intra-particle interactions, synthesis methods, size distribution and so on.15 Comparison of the properties of the nanomaterials to their bulk counterparts show that, because of the high surface to volume ratio, significant changes are observed in the magnetic structure. Recently, Jeun et al.16 observed the SPM behavior from 4.2 to 22.5 nm Fe3O4 nanoparticles with a maximum coercivity of 10 Oe. They found that the magnetization dynamics can be described by the Néel–Brown17 model of non-interacting, unidirectional anisotropy energy. However, there have also been reports where FM and AFM materials exhibit spin-glass like behavior due to strong interparticle interaction between the nanoparticles of ferrites.13,18 In their comprehensive analysis, Suzuki et al.12 showed the existence of super spin-glass behavior from 5.2(5) nm Fe3O4 nanoparticles synthesized using chemical means. They observed the memory effect with both FC and ZFC (deep valley after ZFC aging) protocols, and confirmed the SG behavior from Fe3O4 nanoparticles. However, whether the observed SG behavior is a collective phenomenon arising from intercluster interaction or is a true spin-glass phase is a matter of question. Yang et al.13 explicitly showed that the SiO2-mediated interparticle spacing effectively modulates the collective behavior of 7.5 nm Fe3O4 particles. The bare Fe3O4 nanoparticles, which behave like SG and show both ZFC–FC memory effects due to interparticle interaction, become non-interacting after reaching an interparticle spacing of 31.5 nm, and exhibit FC memory effect only. This indicates that the memory effect is not an intrinsic property of the Fe3O4 nanostructures but indeed is induced by the interparticle interactions. It is important to note that the SG behavior can also arise because of spin frustration at the surface of individual nanoparticles. Peddis et al.11 reported SG-like freezing and an ZFC aging effect from 3 nm size non-interacting CoFe2O4 ferrimagnetic particles. Unlike the deep valleys (commonly observed in dense SG-like nanoparticle systems), they observed a linear increasing behavior below the ZFC aging temperature. This observed phenomenon can be attributed to random freezing of the surface SG. Furthermore, Wang et al.19 reported observations of the conventional exchange bias phenomenon from compacted magnetic core/shell Fe3O4 nanoparticles having a low temperature SG-like surface and ferrimagnetic core. The synthesis method, particle size, their morphology, and interparticle interactions may together or even individually influence the magnetic and structural properties at the nanoscale and therefore a comprehensive analysis is required to obtain a detailed understanding of the effect of finite size on the magnetic properties of ferrimagnetic materials at the nanoscale. In this study, we present a detailed structural and magnetic characterization of 8(1) nm size, chemically synthesized, pseudo-spherical Fe3O4 nanoparticles. The aim is to study the effect of interparticle interaction and random freezing of spins on the memory effect within the blocked state.
Experimental work
Magnetic iron oxide (Fe3O4) nanoparticles were prepared using a previously reported method20 with minor modifications. First, 100 mL of deionized water was placed in a round bottomed flask. Subsequently, the water was deoxygenated by bubbling N2 gas for 30 min. Later, 25 mL of ammonium hydroxide (1 M) was added and the mixture was stirred for 10 minutes at 1000 rpm using mechanical agitation. Afterwards, 5 mL of ferrous chloride 0.0125 M and 10 mL of ferric chloride 0.0125 M were added. Immediately a black precipitate appeared and separated. A decantation process was applied with the aid of a magnetic field. Finally the product was washed four times with 25 mL of deionized and deoxygenated water and then dried. The synthesized nanoparticles were examined by transmission electron microscopy (TEM, JEM-2000-FX JEOL, Japan) to determine size and morphological analysis. Analysis of the crystalline properties was carried out by X-ray diffraction (XRD) at the National Synchrotron Radiation Research Center in Hinchey, Taiwan (λ = 0.7749 Å) using high energy synchrotron radiation XRD with a BL01C2 beam line. The magnetic properties of the nanoparticles were measured with a superconducting quantum interference device (Quantum Design, MPMS-SQUID-VSM) magnetometer using a maximum applied magnetic field of 15 kOe over a temperature range of 2 to 400 K.
Results and discussion
Structural analysis
It is clearly evident that the nanoparticles of Fe3O4 are well separated and pseudo-spherical in shape; see the TEM image in Fig. 1(a). The interconnecting nanoparticles are stuck together in clusters due to the electrostatic effects and as an artifact of the drying of the aqueous suspension. Fig. 1(b) shows the mean size and a histogram of the distribution of the nanoparticles scaled from 3 to 22 nm, calculated from a portion of the TEM image. The distribution of the diameters is quite asymmetric and can be described using a log-normal distribution function. The solid line in Fig. 1(b) represents the fit, assuming a log-normal distribution function,
where 〈d〉 is the mean diameter and σ is the standard deviation of the function. The mean diameter and standard deviation obtained from the fit are 〈d〉 = 8(1) nm and σ = 0.35(2), respectively.21 The distribution of nanoparticle size can significantly affect the magnetic properties of the Fe3O4 nanoparticles.15 Thakur et al.22 also reported a broad size distribution of 0.58 for Fe3O4 nanoparticles with a crystalline size of ∼10 nm synthesized by precipitating ferrous ions. Their results showed a broad ZFC magnetization curve and exhibited SG behavior. In contrast, Jeun et al.16 reported a narrow size distribution for ∼10 nm size Fe3O4 nanoparticles synthesized using a high temperature thermal decomposition (HTTD) and a seed-mediated growth method, which exhibited an SPM behavior. Either the size distribution or the synthesis method, sometimes both play an important role in defining the magnetic properties of the nanoparticles.
 |
| Fig. 1 (a) TEM image of Fe3O4 nanoparticles showing the pseudospeherical morphology; (b) plot of distribution of the mean diameter of nanoparticles obtained from the TEM image. The solid line represents the fitting curve, assuming a log-normal distribution function. The fitted parameters are depicted in the figure; (c) the observed (black crosses) and Rietveld-refined (red solid line) X-ray diffraction pattern of Fe3O4 nanoparticles. | |
The synchrotron radiation X-ray diffraction (SR-XRD) technique is employed for detailed investigation of the different crystalline phases and strain in nanoscale samples, which would otherwise be quite difficult to investigate using the usual XRD techniques. The observed crystalline phases for Fe3O4 nanoparticles obtained from the XRD spectra are depicted in Fig. 1(c). The XRD pattern clearly shows formation of an Fe3O4 phase without any trace of impurity. A significantly broader nuclear peak which is visible to the naked eye in the XRD spectra is in good agreement with the observed nanometric nature of the sample obtained from the TEM analysis.23 The observed broadening of the peak is a short-range behavior that can be described by the Gaussian instrument resolution function.24 The value of the full width at half maximum (fwhm) of the most intense nuclear peak [311], indexed based on the space group of Fd
m (no. 227) is 0.413 ± 0.004° with a grain size of ∼10.1 nm (calculated by using the Scherer formula25). The observed value of the grain size signals the development of short-range crystallinity, which could be either due to the finite size effect or the combined effect of size and strain.26 The value of the crystalline size of nanoparticles and the strain effect can be further estimated by using the well-known Williamson–Hall method:27
where
β is the fwhm of the XRD peak,
k is the Scherer constant (=0.94) for the nanoparticles,
λ is the incident X-ray wavelength,
θ is the diffraction angle and
η is the local lattice distortion parameter (strain). The intercept of the linear fit gives the inverse of the crystalline size 11(1) nm and the slope of the curve gives a local lattice distortion of
η = 0.00134(68), which is in excellent agreement with the grain size estimated from the XRD spectra and larger than the TEM result due to the interconnecting effect of nanoparticles. The estimated value of the lattice distortion is higher than the strain limit of ∼0.01 and therefore the observed broadening in the fwhm is purely a finite size effect. Jafari
et al.28 also reported similar value for the strain, ∼0.0018, from 11.4 nm Fe
3O
4 nanoparticles synthesized by the co-precipitation method, followed by annealing at 450 °C. The XRD pattern of the Fe
3O
4 nanoparticles is further refined using Rietveld analysis.
29 The diffraction pattern (black crosses) is shown. The solid curve (red curve) indicates the fitted pattern. The difference (blue curve) between the observed and the fitted pattern is plotted at the bottom of
Fig. 1(c). The obtained refined lattice parameters confirm formation of spinel cubic Fe
3O
4 with the space group
Fd
m (no. 225). The fitted value of
a =
b =
c = 8.3571(3) Å shows lattice contraction compared to the reported bulk value of 8.396 Å (JCPDS 19-629). Similar lattice contraction has been reported for Fe
3O
4 nanoparticles which increases further with a decrease of particle size.
28 However, there have also been reports in which no considerable change in lattice parameter was observed even after reducing the size down to 4 nm.
30 The anomaly in the lattice parameter at the nanoscale indicates that besides the finite size effect, there are several other factors that play an important role in defining structural properties, such as point defects (cation/anion vacancies) and preparation methods. Similar lattice contraction with a decrease of particle size has also been reported from spinel cubic Co
3O
4 nanoparticles due to variation of the charge state.
31 The ionic radius of Co
2+ ions (70 pm) is larger than that of Co
3+ ions (60 pm) so the effect of calcination results in the substitution of Co
3+ ions by Co
2+ in Co
3O
4. A similar argument can be applied to observed lattice contraction in Fe
3O
4 nanoparticles because the atomic radius of Fe
3+ ions (64 pm) is smaller than that of Fe
2+ ions (74 pm). The substitution of Fe
2+ ions with Fe
3+ or the existence of vacancies at Fe
2+ ion sites can result in lattice contraction in Fe
3O
4 nanoparticles.
Temperature dependent magnetization measurement
Fig. 2(a) shows the ZFC–FC magnetization curve of Fe3O4 nanoparticles measured in the 100 Oe field. In the FC mode, the magnetization initially increases, then levels off and afterwards decreases slightly, whereas the ZFC magnetization shows a broad maximum at 324 K followed by a steady decrease to a value approaching zero in the low temperature region. The variation of the magnetization in the FC modes indicates an SG-like behavior, similar to that reported for several different interacting magnetic systems.3 The observed broad maximum of the ZFC curve can be ascribed to a broad size distribution as observed from TEM analysis.32 Each particle gets blocked at a blocking temperature TB then is poly-dispersed and a wide nanoparticle distribution range, TB = 324 K, will be associated with the mean value of TB. As also reported by Jeun et al.,16 it is assumed that the Fe3O4 nanoparticles behave like SPM. According to the Néel–Brown model the uniaxial and non-interacting SPM nanoparticles exhibit a distribution in the anisotropy energy barrier due to poly-dispersity. In this case the blocking temperature can be defined as TB ≈ KV/22kB, where K is the magnetocrystalline anisotropy energy density. And τm = τo
exp(KV/kBTB), where τm = 4 s is the experimental measurement time, and το ∼ 10−9 s is the attempt time. Using TB = 324 K (maximum from a ZFC curve in Fig. 2(a)), the above equation yields K = 1.88 × 10⁵ J m−3 for ∼10 nm Fe3O4 particles. The value is about one order of magnitude higher than that of the bulk Fe3O4 (K = 0.135 × 10⁵ J m−3). The observed enhancement can be associated with the surface effect, an intrinsic particle anisotropy (such as stress), or interparticle interactions. However, according to Goya et al.,32 the contribution of surface anisotropy for pseudospherical nanoparticles should average out to zero. The observed stress in the W–H plot is negligible. However, in our sample, the observed value of TB = 324 K at the 100 Oe field is larger compared to the value of TB = 117 K obtained from non-interacting ∼10 nm size Fe3O4 particles,16 which agrees with the presence of interparticle interaction. Additionally, the calculated value of K is in good agreement with the reported value of K = 1.11 × 10⁵ J m−3 for 11.6 nm size oleate-capped interacting Fe3O4 particles having a value of TB = 264 K measured under a magnetic field of 100 Oe.14 Therefore, the above discussion and the observed decreasing behavior of the FC magnetization curve with temperature below TB confirm the existence of interparticle interaction in Fe3O4 particles. However, whether the system behaves like SG or is this is an artifact of interparticle interactions will be discussed further in the text. Above TB, superparamagnetic signals dominate at higher temperature, where the magnetization decreases linearly with increasing temperature. No noticeable differences in the magnetization curves were found between the measurements made with a field-increasing loop and a field-decreasing loop. This is because the thermal excitation overcomes an energy barrier, giving rise to superparamagnetic or paramagnetic properties. Fig. 2(b) shows the hysteresis loops M(H) for Fe3O4 nanoparticles with a mean diameter 8(1) nm taken at T = 400 K (zero field cooling process). They exhibit a saturated magnetization value of 55.1(1) emu g−1 under applied magnet field Ha = 15 kOe. There are no significant differences in the magnetization measurements between the field increasing and the field-decreasing loops found above the blocking temperature, which is consistent with the superparamagnetic behavior.16 It can be seen that the influence of temperature on the saturation magnetization originates from the superparamagnetic characteristics in the Fe3O4 nanoparticles. Interestingly, it can be seen that the saturation magnetization is not coincident at higher field of first quadrant for the hysteresis loop. This phenomenon can be interpreted as an exchange inter-coupling effect caused by enhanced anisotropy at higher field, which has been observed and explained in our previous work.33 It is worth noting that the presence of clear bifurcation between the ZFC and FC curves is visible above the blocking temperature TB with the curves beginning to merge at an irreversible temperature Tirr. The irreversibility shown in Fig. 2(a) is strongly dependent on the magnitude of the applied magnetic field and is presumably associated with a slow relaxation process for an assembly of weak interacting nanoparticles, as discussed in a previous report.34 These characteristics can be attributed to a dipole–dipole interaction. In a magnetic mono-dispersed system as reported by Si et al,35 the dipole–dipole interaction between nanoparticles can be ignored in comparison with the anisotropy energy, but could be of the same order as the particle anisotropy energy in a dense system. At larger particle size, the strength of the dipole interaction starts to increase slowly. This is due to an increase in the magnetic moment per particle, which enhances the magnetic attraction between the particles, although the magnetic attraction is still smaller than the dipole interaction in the region of dense systems, which is called a weak interaction. Their findings confirmed that the value of TB from Fe3O4 nanoparticles is not just governed by the size and distribution of the particles, but also by their nature.
 |
| Fig. 2 (a) ZFC–FC magnetization curve of Fe3O4 nanoparticles measured in a field of Ha = 100 Oe. (b) Hysteresis loop of Fe3O4 nanoparticles taken at 400 K. | |
Relaxation dynamics
Time dependency of the magnetization relaxation M(t) was measured at 30 K and 100 K (in the blocked state) for a time period of 3600 s. The M(t) measurement was carried out by first cooling the system to the desired temperature under a small magnetic field of 100 Oe. Once the temperature stabilized, the magnetic field was switched off in oscillator mode at a rate of 10 Oe s−1 and subsequent relaxation of the magnetic moment with respect to time was recorded. Fig. 3(a) depicts the observed time dependency of magnetization relaxation at 30 and 60 K. The solid line represents the fit to the relaxation dynamics using a stretched exponential function36
M(t) = Mo − Me exp(−(t/τ)β) |
where Mo, is an intrinsic magnetic component, and Me and τ are the glassy component and characteristic relaxation time, respectively, both of which depend on the measuring temperature and time. β is a stretching parameter (0 < β ≤ 1) and is a function of the measuring temperature only. In the above expression, if β = 1, then the system relaxes with a single time constant. Therefore the mechanism involves activation against a single anisotropy barrier, otherwise, for β < 1 it involves activation against multiple anisotropy barriers. Possible causes for occurrence of multiple anisotropy barriers could be the size distribution, interparticle interaction, shape anisotropy or magnetocrystalline anisotropy. There is a satisfactory linear fit. Fig. 3(a) shows a plot of ln[M(t) − Mo] versus tβ and the fitting parameters. Values of β = 0.51(1) and 0.58(1) are obtained from fit for the 30 and 100 K M(t) curves, respectively, which points towards activation against multiple anisotropy barriers. Here, the existence of multiple anisotropy barriers possibly bears a correlation to the signature of the distribution of the particle size and presence of interparticle interactions. Interestingly, the values of τ and β increase with the measuring temperature, manifesting softening of the spin relaxation due to increase of the thermal energy.
 |
| Fig. 3 (a) Stretched-exponential and (b) power-law fit to the time dependent magnetization decay curve of Fe3O4 nanoparticles measured at 30 and 100 K, respectively. The fitting parameters are depicted in the figure. | |
For a better understanding of the time dependent relaxation dynamics of the system involving interparticle interaction or spin-glass like behavior, the M(t) dynamics are analyzed using the theoretical model proposed by Ulrich et al.4 The model is based on a Monte Carlo simulation, where dipolar interactions are only taken into account to interpret the slow relaxation process of FM nanoparticles,4 spin-glass like La0.9Sr0.1CoO3,36 AFM NiO37 and Fe50Ni50 nanoalloys.38 Ulrich explicitly showed that the decay of M(t) follows a power law after the lapse of a crossover time, to: W(t) = t−n, where W(t) is defined as −(d/dt)ln
M(t). In the above expression, the value of n is a function of the measuring temperature, field and particle density, which is ≥1 for dense and 2/3 for weakly interacting, diluted systems having a distribution in particle size. A plot of ln
W(t) versus ln
t is shown in Fig. 3(b). The straight line fit is displayed after a crossover time of to = 100 s. The fitting parameters are depicted in the figure. The fitted value of n = 0.60(4) for the 30 K M(t) curve is close to the value of 2/3 indicating the presence of interparticle interaction. M(t) is measured at 100 K. The magnetic moment relaxes and the value of n decreases to 0.48(1) with an increase in the thermal energy. The important outcome of the above analysis is the fitted value of n, which decreases as the temperature approaches TB. On the other hand, the value of n in manganite39 increases from 1.01 to 1.5 with an increase of temperature, whereas for a cobaltite it remains constant at ∼0.83.36 Khan et al.36 found that cobaltite exhibits a glassy behavior resembling that of a true spin-glass phase, whereas the glassy behavior of the manganite39 mirrors the collective behavior originating from the strong inter-cluster interactions only. Therefore, according to the above findings and as pointed out by Yang et al.13 the glassy behavior of the Fe3O4 originates from the interparticle interaction and varies with the compactness, that is with the strength of the interparticle interaction. The value of n is a measure of the particle interaction indicating the presence of a weak-interparticle interaction in 8(1) nm size Fe3O4 particles. The observed results are in good agreement with the observed well-separated behavior of nanoparticles in the TEM analysis.
Memory effect
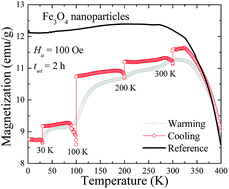
The memory effect on the thermal variation of magnetization using the FC protocol in the Ha = 100 Oe field is investigated in Fe3O4 particles. The observed results are depicted in Fig. 4. First, magnetization was measured in cooling mode from 400 K down to 2 K at a cooling rate of 2 K min−1. During this cooling process, the temperature of the sample was “held” at 300, 200, 100, and 30 K for a time period of 2 h each. During this time, the magnetic field was switched off in oscillatory mode at a rate of 10 Oe s−1 to allow the magnetic moments to relax to a zero field. After completion of each of the 2 h halts the magnetic field was turned on and measurement was subsequently resumed at the same cooling rate down to 2 K. The curve, designated as the cooling curve, is shown in the figure. Following this, the second cycle of measurement was started in heating mode at a rate of 2 K min−1, continuously heating the sample from 2 K to 400 K; this curve is designated as the warming (memory) curve in the figure. For comparison, the FC (reference) curve, denoted as the reference FC cooling curve, is also displayed. We note discernable evidence of steps in the warming (memory) curve around T, although measurements were carried out continuously without pause. The observed step-like behavior indicates that the spin configuration imprinted at each temperature halt is retrieved by the curve while warming. These steps are the signature of the memory effect and can be used as a good measure for determining whether the system is SPM or SG.3 The unique part of the steps is the decrease in magnetization of the FC curve with temperature as compared with the reference curve. Such behavior is commonly assigned to interacting SG like systems. In contrast, a noninteracting SPM system shows increasing magnetization behavior with a decrease of temperature.3 However, it is hard to conclude that the Fe3O4 nanoparticles behave like SG from the decreasing behavior of magnetization alone. A non-SG system having interparticle interaction can also show similar behavior, which will be discussed later in the text. Furthermore, during FC cooling there is also an abrupt relaxation of the magnetic moment at 100 K in comparison to the other temperature pauses. This observed behavior could be due to the Verwey transition (TV) as reported at ∼120 K from bulk Fe3O4 where the magnetic easy axis switches from the 〈111〉 to 〈100〉 direction. Recently Mitra et al.30 reported the observation of kinks around ∼120 K after ZFC–FC measurements of amine coated octahedral Fe3O4 nanoparticles (6 to 14 nm) which they assigned to TV. Interestingly, similar size nanoparticles, synthesized under similar conditions, but having a spherical morphology do not show any TV in the ZFC–FC measurement. The observed anomaly was assigned to high stoichiometric defects in the spherical nanoparticles as compared to that of octahedral nanoparticles. This indicates that the 8(1) nm Fe3O4 nanoparticles may have vacancies at the Fe2+ sites (Fe2+ has higher atomic radii than Fe3+) resulting in lattice contraction, as observed from analysis of the XRD spectra. However, it has also been reported that this is due to the finite size effect TV of spherical nanoparticles shifting to a lower temperature with a decrease of particle size. In addition, the lattice contraction and stoichiometric defects will lead to a shift in the hysteresis loop known as the spontaneous exchange bias (SEB) phenomenon. The uncompensated and randomly oriented surface spins behave like short-range clusters of spins (weak FM) in which case they can easily be magnetized while cooling in a zero magnetic field. Saha et al.40 first explained the zero-field or spontaneous EB effect by using a micromagnetic simulation in a bilayer system with a polycrystalline AFM. The term spontaneous refers to the case in which the system is not conventionally field cooled. A small SEB field HSEB = −5 Oe was obtained from the M(Ha) loop taken at 2 K, as shown in Fig. S1 (see ESI†). The observed SEB effect is attributed to the weak coupling of nanoparticle and the short-range surface spins, which behave like weak FM.
 |
| Fig. 4 The FC memory effect measured in the Ha = 100 Oe field with a halt of 2 h at each temperature (30, 100, 200 and 300 K). Black solid line curve representing the reference curve measured in the 100 Oe field. In the inset is the observed result after measuring the memory effect using the ZFC protocol. | |
To gain further insight into the influence of the interparticle interaction on the collective magnetic properties of Fe3O4 particles, the memory effect was also measured with the ZFC protocol. It is known from the literature that the ZFC memory effect can only be observed from interacting or spin-glass-like systems and not in a non-interacting particle system.3 However, from careful repeated experiments, we note that the memory effect is absent in the thermal variation ZFC magnetization curve recorded when the sample was cooled down to 2 K from 200 K without the application of a field. This is displayed in the thermal variation of the difference plot (δM) between the ZFC (memory) and ZFC (reference), as seen in the inset to Fig. 4. During the ZFC process, the sample temperature stabilized at 100 K, as shown in the ZFC magnetization plot, which is clearly highlighted in the difference plot, i.e., no memory is imprinted by aging in the zero field for the 4 h time period. The absence of memory in ZFC mode indicates that either the system is SPM or the interparticle interaction is too weak to retain the ZFC memory effect. The former argument can be avoided as we observed a coercivity of ∼205 Oe after measuring the hysteresis loop at 2 K (data not shown). The latter argument is in good agreement with the dynamic time relaxation behavior of Fe3O4 particles, hinting that the absence of a ZFC memory effect is because of the weak interaction within the particles. In an SG, the length of the spin–spin correlation grows during the stop, even in zero fields, and a memory dip typically shows up upon reheating. This is not possible in a non/weak-interacting nanoparticle system which does not show the memory deep in the ZFC mode. In non/weak-interacting nanoparticle systems, the distribution of relaxation times originates only from that of the individual particle volumes and is thus an extrinsic effect. On the other hand, it is the consequence of the cooperative phenomenon of spins and is thus intrinsic and dependent on the age of the system.
Conclusion
Pure magnetite Fe3O4 nanoparticles were successfully synthesized by chemical means using the colloidal method at room temperature. The TEM analysis showed the formation of pseudo-spherical nanoparticles having a mean diameter of 〈d〉 = 8(1) nm and wide range distribution σ = 0.35(2). Analysis of the XRD spectra showed that the nanoparticles were formed of a pure spinel cubic Fe3O4 phase with 8.3571(3) Å. The observed slight lattice contraction could be due to Fe2+ vacancies or the finite size effect. The broad maxima observed at TB = 324 K in the zero-field-cooled (ZFC) magnetic measurements can be attributed to the size distribution as observed from the TEM analysis. The FC magnetization measured with- and without-aging (memory effect) showed decreasing behavior of magnetization below TB similar to that of the spin-glass-like behavior. However, the absence of the ZFC memory effect confirms that the observed spin-glass-like behavior is not the true phenomenon, but is an artifact of interparticle interaction. The presence of multi-magnetic anisotropy barriers (β = 0.51(1)) and interparticle interaction (n = 0.60(4)) was confirmed by fitting time relaxation dynamics using the stretched-exponential and power-law function, respectively. The cause of the multi-magnetic anisotropy could be the wide size distribution or the interparticle interaction. We conclude that the decreasing behavior of the magnetization during FC measurement with and without aging was not truly due to the spin-glass-like behavior, but arose from weak-interparticle interactions.
Acknowledgements
We would like to thank the Ministry of Science and Technology (MOST) of the Republic of China for their financial support of this research through project numbers MOST-103-2112-M-259-005 and MOST-104-2112-M-259-001.
References
- F. Borgonovi and G. L. Celardo, J. Phys.: Condens. Matter, 2013, 25(10), 106006 CrossRef CAS PubMed
. - A. Tamion, C. Raufast, M. Hillenkamp, E. Bonet, J. Jouanguy, B. Canut, E. Bernstein, O. Boisron, W. Wernsdorfer and V. Dupuis, Phys. Rev. B: Condens. Matter Mater. Phys., 2010, 81(14), 144403 CrossRef
. - M. Sasaki, P. E. Jönsson, H. Takayama and H. Mamiya, Phys. Rev. B: Condens. Matter Mater. Phys., 2005, 71(10), 104405 CrossRef
. - M. Ulrich, J. García-Otero, J. Rivas and A. Bunde, Phys. Rev. B: Condens. Matter Mater. Phys., 2003, 67(2), 024416 CrossRef
. - M. Vasilakaki, K. N. Trohidou, D. Peddis, D. Fiorani, R. Mathieu, M. Hudl, P. Nordblad, C. Binns and S. Baker, Phys. Rev. B: Condens. Matter Mater. Phys., 2013, 88(14), 140402 CrossRef
. - T. Jonsson, J. Mattsson, C. Djurberg, F. A. Khan, P. Nordblad and P. Svedlindh, Phys. Rev. Lett., 1995, 75(22), 4138–4141 CrossRef CAS
. - B. Vijay and K. P. Rajeev, J. Phys.: Condens. Matter, 2010, 22(1), 016003 CrossRef PubMed
. - K. Jonason, E. Vincent, J. Hammann, J. P. Bouchaud and P. Nordblad, Phys. Rev. Lett., 1998, 81(15), 3243–3246 CrossRef CAS
. - V. Singh, S. Mukherjee, C. Mitra, A. Garg and R. Gupta, J. Magn. Magn. Mater., 2015, 375, 49–53 CrossRef CAS PubMed
. - K. N. Trohidou, M. Vasilakaki, D. Peddis and D. Fiorani, IEEE Trans. Magn., 2012, 48(4), 1305–1308 CrossRef CAS
. - D. Peddis, C. Cannas, G. Piccaluga, E. Agostinelli and D. Fiorani, Nanotechnology, 2010, 21(12), 125705 CrossRef CAS PubMed
. - M. Suzuki, S. I. Fullem, I. S. Suzuki, L. Wang and C.-J. Zhong, Phys. Rev. B: Condens. Matter Mater. Phys., 2009, 79(2), 024418 CrossRef
. - H. T. Yang, D. Hasegawa, M. Takahashi and T. Ogawa, Appl. Phys. Lett., 2009, 94(1), 013103 CrossRef PubMed
. - C. Daniela, C. Gabriel and J. O. C. Charles, J. Phys. D: Appl. Phys., 2007, 40(19), 5801 CrossRef
. - K. L. Pisane, E. C. Despeaux and M. S. Seehra, J. Magn. Magn. Mater., 2015, 384, 148–154 CrossRef CAS PubMed
. - M. Jeun, S. Lee, K. J. Kang, A. Tomitaka, K. Wook Kang, Y. Kim, Y. Takemura, K.-W. Chung, J. Kwak and S. Bae, Appl. Phys. Lett., 2012, 100(9), 092406 CrossRef PubMed
. - W. Brown, Phys. Rev., 1963, 130(5), 1677–1686 CrossRef
. - B. Aslibeiki, P. Kameli, I. Manouchehri and H. Salamati, Strongly interacting superspins in Fe3O4 nanoparticles, Curr. Appl. Phys., 2012, 12(3), 812–816 CrossRef PubMed
. - W. Wang, T. Zhu, K. Zhao, W. N. Wang, C. S. Wang, Y. J. Wang and W. S. Zhan, Phys. Rev. B: Condens. Matter Mater. Phys., 2004, 70(9), 092409 CrossRef
. - I. Martínez-Mera, M. E. Espinosa-Pesqueira, R. Pérez-Hernández and J. Arenas-Alatorre, Mater. Lett., 2007, 61(23–24), 4447–4451 CrossRef PubMed
. - A. C. Gandhi, J. Pant, S. D. Pandit, S. K. Dalimbkar, T.-S. Chan, C.-L. Cheng, Y.-R. Ma and S. Y. Wu, J. Phys. Chem. C, 2013, 117(36), 18666–18674 CAS
. - M. Thakur, M. P. Chowdhury, S. Majumdar and S. Giri, Nanotechnology, 2008, 19(4), 045706 CrossRef CAS PubMed
. - M. Casas-Cabanas, G. Binotto, D. Larcher, A. Lecup, V. Giordani and J. M. Tarascon, Chem. Mater., 2009, 21(9), 1939–1947 CrossRef CAS
. - S. Y. Wu, J.-Y. Ji, M. H. Chou, W.-H. Li and G. C. Chi, Appl. Phys. Lett., 2008, 92(16), 161901 CrossRef PubMed
. - A. L. Patterson, Phys. Rev., 1939, 56(10), 978–982 CrossRef CAS
. - Y. Prabhu, K. Rao, V. Kumar and B. Kumari, World J. Nano Sci. Eng., 2014, 4(1), 8 Search PubMed
. - K. Venkateswara Rao and C. S. Sunandana, Solid State Commun., 2008, 148(1–2), 32–37 CrossRef PubMed
. - A. Jafari, S. Farjami Shayesteh, M. Salouti and K. Boustani, Indian J. Phys., 2014, 1–10 CAS
. - H. Rietveld, J. Appl. Crystallogr., 1969, 2(2), 65–71 CrossRef CAS
. - A. Mitra, J. Mohapatra, S. S. Meena, C. V. Tomy and M. Aslam, J. Phys. Chem. C, 2014, 118(33), 19356–19362 CAS
. - L. Lv, Y. Su, X. Liu, H. Zheng and X. Wang, J. Alloys Compd., 2013, 553, 163–166 CrossRef CAS PubMed
. - G. F. Goya, T. S. Berquó, F. C. Fonseca and M. P. Morales, J. Appl. Phys., 2003, 94(5), 3520–3528 CrossRef CAS PubMed
. - S. Y. Wu, J.-Y. Ji, P.-H. Shih, A. C. Gandhi and T.-S. Chan, J. Appl. Phys., 2014, 116, 193906 CrossRef PubMed
. - V. Salgueiriño-Maceira, M. A. Correa-Duarte, M. Bañobre-López, M. Grzelczak, M. Farle, L. M. Liz-Marzán and J. Rivas, Adv. Funct. Mater., 2008, 18, 616–621 CrossRef PubMed
. - S. Si, C. Li, X. Wang, D. Yu, Q. Peng and Y. Li, Cryst. Growth Des., 2005, 5(2), 391–393 CAS
. - N. Khan, P. Mandal and D. Prabhakaran, Phys. Rev. B: Condens. Matter Mater. Phys., 2014, 90(2), 024421 CrossRef
. - S. K. Mishra, Eur. Phys. J. B, 2010, 78(1), 65–73 CrossRef CAS
. - D. de, A. Karmakar, M. K. Bhunia, A. Bhaumik, S. Majumdar and S. Giri, J. Appl. Phys., 2012, 111(3), 033919 CrossRef PubMed
. - F. Rivadulla, M. A. López-Quintela and J. Rivas, Phys. Rev. Lett., 2004, 93(16), 167206 CrossRef CAS
. - J. Saha and R. H. Victora, Phys. Rev. B: Condens. Matter Mater. Phys., 2007, 76(10), 100405 CrossRef
.
Footnote |
† Electronic supplementary information (ESI) available. See DOI: 10.1039/c5ra14332b |
|
This journal is © The Royal Society of Chemistry 2015 |
Click here to see how this site uses Cookies. View our privacy policy here.