Enhanced photocatalytic degradation of methylene blue and adsorption of arsenic(III) by reduced graphene oxide (rGO)–metal oxide (TiO2/Fe3O4) based nanocomposites†
Poonam Benjwala,
Manish Kumarb,
Pankaj Chamolia and
Kamal K. Kar*ab
aAdvanced Nanoengineering Materials Laboratory, Materials Science Programme, Indian Institute of Technology Kanpur, Kanpur-208016, India. E-mail: kamalkk@iitk.ac.in; Fax: +91-512-2597408
bAdvanced Nanoengineering Materials Laboratory, Department of Mechanical Engineering, Indian Institute of Technology Kanpur, Kanpur-208016, India
First published on 24th August 2015
Abstract
Reduced graphene oxide (rGO) and metal oxide based binary (rGO–TiO2/rGO–Fe3O4) and ternary (rGO–Fe3O4–TiO2) nanocomposites with enhanced photocatalytic and adsorption properties are successfully synthesized by a simple one-step solvothermal process. The microscopy images of the nanocomposites show that the ferric oxide (Fe3O4) and titania (TiO2) nanoparticles are firmly anchored over rGO, which enhances the surface area of the resultant nanocomposites. The as-synthesized nanocomposites are evaluated for the removal of methylene blue dye under UV and visible light irradiation as well as for the adsorption of As(III) from aqueous solution. Compared to binary, the ternary (rGO–Fe3O4–TiO2) nanocomposite exhibits the highest dye degradation efficiency (∼100% within 5 minutes). This enhancement is attributed to the synergetic interaction and increase in the surface area of rGO–Fe3O4–TiO2. For As(III) adsorption, the adsorption data are obtained by Langmuir and Freundlich adsorption isotherms. Compared to binary nanocomposites, the maximum monolayer adsorption capacity (147.05 mg g−1) is observed for rGO–Fe3O4–TiO2. These results reveal that the rGO–Fe3O4–TiO2 nanocomposite has potential application in water/wastewater treatment.
1. Introduction
The rapid development of industries has introduced many serious problems to ecosystems and aquatic atmospheres, leading to the deterioration of the environment and health of human beings. Industrial discharged water contains many harmful contaminants such as heavy metals and dyes, which are considered very carcinogenic to human health. Thus, several methods like chemical precipitation, coagulation, membrane filtration, ion exchange, adsorption, photocatalysis, etc. have been developed for the removal of contaminations from industrial wastewater.1–4 Among them, adsorption and photocatalysis based remediation process are widely accepted due to their low cost and ease of processing. Recently, graphene, a 2-D honeycomb structure of single layer sp2-bonded carbon atoms, has been extensively investigated for wastewater purification treatment mainly due to its large surface area, high charge carrier mobility, high adsorption capacity and excellent electron transfer rate, which makes it preferable for supporting metal oxides towards the several environmental remediation.5–8 However, the water insoluble properties of graphene limit its wide use in water purification.9 In addition, the π–π interaction between the adjacent sheets of graphene leads to the loss of effective surface area and adsorption capabilities. Graphene oxide (GO), the oxidized derivative of graphene, contains various functional groups such as carboxyl, hydroxyl and epoxide on its surface, which makes it highly hydrophilic and water soluble and thus making it applicable for supporting metal/metal oxides particles.10 Therefore, the incorporation of metal oxides on GO has become a proficient way to prepare the environment friendly composite, where the metal oxide improves its properties by utilizing the advantage of graphene.7,11,12 However, the direct separation of GO from a well dispersed solution through centrifugation or filtration is a tedious process as GO gets easily aggregate, which can reduce the adsorption efficiency.13 Thus to improve the adsorption efficiency of GO the incorporation of the magnetic adsorbents on graphene-based materials has received much attention as after purification process, magnetic adsorbents incorporated graphene/GO materials can be easily separated from the suspension using magnetic field.14 Compared to other magnetic adsorbents, Fe3O4 is the most noticeable metal oxide due to its highly reactive surface and large surface area, cost efficiency and less-toxicity.15 The incorporation of Fe3O4 nanoparticles on GO prevents the aggregation and reassembling of graphene sheets, which results larger surface area of hybrid nanostructure.16 Moreover, Fe3O4 nanoparticles particularly possess high adsorption affinity towards hazardous water pollutants and also facilitate a convenient magnetic separation for recycle/removal of nanocomposite with the application of external magnet by owing inherently super magnetic property.17 Furthermore, for the removal of toxic organic impurities from water TiO2, a wide band gap semiconductor, is widely used due to its high photo catalytic and antibacterial activity, low-cost, chemical stability, and non-toxicity.18 However, the high recombination rate of electron–hole pairs limits TiO2 efficiency as an efficient photocatalyzer. It has been observed that TiO2 nanocrystalline growth on graphene sheet promotes transfer of electrons from the conduction band of TiO2 to graphene sheet via percolation mechanism.19 In this case, electron transfer leads to the formation of heterojunction at the interface, which suppress the recombination of photo induced electron–hole pairs and thus enhances the photocatalytic performance of TiO2–graphene composites. These TiO2–graphene composites have been used in many applications such as photocatalysis, solar cells, and hydrogen evolution.20–22In the present study, we report a ternary nanocomposite, reduced graphene oxide–ferric oxide–titania (rGO–FeO4–TiO2), synthesized by simple wet assembling method for the removal of toxic methylene blue (MB) dye and As(III) from wastewater. During in situ synthesis of GO/metal oxide nanocomposites, GO is reduced into the rGO. The rGO–FeO4–TiO2 nanocomposite consists the unique properties of each constituent such as, TiO2 nanoparticles degrades the organic pollutant, rGO provides an effective pathway to increase the surface area as well as suppress the recombination of charge carriers in TiO2, and Fe3O4, being a magnetic material, increases the adsorption capabilities of rGO towards the heavy metal impurities and also helps in magnetic separation. To compare the properties of rGO–Fe3O4–TiO2, the binary nanocomposites rGO–TiO2 and rGO–Fe3O4 have been also prepared by solvothermal method. A systematic study has been done to investigate the photocatalytic activity under visible and UV light irradiation for MB dye and adsorption of As(III) metal ions by analyzing their adsorption isotherm and adsorption kinetics models, respectively.
2. Experimental
2.1 Materials and methods
All the chemicals used in study were of analytical grade. Graphite powder and titanium tetraisobutoxide (TTIB; Ti(OC4H9)4); were procured from Loba Chemie, India and Sigma-Aldrich respectively. Sulfuric acid (H2SO4, 98%), hydrogen peroxide (H2O2, 30%), potassium permanganate (KMnO4), sodium nitrate (NaNO3) and ethylene glycol (C2H6O2) were purchased from Fisher Scientific, India, while ferric chloride hexahydrate (FeCl3·6H2O), acetic acid (Hac), sodium acetate (NaAc) and methylene blue dye were received from Loba Chemie India. Sodium arsenite (NaAsO2), used as As(III) source, was obtained from SDFCL India. All chemicals were used without further purification.GO was prepared by modified Hummer's method reported elsewhere.23 The rGO–Fe3O4 nanocomposite was synthesized by solvothermal reaction reported elsewhere,24 while rGO–TiO2 was also synthesized by simple solvothermal method.25 The ternary composite rGO–Fe3O4–TiO2 was synthesized by using wet chemical method. All the experimental procedures in detail are given in the ESI (S1).†
2.2 Characterization
The morphology of GO and nanocomposites was examined by field emission scanning electron microscopy (FESEM; JEOL-7100F). The crystalline phases of the graphite powder, GO, binary and ternary nanocomposites were analyzed through X-ray diffraction (XRD) using X'Pert Pro PANalytical, advanced X-ray diffractometer with a Cu Kα adsorption spectrometer. Raman spectroscopy was recorded by LabRam Micro-Raman spectrometer (Jobin-Yuon HR 800 UV) using a He–Ne (632.8 nm) laser excitation source. Fourier transform infrared spectroscopy (Bruker-FTIR) was conducted by using KBr pallet in the range of 4000–400 cm−1. The absorbance properties of the nanocomposites were acquired by the UV-vis diffuse reflectance spectra (UV-vis DRS) with a UV-vis-NIR spectrophotometer (Perkin-Elmer Lambda 1050). The specific surface area and pore size distribution were calculated by the Brunauer–Emmett–Teller (BET) and Barrett–Joyner–Halenda (BJH), respectively with an automatic instrument Autosorb iQ (Quanta Chrome Instruments version 3.01). The chemical analysis of GO and nanocomposites were carried out by X-ray photoelectron spectroscopy (XPS) acquired with a PHI500 (Versa ProbeII, FEI Inc.) with Al Kα (1486.6 eV) X-ray source. Batch adsorption analysis of As(III) metal ion was analyzed by atomic adsorption spectroscopy (Spectra A 220FS). The photocatalytic and adsorption experiments were carried out for MB and As(III), respectively. The detailed description of the photocatalytic setup and sample preparation for photocatalysis as well as for adsorption experiments are provided in the ESI (S1).†The photocatalytic degradation rate and removal efficiency of MB under visible and UV irradiation were calculated by measuring the absorbance of collected solutions by UV-vis spectrophotometer at λmax ∼ 664 nm, which is usually determined by  , where C0 (initial) and Ct are the concentrations of MB at time (0) and (t), respectively. The uptake amount of As(III) by nanocomposites was calculated by
  , where q0 and qe are initial and equilibrium concentration of As(III) in mg L−1, respectively, m is the weight of adsorbent in grams while V is the volume of solution in liter.
3. Results and discussion
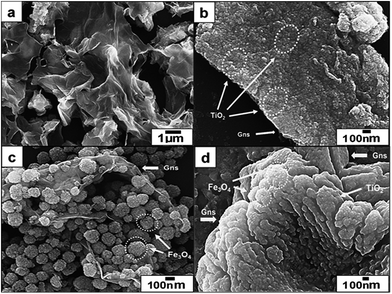
The morphology and grain size of GO and binary/ternary nanocomposite were investigated by FESEM (Fig. 1). The FESEM image of GO (Fig. 1a) reveals a platelet-like porous three-dimensional interlinked structure, which forms due to the exfoliation and restacking process of GO, while the rGO–TiO2 nanocomposite (Fig. 1b) depicts a crinkled texture, where TiO2 nanoparticles spread over the rGO sheet. The average particle size of the attached TiO2 nanoparticles comes around 12 nm. These images also reveal the well dispersion and good anchoring of TiO2 nanoparticles on rGO sheets, which ultimately increase the surface area of nanocomposites. Generally, due to the restacking the rGO sheets show a tendency to get aggregate back. But here, this aggregation is prevented due to the crystallization of TiO2 on the surface of rGO.26 In binary rGO–Fe3O4 nanocomposite (Fig. 1c), the FESEM image shows that with few aggregations, the surface of rGO sheet is uniformly and densely anchored with Fe3O4 nanoparticles with a wide distribution of sizes ranging from 100 to 200 nm. Here, Fe3O4 nanoparticles of different sizes are dispersed on the both sides of the rGO, which can give a better magnetic response. Thus, the perfect anchoring and uniform dispersion of Fe3O4 nanoparticles on GO sheets prevent the agglomeration, which provide larger surface area and thus facilitate the electrons transfer process.27 Moreover, no independent Fe3O4 nanoparticles outside the rGO sheets are observed, which implies that all the decorated nanoparticles are firmly attached to the surface. In case of rGO–Fe3O4–TiO2 (Fig. 1d) the FESEM image reveals a crumpled and rippled type structure, which occurs due to the restacking of rGO sheets. Here, TiO2 and Fe3O4 are uniformly attached to the surface of rGO. Additionally, the intimate connection between TiO2–Fe3O4 and rGO facilitates the transfer of photo-induced electron during photoexcitation process, which enhances photo catalytic activity of nanocomposites.25 The weight percentage of the elements in nanocomposite has been evaluated by EDX (Fig. S1; Table S1†), which firmly confirms the incorporation of Fe3O4 and TiO2 in the nanocomposites.Fig. 2 shows the XRD patterns of commercially obtained graphite powder, synthesized GO, binary and ternary nanocomposite. As revealed in Fig. 2a, graphite powder exhibits a sharp diffraction peak at 26.45°, corresponding to the interplanar spacing of 0.33 nm and a somewhat less intense peak at 54.52°. These peaks can be ascribed to the (002) and (004) hexagonal lattice planes of natural graphite, respectively. Fig. 2b reveals the diffraction pattern of GO, which shows a little broad peak at 12.03°, corresponding to the interlayer spacing of ∼0.73 nm, indicating the destruction of graphite structure due to the oxidation and thus confirms the conversion of graphite powder into GO.28 The oxidation of graphite powder introduces numerous functional groups, which are bonded on the edges as well as both side of basal plane of the graphitic layer.29 For solvothermal synthesized rGO–TiO2 nanocomposite (Fig. 2c), the XRD pattern displays sharp peaks at 25.3, 37.8, 48, 53.9 and 62.7°, which are due to the (101), (004), (200), (105) and (204) tetragonal anatase phase of TiO2, (JCPDS 21-1272), respectively. Here, rGO–TiO2 nanocomposite does not show the characteristic peak of graphene at 26.4° (d ∼ 0.34 nm), as it is masked by the strong peak of TiO2 at 25.4° (101). This overlapping of graphene peak by TiO2 confirms that the solvothermal process enhances the reduction of GO.30 Subsequently, similarly synthesized rGO–Fe3O4 nanocomposite (Fig. 2d) demonstrates the diffraction peaks at 30.6, 36.1, 43.7, 53.4, 57.6, and 63.1° of Fe3O4, which can be indexed to (220), (311), (400), (422), (511) and (440) planes (JCPDS 65-3107), respectively. Here, a less intense broad peak at 25.61° (d ∼ 0.35 nm) is the characteristic peak of graphite, which confirms the reduction of GO after solvothermal process.31 Further, rGO–Fe3O4–TiO2 (Fig. 2e) displays the characteristics peaks of anatase phase of TiO2 as well as of Fe3O4, which are anchored onto rGO sheet. This confirms the formation of ternary nanocomposite. Here, the broad weak peak of rGO at 25.25° (d ∼ 0.35 nm) is superimposed by the strong peak of anatase TiO2 at 25.4°. For all nanocomposites, the absence of GO peak implies the complete exfoliation and reduction of GO into rGO. Further, the broad diffraction peaks of binary and ternary nanocomposite imply the small crystalline size of the Fe3O4/TiO2 nanoparticles. Moreover, these results also suggest that during the synthesis of rGO–TiO2 and rGO–Fe3O4–TiO2 nanocomposites, TiO2 precursor (TTIB) is converted into anatase phase. To compare the XRD patterns of nanocomposites with bare TiO2 and Fe3O4, the XRD patterns of these metal oxides are attached in ESI (Fig. S2†), where the pristine TiO2 shows pure anatase structure.
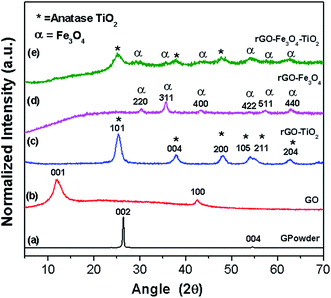 | ||
| Fig. 2 XRD patterns of (a) graphite powder, (b) GO, (c) rGO–TiO2, (d) rGO–Fe3O4 and (e) rGO–Fe3O4–TiO2. | ||
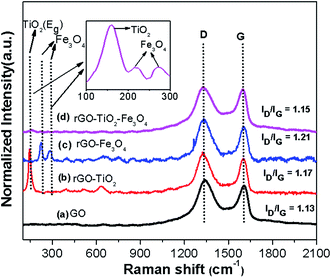
To further explore the chemical, structural and vibrational bands of nanocomposites, Raman study was carried out. Fig. 3 shows the Raman spectra of GO and binary/ternary nanocomposites, where GO (Fig. 3a) shows two sharp peaks at 1341 and 1603 cm−1, which can be attributed to the disorder carbon (D band) and graphitic carbon (G band), respectively.32 A weak D band implies the low density of defects, whereas the crystal structure, disorder and defects can be analyzed with the change in relative intensity of D and G peaks.33 Here, D and G band intensity ratio (ID/IG) is found ∼1.13. The rGO–TiO2 nanocomposite (Fig. 3b) shows the specific vibration modes centered at 144 (Eg), 396 (B1g), 512 (B1g + A1g) and 631 cm−1 (Eg), indicating the presence of the anatase phase of TiO2,18 which is consistent with the XRD results. Moreover, compared to GO, here ID/IG ratio increases to ∼1.17, which indicates the removal of oxygen from GO. Further, rGO–Fe3O4 nanocomposite (Fig. 3c), displays the characteristic peak of Fe3O4 at 223, 285, and 400 cm−1(ref. 34) as well as the peaks of graphitic structure at D (1331 cm−1) and G (1605 cm−1), where the band intensity ratio (ID/IG) increases to ∼1.21. This enhanced intensity ratio again confirms the removal of oxygen from GO. The Raman spectra of rGO–Fe3O4–TiO2 (Fig. 3d) shows the individual peaks of Fe3O4 (223, 285, 400 cm−1), TiO2 (144, 396, 512, 631 cm−1) and rGO, having D and G band at 1329 and 1600 cm−1, respectively. Here, the calculated ID/IG ratio comes around ∼1.15, which is more than GO, which further affirms the removal of oxygen.35 Further, the G band of rGO–Fe3O4–TiO2 becomes weaker and broader, indicating the higher degree of defects in graphene due to the reduction of GO into rGO.36 The increased ratio of ID/IG intensity in binary and ternary nanocomposites also indicates the higher degree of defects, which generates due to incorporation of Fe3O4 and TiO2 onto rGO sheets.37
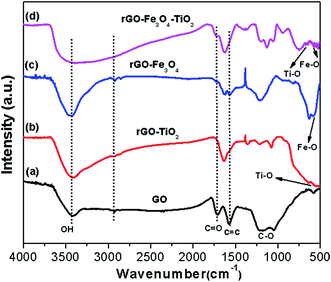
The strong acid interaction of graphite develops many oxygen-containing functional absorption groups. To evaluate the chemistry of these functional groups, FTIR of GO and as synthesized binary and ternary nanocomposite has been carried out in the range of 4000–400 cm−1 (Fig. 4). The spectrum of GO (Fig. 4a) shows the absorption stretching vibrations peaks, centered at 1060 and 1706 cm−1, which can be ascribed to the stretching of C–O and C![[double bond, length as m-dash]](https://www.rsc.org/images/entities/char_e001.gif) O groups, while the vibration band at 1571–1210 cm−1 is due to the stretching of phenolic group C–OH and C
O groups, while the vibration band at 1571–1210 cm−1 is due to the stretching of phenolic group C–OH and C![[double bond, length as m-dash]](https://www.rsc.org/images/entities/char_e001.gif) C group, respectively. Moreover, the broad peak at 3412 cm−1 arises due to the stretching vibrations of O–H stretching mode of intercalated water,38 whereas the small peaks at 2854 and 2921 cm−1 are attributed to the stretching vibration of the CH2 bond.25 In binary rGO–TiO2 nanocomposite (Fig. 4b), some of the functional groups such as OH, –COOH are removed due to the formation of Ti–O–C bond on the GO surface.39 Here, the lowering of the absorption peak at 1705 cm−1 can be assigned to the C
C group, respectively. Moreover, the broad peak at 3412 cm−1 arises due to the stretching vibrations of O–H stretching mode of intercalated water,38 whereas the small peaks at 2854 and 2921 cm−1 are attributed to the stretching vibration of the CH2 bond.25 In binary rGO–TiO2 nanocomposite (Fig. 4b), some of the functional groups such as OH, –COOH are removed due to the formation of Ti–O–C bond on the GO surface.39 Here, the lowering of the absorption peak at 1705 cm−1 can be assigned to the C![[double bond, length as m-dash]](https://www.rsc.org/images/entities/char_e001.gif) O stretching. Moreover, the bands at 1400–1600 cm−1 arise due to the Ti–O–C vibration, which affirm the effective interaction between Ti and C and, thus the impregnation of TiO2 on rGO while the absorption band at 670–450 cm−1 implies the presence of Ti–O–Ti bond on the surface of rGO–TiO2 nanocomposite.40,41 In rGO–Fe3O4 nanocomposite (Fig. 4c), most of the oxidized functional groups disappear, confirming the reduction of GO into rGO as the weakening of the absorption peaks at 1628 cm−1 and 1038 cm−1 indicates the reduction of GO, while the appearance of an additional band at 619–578 cm−1 ensures the absorption of water due to Fe3O4 nanoparticles.36 Further, the new characteristics peak, originates at 573 cm−1, can be attributed to the stretching vibration of the Fe–O bond. Finally, the FTIR spectra of rGO–Fe3O4–TiO2 (Fig. 4d) clearly show the decrement of the absorption bands, with the characteristics peak of TiO2 and Fe3O4 at 670 cm−1 and 578 cm−1, respectively, which affirms that during solvothermal process TiO2 and Fe3O4 nanoparticles have been covalently grafted over rGO sheets.
O stretching. Moreover, the bands at 1400–1600 cm−1 arise due to the Ti–O–C vibration, which affirm the effective interaction between Ti and C and, thus the impregnation of TiO2 on rGO while the absorption band at 670–450 cm−1 implies the presence of Ti–O–Ti bond on the surface of rGO–TiO2 nanocomposite.40,41 In rGO–Fe3O4 nanocomposite (Fig. 4c), most of the oxidized functional groups disappear, confirming the reduction of GO into rGO as the weakening of the absorption peaks at 1628 cm−1 and 1038 cm−1 indicates the reduction of GO, while the appearance of an additional band at 619–578 cm−1 ensures the absorption of water due to Fe3O4 nanoparticles.36 Further, the new characteristics peak, originates at 573 cm−1, can be attributed to the stretching vibration of the Fe–O bond. Finally, the FTIR spectra of rGO–Fe3O4–TiO2 (Fig. 4d) clearly show the decrement of the absorption bands, with the characteristics peak of TiO2 and Fe3O4 at 670 cm−1 and 578 cm−1, respectively, which affirms that during solvothermal process TiO2 and Fe3O4 nanoparticles have been covalently grafted over rGO sheets.
The specific surface area and pore size distribution of GO and nanocomposite were calculated by BET and BJH analysis, respectively. The N2 adsorption/desorption isotherms were obtained at 77 K and prior to start the characterizations all the samples were degassed in N2 for 8 h at 100 °C under vacuum. Multi-point BET surface area and BJH pore size distribution for each sample are shown in Table S2.† It is evident from the Table S2† that compared to GO, the nanocomposites own a high surface area, where binary rGO–TiO2 nanocomposite provides the highest specific surface area (246.27 m2 g−1). The lowering of surface area in rGO–Fe3O4 may be attributed to the magnetic nature of Fe3O4 nanoparticles, due to which they can easily combine together.42 The surface area of rGO–Fe3O4–TiO2 comes around 173.10 m2 g−1, which is more than that of rGO–Fe3O4 but less than that of rGO–TiO2. Here, the reduction of surface area is due to the addition of Fe3O4. The BJH analysis confirms that the interlayered structure of nanocomposites forms an open porous structure, having a number of macro and meso pores. Here, the porous structure of nanocomposites can facilitate the diffusion of charge carriers, which is very essential for the photocatalytic degradation process.
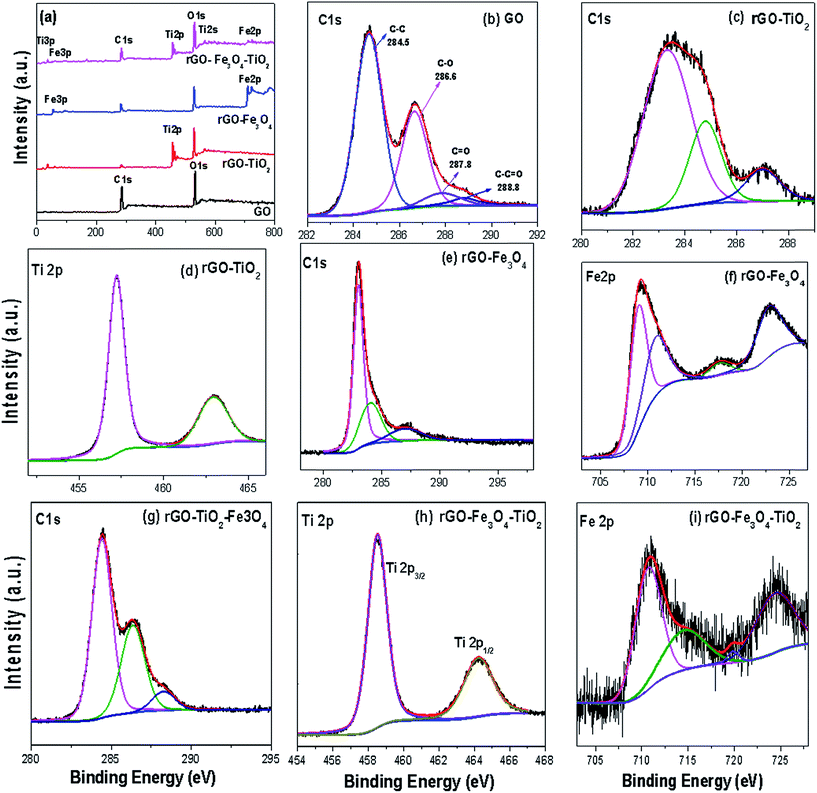
The chemical states of GO and nanocomposites were evaluated by XPS. The peaks were analyzed by using XPSPEAK version 4.1 program, where Shirley background and Gaussian–Lorentzian distributions were employed to fit the baselines and XPS peaks, respectively. Fig. 5a shows the survey spectra of GO, rGO–TiO2, rGO–Fe3O4 and rGO–Fe3O4–TiO2 nanocomposites, which confirm the presence of C1s, O1s, Fe2p and Ti2p in them. The XPS spectrum of C1s of GO (Fig. 4b) consists the center peak at 284.5 eV, which originates from the graphitic sp2 carbons, while the peaks at 286.6, 287.8 and 288.8 eV are due to the oxygenate group attached to the carbon atom, such as C–O, C![[double bond, length as m-dash]](https://www.rsc.org/images/entities/char_e001.gif) O and O–C
O and O–C![[double bond, length as m-dash]](https://www.rsc.org/images/entities/char_e001.gif) O groups, respectively.43 However, in rGO–TiO2, rGO–Fe3O4 and rGO–Fe3O4–TiO2 most of the epoxide and hydroxide groups are removed from C1s XPS spectrum (Fig. 5c, e and g) and intensity of the peaks related to the oxygen functionalities becomes weaker than that of GO. The reduction of peak intensities affirms the presence of residual oxygenate group on rGO. It is observed that in nanocomposites the C/O ratio enhances, which indicates that the rGO sheets can serve as a conductive channel between the metal oxides nanoparticles and are favorable for photocatalytic process.36 In rGO–TiO2 (Fig. 5c), the main broad peak at 284.3 eV and other peaks at 285.6 and 287.9 eV are due to the residual oxygen containing groups. The presence of oxygenated weaker peak indicates the deoxygenation of GO and formation of rGO. The rGO–Fe3O4 provides the similar type of C1s spectra (Fig. 5e), however compared to rGO–TiO2, the intensity of peak centered at 284.3 eV increases, which implies the enhancement of the remaining oxygenate groups. The presence of these bonds indicates the high degree of oxidation in GO, which occurs during the synthesis of GO by Hummers method. Again compared to GO, the respective peak intensities of C1s spectra of rGO–Fe3O4–TiO2 nanocomposite (Fig. 5g) reduces, which implies that during solvothermal synthesis of ternary nanocomposite most of the hydroxyl and epoxide functional groups have been successfully removed. The removal of these groups indicates the good electronic conductivity among its constituents, which might induce the GO sheet to serves as a conductive channel between Fe3O4 and TiO2 nanoparticles.36 Fig. 5d shows XPS spectra of Ti2p of the binary rGO–TiO2, where the spin–orbit splitting of Ti2p peak leads the doublets Ti2p3/2 and Ti2p1/2, which are located at 457.3 and 463 eV, respectively. These peak positions also confirm that, here core level Ti4+ spectrum is of anatase phase,18 which is the agreement with XRD and Raman analysis. However, in rGO–Fe3O4–TiO2 (Fig. 5h), the Ti2p3/2 (459 eV) and Ti2p1/2 (464.5 eV) peaks shift towards somewhat higher binding energy, which might be due to the formation of Ti–O–Fe bonds on the surface of TiO2. Moreover, the low binding energy difference between these doublets (5.5 eV) indicates the interaction between the lattice Ti and oxide functional groups of rGO.44 Further, the high resolution XPS spectrum of Fe2p in rGO–Fe3O4 (Fig. 5f) shows two characteristics peaks of Fe2p3/2 (710.09 eV) and Fe2p1/2 (723.34 eV), which is accredited to the Fe(III). The Fe2p3/2 has associated satellite peak, which is situated around 8 eV higher (717.53 eV) than the principal peak and does not overlap with Fe2p3/2 or Fe2p1/2 peak. This is in agreement with the reported XPS results.45 This satellite peak is the characteristics of Fe3+ state of γ-Fe2O3 state. Moreover, the peak obtained at 709.09 confirms the oxidation of Fe2+.46
O groups, respectively.43 However, in rGO–TiO2, rGO–Fe3O4 and rGO–Fe3O4–TiO2 most of the epoxide and hydroxide groups are removed from C1s XPS spectrum (Fig. 5c, e and g) and intensity of the peaks related to the oxygen functionalities becomes weaker than that of GO. The reduction of peak intensities affirms the presence of residual oxygenate group on rGO. It is observed that in nanocomposites the C/O ratio enhances, which indicates that the rGO sheets can serve as a conductive channel between the metal oxides nanoparticles and are favorable for photocatalytic process.36 In rGO–TiO2 (Fig. 5c), the main broad peak at 284.3 eV and other peaks at 285.6 and 287.9 eV are due to the residual oxygen containing groups. The presence of oxygenated weaker peak indicates the deoxygenation of GO and formation of rGO. The rGO–Fe3O4 provides the similar type of C1s spectra (Fig. 5e), however compared to rGO–TiO2, the intensity of peak centered at 284.3 eV increases, which implies the enhancement of the remaining oxygenate groups. The presence of these bonds indicates the high degree of oxidation in GO, which occurs during the synthesis of GO by Hummers method. Again compared to GO, the respective peak intensities of C1s spectra of rGO–Fe3O4–TiO2 nanocomposite (Fig. 5g) reduces, which implies that during solvothermal synthesis of ternary nanocomposite most of the hydroxyl and epoxide functional groups have been successfully removed. The removal of these groups indicates the good electronic conductivity among its constituents, which might induce the GO sheet to serves as a conductive channel between Fe3O4 and TiO2 nanoparticles.36 Fig. 5d shows XPS spectra of Ti2p of the binary rGO–TiO2, where the spin–orbit splitting of Ti2p peak leads the doublets Ti2p3/2 and Ti2p1/2, which are located at 457.3 and 463 eV, respectively. These peak positions also confirm that, here core level Ti4+ spectrum is of anatase phase,18 which is the agreement with XRD and Raman analysis. However, in rGO–Fe3O4–TiO2 (Fig. 5h), the Ti2p3/2 (459 eV) and Ti2p1/2 (464.5 eV) peaks shift towards somewhat higher binding energy, which might be due to the formation of Ti–O–Fe bonds on the surface of TiO2. Moreover, the low binding energy difference between these doublets (5.5 eV) indicates the interaction between the lattice Ti and oxide functional groups of rGO.44 Further, the high resolution XPS spectrum of Fe2p in rGO–Fe3O4 (Fig. 5f) shows two characteristics peaks of Fe2p3/2 (710.09 eV) and Fe2p1/2 (723.34 eV), which is accredited to the Fe(III). The Fe2p3/2 has associated satellite peak, which is situated around 8 eV higher (717.53 eV) than the principal peak and does not overlap with Fe2p3/2 or Fe2p1/2 peak. This is in agreement with the reported XPS results.45 This satellite peak is the characteristics of Fe3+ state of γ-Fe2O3 state. Moreover, the peak obtained at 709.09 confirms the oxidation of Fe2+.46
3.1 Photocatalytic activity of nanocomposites
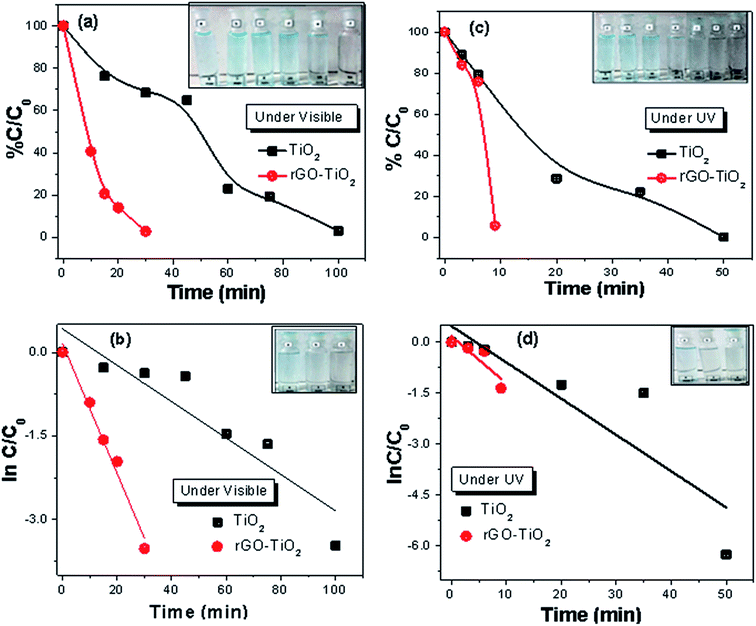
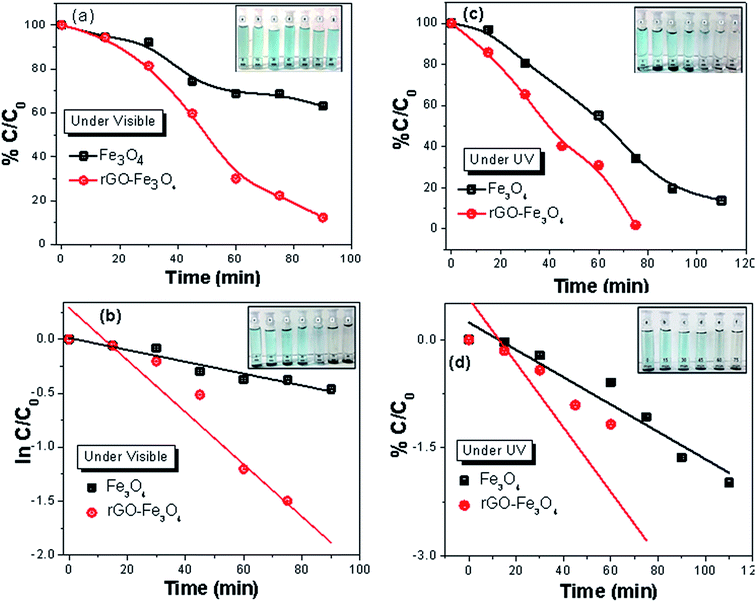
The photo catalytic performance of rGO–TiO2, rGO–Fe3O4 and rGO–Fe3O4–TiO2 nanocomposites were evaluated by the degradation of MB in aqueous solution under UV and visible irradiation, both (Fig. 6). For comparison, photocatalytic degradation was also carried out with bare TiO2 and Fe3O4 nanoparticles. In visible light irradiation, it is observed that TiO2 degrades 98% of MB dye within 100 min, while rGO–TiO2 degrades almost all MB within 25 min (Fig. 6a). Here, the low degradation efficiency of pure TiO2 can be attributed to its high band gap as well as fast recombination rate of charge carriers. However, in rGO–TiO2, the rGO sheets serve as the excellent electrons acceptor and thus help in the quick transfer of photo-induced electrons from the conduction band of TiO2 to its surfaces.47 This prevents the recombination of charge carriers and thus enhances the photocatalytic activity of rGO–TiO2. Further, under UV light exposure, the degradation rate increases and rGO–TiO2 completely removes the dye within 8 min, while pure TiO2 takes 50 min for the same (Fig. 6c). Here, the faster degradation of MB can be attributed to the increment of defect sites, leading to the better absorption of light. The whole photocatalytic mechanism of TiO2 and binary rGO–TiO2 nanocomposite for MB degradation is attached in the ESI (S3).† In addition, in presence of UV irradiation, H2O2 plays vital role in degradation of MB as it generates two hydroxyl radicals (HO˙). The HO˙ are considered extremely strong oxidant for the degradation of organic pollutants.48 Thus, the incorporation of H2O2 helps in MB degradation (S4†).The photocatalytic degradation characteristics of rGO–Fe3O4 and Fe3O4 for MB in presence of visible and UV light are displayed in Fig. 7. Generally, Fe3O4 exhibits the excellent adsorption capacity and its incorporation in rGO–Fe3O4 prevents the agglomeration and restacking of rGO, which eventually increases surface area and adsorption sites of nanocomposite.16 In addition, the synergistic interaction between rGO and Fe3O4 makes the electron transfer easy, which can facilitate the reduction of Fe3+ to Fe2+as well as generation of HO˙. However, under visible light irradiation, a somewhat less degradation is observed (Fig. 7a). The high catalytic activity of Fe3O4 and rGO–Fe3O4 under UV irradiation can be attributed to the enhanced photo-induced charge separation (Fig. 7c).49 In addition, due to the suppression of charge recombination, rGO–Fe3O4 nanocomposite shows better photocatalytic activity than bare Fe3O4 nanoparticles. The reaction mechanism of photocatalytic degradation of MB by Fe3O4 and rGO–Fe3O4 are described in the ESI (S5).† Moreover, in presence of H2O2, Fe3O4 nanoparticles initiate heterogeneous Fenton-like reaction, which further enhances adsorption rate due to the catalytic degradation of MB (S6†).
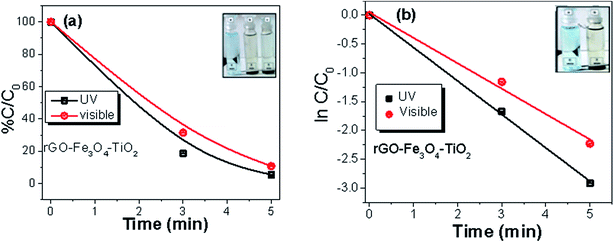
The highest photocatalytic degradation efficiency for MB is observed for rGO–Fe3O4–TiO2 nanocomposite (Fig. 8), where it is found that in presence of UV irradiation, it degrades ∼100% of MB under 5 min, while in visible light, 91% of MB eliminates (Fig. 8a). Here, the enhancement in photocatalytic activity can be accredited to the synergic effect between catalytic activity and adsorption capability of nanostructured TiO2 and Fe3O4 with rGO. Here, the degradation of MB can proceed by many ways such as direct attack of hydroxyl radical, direct reduction by photo-induced electron or direct oxidation in the presence of holes.50 As, it is discussed earlier that rGO sheets show a tendency to get agglomerated back in graphitic structure due to strong van der Waal interaction.26 Here, the incorporation of TiO2 on the rGO surface helps to reduce the agglomeration of the graphene sheets. Moreover, during the photocatalysis process the interlink connection between TiO2 and rGO permits the easy electrons transfer, which can significantly enhances the charge carrier separation and hence improves the photocatalytic activity. Furthermore, in presence of H2O2 the incorporated Fe3O4 produces the excess HO˙ from Fenton/photo-Fenton processes, which can further degrades the adsorbed dye from the surface of the nanocomposite. Fe3O4 helps the pollutants to get adsorbed on the surface of nanocomposite, which eventually enhances the degradation rate. In addition, being a magnetic adsorbent, Fe3O4 favors in the magnetic separation of the nanocomposite photocatalyst from the dispersion. Thus, the incorporation of TiO2 and Fe3O4 in rGO improves the photocatalytic activity of rGO–Fe3O4–TiO2. The photocatalytic degradation of MB by all nanocomposites follows pseudo first order reaction kinetics, described by  , where K is the first order rate constant. The degradation rate for all the nanocomposites (Fig. 6b and d, Fig. 7b and d, Fig. 8b), under visible and UV light are calculated and listed in Table S3.† Among all, the maximum rate constant is observed for rGO–Fe3O4–TiO2 nanocomposite under UV-light irradiation (K = 0.56 min−1). Furthermore, the stability as well as reusability of the synthesized nanocomposites were investigated by reusing the ternary rGO–Fe3O4–TiO2 nanocomposite, as this is important from industrial point of view. For this, rGO–Fe3O4–TiO2 nanocomposite was separated, washed and dried after the photocatalytic reaction and then reused for the next three run. The recycled adsorption behavior is shown in Fig. S3,† where it is observed that, after being used for three times the dye removal efficiency is found to be 94% and 86% for UV and visible light irradiation, respectively. This indicates the good stability and reusability of the nanocomposites.
3.2 Adsorption analysis
The large specific surface area, high pore volume and pore size of metal oxides make them excellent adsorbent for hazardous anions such as phosphate, arsenate, fluoride etc. Due to the high porosity, metal oxides offer many adsorption sites for water adsorbed anions pollutant, which improve specific affinity of them towards anions. In addition, the existence of the large number of HO˙ present on the surface of anions also helps them to get adsorbed inside the metal oxides.51 After interacting with metal oxide surface, arsenic ion undergoes through chemisorption process and reflects a tendency to form bidentate binuclear and monodentate two inner-sphere surface complex.52 From BET results, it is cleared that the incorporation of Fe3O4 and TiO2 metal oxides on rGO sheet increases specific surface area of resultant nanocomposite, which can lead to significant improvement in arsenic removal efficiency. Thus to explore the adsorption capabilities of as-synthesized nanocomposites, the present study investigates the adsorption of As(III) metal ions upon Fe3O4 and TiO2 nanoparticles attached over rGO sheets, using different adsorption isotherms and kinetic model.
 | (1) |
 | (2) |
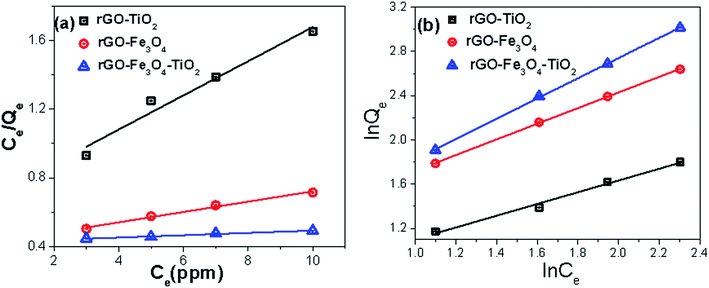 | ||
| Fig. 9 (a) Langmuir and (b) Freundlich adsorption isotherm plots of As(III) adsorption on nanocomposites at room temperature (pH ∼ 7.0). | ||
| Adsorbent | qmax (mg g−1) | Reference |
|---|---|---|
| Nanoscale zero valent iron (NZVI)–rGO | 35.83 | 54 |
| NZVI-activated carbon nanoparticles | 18.2 | 55 |
| Iron-containing ordered mesoporous carbon | 9.3 | 56 |
| Fe3O4–rGO nanoparticles | 13.1 | 14 |
| Fe3O4–rGO–MnO2 nanoparticles | 14.04 | 57 |
| Functionalized graphene sheets | 138.79 | 58 |
| ZrO((OH)2)–GO | 95.15 | 59 |
| rGO–TiO2 | 10.6 | Present study |
| rGO–Fe3O4 | 33.22 | Present study |
| rGO–Fe3O4–TiO2 | 147.05 | Present study |
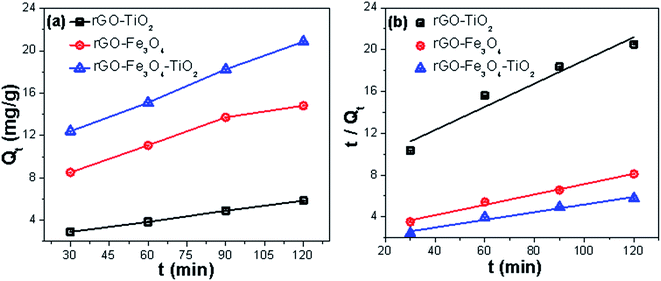
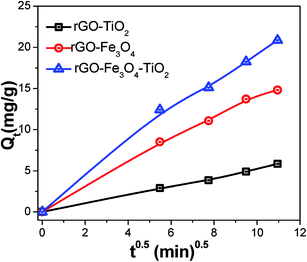
 ,49 where K1 (g mg−1 min−1) is the rate constant of the pseudo-second-order model. Qt (mg g−1) and Qeq (mg g−1) are the amount of the As(III) adsorbed at time t (min) and equilibrium, respectively. Fig. 10a and b shows the adsorption of As(III) ions on nanocomposites, which implies that the adsorption increases significantly with increasing contact time. All the parameters along with correlation coefficient (R2) and initial adsorption rate h0, obtained from the plot of pseudo-second-order kinetic model, are shown in Table S5.† The initial adsorption rate values were calculated by using the relation h0 = K1 × Qe2.60 The high correlation coefficient values suggest that the adsorption kinetic of As(III) on nanocomposites follows the pseudo second order model, which affirms that adsorption of As(III) occurs through chemisorption process.61 Further, the adsorption of As(III) on nanocomposites was also investigated by the intraparticle diffusion (IPD) model.62 According to IPD model the initial rate of intraparticle diffusion is obtained by using the relation Qt = Kit0.5, where Qt (mg g−1) is the amount of adsorbed metal ions at time t (min) on the nanocomposites and Ki (mg g−1 min−1) is the IPD rate constant. Here, Ki is rate determining factor and obtained by the slope of the IPD relation. Fig. 11 shows the adsorption of As(III) with square root of time, where the initial curved part can be attributed to the boundary layer diffusion effect63 while the final linear portion might be due to the intraparticle diffusion effects. These results reveal that here, adsorption of As(III) ions involves both boundary layer and intraparticle diffusion effect. Ki is a very important factor, which decides the rate of adsorption in the linear region of the curve. The obtained Ki values are given in Table S5,† where the ternary nanocomposite (rGO–Fe3O4–TiO2) shows the maximum IPD rate constant value.
4. Conclusions
In summary, a unique ternary nanocomposite, comprising of Fe3O4 and TiO2 nanoparticles supported on rGO has been synthesized by using simple wet chemical method. Compared to binary (rGO–TiO2/rGO–Fe3O4) nanocomposites, the ternary rGO–Fe3O4–TiO2 nanocomposite shows excellent photocatalytic efficiency and high adsorption affinity for the removal of MB and As(III) from water. The MB degradation was evaluated under both UV and visible irradiation. Compared to bare TiO2 and Fe3O4 nanoparticles, the nanocomposites show high dye degradation efficiency due to the synergetic interaction of metal oxides with rGO. The dye degradation efficiency is found to be more under UV-irradiation and the maximum rate degradation rate is observed for ternary nanocomposite (K = 0.58 min−1). Langmuir adsorption isotherm suggests that the ternary nanocomposite owns maximum adsorption capacity 147.05 (mg g−1) for As(III) metal ions. The obtained adsorption kinetic data are found to be linearly well fitted with the pseudo-second-order model. Due to the striking features of ternary nanocomposites (rGO–Fe3O4–TiO2), it can be efficiently used for many applications, especially in wastewater treatment.Acknowledgements
This work is financially supported by Department of Science and Technology India.References
- R. K. Upadhyay, N. Soin and S. S. Roy, RSC Adv., 2014, 4, 3823–3851 RSC.
- T. Robinson, G. McMullan, R. Marchant and P. Nigam, Bioresour. Technol., 2001, 77, 247–255 CrossRef CAS.
- B. Prasad, C. Ghosh, A. Chakraborty, N. Bandyopadhyay and R. Ray, Desalination, 2011, 274, 105–112 CrossRef CAS PubMed.
- P. Benjwal and K. K. Kar, J. Environ. Chem. Eng., 2015, 3, 2076–2083 CrossRef CAS PubMed.
- A. K. Geim, Science, 2009, 324, 1530–1534 CrossRef CAS PubMed.
- V. K. K. Upadhyayula, S. Deng, M. C. Mitchell and G. B. Smith, Sci. Total Environ., 2009, 408, 1–13 CrossRef CAS PubMed.
- G. Jiang, Z. Lin, C. Chen, L. Zhu, Q. Chang, N. Wang, W. Wei and H. Tang, Carbon, 2011, 49, 2693–2701 CrossRef CAS PubMed.
- X. An and J. C. Yu, RSC Adv., 2011, 1, 1426–1434 RSC.
- C. Shan, H. Yang, D. Han, Q. Zhang, A. Ivaska and L. Niu, Langmuir, 2009, 25, 12030–12033 CrossRef CAS PubMed.
- X. Yang, C. Chen, J. Li, G. Zhao, X. Ren and X. Wang, RSC Adv., 2012, 2, 8821–8826 RSC.
- D. Wang, R. Kou, D. Choi, Z. Yang, Z. Nie, J. Li, L. V. Saraf, D. Hu, J. Zhang and G. L. Graff, ACS Nano, 2010, 4, 1587–1595 CrossRef CAS PubMed.
- S. Wang, S. P. Jiang and X. Wang, Electrochim. Acta, 2011, 56, 3338–3344 CrossRef CAS PubMed.
- D. Long, W. Li, L. Ling, J. Miyawaki, I. Mochida and S.-H. Yoon, Langmuir, 2010, 26, 16096–16102 CrossRef CAS PubMed.
- V. Chandra, J. Park, Y. Chun, J. W. Lee, I.-C. Hwang and K. S. Kim, ACS Nano, 2010, 4, 3979–3986 CrossRef CAS PubMed.
- P. Mandal and A. P. Chattopadhyay, Dalton Trans., 2015, 44, 11444–11456 RSC.
- H. Sun, L. Cao and L. Lu, Nano Res., 2011, 4, 550–562 CrossRef CAS.
- C. T. Yavuz, J. Mayo, W. Y. William, A. Prakash, J. C. Falkner, S. Yean, L. Cong, H. J. Shipley, A. Kan and M. Tomson, Science, 2006, 314, 964–967 CrossRef PubMed.
- P. Benjwal and K. K. Kar, Mater. Chem. Phys., 2015, 160, 279–288 CrossRef CAS PubMed.
- G. Williams, B. Seger and P. V. Kamat, ACS Nano, 2008, 2, 1487–1491 CrossRef CAS PubMed.
- Q. Xiang and J. Yu, J. Phys. Chem. Lett., 2013, 4, 753–759 CrossRef CAS PubMed.
- X.-X. Wei, C.-M. Chen, S.-Q. Guo, F. Guo, X.-M. Li, X.-X. Wang, H.-T. Cui, L.-F. Zhao and W. Li, J. Mater. Chem. A, 2014, 2, 4667–4675 CAS.
- Y. Wang, J. Yu, W. Xiao and Q. Li, J. Mater. Chem. A, 2014, 2, 3847–3855 CAS.
- W. S. Hummers Jr and R. E. Offeman, J. Am. Chem. Soc., 1958, 80, 1339–1339 CrossRef.
- C. Santhosh, P. Kollu, S. Doshi, M. Sharma, D. Bahadur, M. T. Vanchinathan, P. Saravanan, B.-S. Kim and A. N. Grace, RSC Adv., 2014, 4, 28300–28308 RSC.
- L.-L. Tan, W.-J. Ong, S.-P. Chai and A. R. Mohamed, Nanoscale Res. Lett., 2013, 8, 1–9 CrossRef PubMed.
- S. D. Perera, R. G. Mariano, K. Vu, N. Nour, O. Seitz, Y. Chabal and K. J. Balkus Jr, ACS Catal., 2012, 2, 949–956 CrossRef CAS.
- X. Yang, X. Zhang, Y. Ma, Y. Huang, Y. Wang and Y. Chen, J. Mater. Chem., 2009, 19, 2710–2714 RSC.
- Z. Xiong, L. L. Zhang, J. Ma and X. Zhao, Chem. Commun., 2010, 46, 6099–6101 RSC.
- S. Stankovich, D. A. Dikin, G. H. Dommett, K. M. Kohlhaas, E. J. Zimney, E. A. Stach, R. D. Piner, S. T. Nguyen and R. S. Ruoff, Nature, 2006, 442, 282–286 CrossRef CAS PubMed.
- Y.-J. Xu, Y. Zhuang and X. Fu, J. Phys. Chem. C, 2010, 114, 2669–2676 CAS.
- W. Yan, F. He, S. Gai, P. Gao, Y. Chen and P. Yang, J. Mater. Chem. A, 2014, 2, 3605–3612 CAS.
- J. Cherusseri and K. K. Kar, RSC Adv., 2015, 5, 34335–34341 RSC.
- R. Sharma and K. K. Kar, J. Mater. Chem. A, 2015, 3, 11948–11959 CAS.
- Y. Jiang, Z.-J. Jiang, L. Yang, S. Cheng and M. Liu, J. Mater. Chem. A, 2015, 3, 11847–11856 CAS.
- V. Štengl, S. Bakardjieva, T. M. Grygar, J. Bludská and M. Kormunda, Chem. Cent. J., 2013, 7, 41 CrossRef PubMed.
- M. Zong, Y. Huang, Y. Zhao, X. Sun, C. Qu, D. Luo and J. Zheng, RSC Adv., 2013, 3, 23638–23648 RSC.
- C. Gómez-Navarro, R. T. Weitz, A. M. Bittner, M. Scolari, A. Mews, M. Burghard and K. Kern, Nano Lett., 2007, 7, 3499–3503 CrossRef PubMed.
- J. Paredes, S. Villar-Rodil, A. Martinez-Alonso and J. Tascon, Langmuir, 2008, 24, 10560–10564 CrossRef CAS PubMed.
- Y. Zhang and C. Pan, J. Mater. Sci., 2011, 46, 2622–2626 CrossRef CAS.
- N. Yang, J. Zhai, D. Wang, Y. Chen and L. Jiang, ACS Nano, 2010, 4, 887–894 CrossRef CAS PubMed.
- G. Jung and H. I. Kim, J. Appl. Polym. Sci., 2014, 131, 40715–40721 CrossRef PubMed.
- J. Su, M. Cao, L. Ren and C. Hu, J. Phys. Chem. C, 2011, 115, 14469–14477 CAS.
- J. Zhang, Z. Xiong and X. Zhao, J. Mater. Chem., 2011, 21, 3634–3640 RSC.
- G. T. S. How, A. Pandikumar, H. N. Ming and L. H. Ngee, Sci. Rep., 2014, 4, 5044 CAS.
- W. Jiang, K.-L. Lai, H. Hu, X.-B. Zeng, F. Lan, K.-X. Liu, Y. Wu and Z.-W. Gu, J. Nanopart. Res., 2011, 13, 5135–5145 CrossRef CAS.
- T. Daou, G. Pourroy, S. Begin-Colin, J. Greneche, C. Ulhaq-Bouillet, P. Legare, P. Bernhardt, C. Leuvrey and G. Rogez, Chem. Mater., 2006, 18, 4399–4404 CrossRef CAS.
- Y. Dai, Y. Jing, J. Zeng, Q. Qi, C. Wang, D. Goldfeld, C. Xu, Y. Zheng and Y. Sun, J. Mater. Chem., 2011, 21, 18174–18179 RSC.
- D. Ravelli, D. Dondi, M. Fagnoni and A. Albini, Chem. Soc. Rev., 2009, 38, 1999–2011 RSC.
- T. Peik-See, A. Pandikumar, L. H. Ngee, H. N. Ming and C. C. Hua, Catal. Sci. Technol., 2014, 4, 4396–4405 CAS.
- B. Jiang, C. Tian, Q. Pan, Z. Jiang, J.-Q. Wang, W. Yan and H. Fu, J. Phys. Chem. C, 2011, 115, 23718–23725 CAS.
- Q. Jiuhui, J. Environ. Sci., 2008, 20, 1–13 CrossRef CAS.
- C. Luengo, M. Brigante and M. Avena, J. Colloid Interface Sci., 2007, 311, 354–360 CrossRef CAS PubMed.
- R. Kumar, J. Rashid and M. Barakat, RSC Adv., 2014, 4, 38334–38340 RSC.
- C. Wang, H. Luo, Z. Zhang, Y. Wu, J. Zhang and S. Chen, J. Hazard. Mater., 2014, 268, 124–131 CrossRef CAS PubMed.
- H. Zhu, Y. Jia, X. Wu and H. Wang, J. Hazard. Mater., 2009, 172, 1591–1596 CrossRef CAS PubMed.
- Z. Gu, B. Deng and J. Yang, Microporous Mesoporous Mater., 2007, 102, 265–273 CrossRef CAS PubMed.
- X. Luo, C. Wang, S. Luo, R. Dong, X. Tu and G. Zeng, Chem. Eng. J., 2012, 187, 45–52 CrossRef CAS PubMed.
- A. K. Mishra and S. Ramaprabhu, Desalination, 2011, 282, 39–45 CrossRef CAS PubMed.
- X. Luo, C. Wang, L. Wang, F. Deng, S. Luo, X. Tu and C. Au, Chem. Eng. J., 2013, 220, 98–106 CrossRef CAS PubMed.
- Y. S. Ho and G. McKay, Chem. Eng. J., 1998, 70, 115–124 CrossRef CAS.
- T. Wen, X. Wu, X. Tan, X. Wang and A. Xu, ACS Appl. Mater. Interfaces, 2013, 5, 3304–3311 CAS.
- W. J. Weber and J. C. Morris, J. Sanit. Eng. Div., Am. Soc. Civ. Eng., 1963, 89, 31–60 Search PubMed.
- C. Chang, W. Tsai, C. Ing and C. Chang, J. Colloid Interface Sci., 2003, 260, 273–279 CrossRef CAS.
Footnote |
| † Electronic supplementary information (ESI) available. See DOI: 10.1039/c5ra13689j |
| This journal is © The Royal Society of Chemistry 2015 |

