Lithium–oxygen batteries with ester-functionalized ionic liquid-based electrolytes

Jae-Hong Kima, Hyun-Sik Wooa, So-Jeong Jinb, Je Seung Lee*b, Wonkeun Kimc, Kyounghan Ryuc and Dong-Won Kim*a
aDepartment of Chemical Engineering, Hanyang University, Seoul 133-791, Republic of Korea. E-mail: dongwonkim@hanyang.ac.kr
bDepartment of Chemistry, Kyung Hee University, Seoul 130-701, Republic of Korea
cR&D Division, Hyundai Motor Company, Gyeonggi-do 437-815, Republic of Korea

Received 13th July 2015 , Accepted 14th September 2015

First published on 14th September 2015


Abstract

Ester-functionalized ionic liquids with different cations (imidazolium, pyrrolidinium, piperidinium, morpholinium) and a bis(trifluoromethanesulfonyl)imide anion were synthesized and subsequently mixed with tetra(ethylene glycol)dimethylether (TEGDME) at different concentrations. The mixed solutions were ultimately investigated for their applicability as the electrolyte in non-aqueous lithium–oxygen batteries. Among the ionic liquids investigated, the pyrrolidinium-based ionic liquid, ethyl-N-methylpyrrolidinium-N-acetate bis(trifluoromethanesulfonyl)imide (MEEsPyr-TFSI), exhibited a lower viscosity, higher ionic conductivity and wider electrochemical stability window than any other ionic liquids. The addition of an appropriate amount of MEEsPyr-TFSI to the TEGDME-based organic electrolyte had a positive effect on the ionic conductivity, electrochemical stability and oxygen radical stability. A mixed ionic liquid-based solution with an optimum composition was successfully employed as a promising electrolyte for lithium–oxygen batteries with good cycling stability.

Introduction

Rechargeable lithium–oxygen batteries that utilize oxygen gas have attracted great interest as next-generation energy storage systems due to their high theoretical specific energy (11[thin space (1/6-em)]140 W h kg−1 when excluding oxygen weight), which exceeds that of any other rechargeable battery system.1–9 A non-aqueous lithium–oxygen battery typically consists of a lithium negative electrode, an organic liquid electrolyte, and a porous carbon positive electrode so as to induce the oxygen electrochemical reaction (2Li + O2 ↔ Li2O2). Among these battery components, the electrolyte has been recognized as one of the greatest challenges facing the successful development of non-aqueous lithium–oxygen batteries.9 While a variety of electrolytes have been proposed for lithium–oxygen batteries so far, none satisfy all of the necessary requirements for stable cycling performance.10–16 Recent studies have suggested that ethers and glymes may be advantageous for use as electrolyte solvents in lithium–oxygen battery applications due to the relatively high stability of ether bonds against the nucleophilic attack of superoxide anion radicals (O2˙) formed as intermediates during the electrochemical reduction of oxygen.3,16–19 Nevertheless, the cycling stability of lithium–oxygen batteries with these electrolytes has not yet reached a satisfactory level due to both electrolyte instability caused by solvent evaporation under semi-open conditions and parasitic reactions between the organic electrolyte and the oxygen reduction species during prolonged cycling. As an alternative electrolyte, ionic liquids provide several potential benefits over conventional organic solvents, including a negligible vapor pressure to prevent solvent evaporation, non-flammability, and high electrochemical stability.20–23 Moreover, ionic liquids can effectively interact with superoxide anion radicals in order to mitigate radical attacks during cycling.24–26 The bulky organic cation in ionic liquid, such as pyrrolidinium and piperidinium, has a soft acidity and thus effectively neutralizes the soft basic superoxide anion radical.26 Without ionic liquid, the nucleophilic attack of O2˙ on the methylene group of ether-based solvents leads to formation of irreversible decomposition products such as Li2CO3, HCO2Li, CH3CO2Li, CO2 and H2O.10 Thus, the capability of ionic liquids to effectively stabilize O2˙ makes them highly desirable to alleviate the decomposition of electrolyte for lithium–oxygen batteries. However, the ionic conductivity of ionic liquid electrolytes is relatively low due to their high viscosity, and both the solubility and diffusion coefficient of oxygen in ionic liquid electrolytes are much lower than in organic electrolytes. Such obstacles prevent the use of unadulterated ionic liquid electrolytes in lithium–oxygen batteries.27,28 Recently, it has been demonstrated that mixed electrolytes composed of organic solvent and ionic liquid could overcome the drawbacks associated with the individual components by combining the useful properties of each constituent.26,29–31 However, research into ionic liquid-based mixed electrolytes for lithium–oxygen batteries is at an early stage and thus, the studies on mixed electrolytes employing new ionic liquids with different structures deserve to be carried out.

In this work, four types of ester-functionalized ionic liquids with different cations (imidazolium, pyrrolidinium, piperidinium, morpholinium) and bis(trifluoromethanesulfonyl)imide anion were synthesized. Their chemical structures are shown in Fig. 1(a). The favorable interaction between ester moieties and lithium salts could improve the electrochemical properties of the resulting electrolytes.32 To solve problems related to the high viscosity of ionic liquids as well as the volatility and irreversible decomposition of organic solvents, attempts were made to mix tetra(ethylene glycol)dimethylether (TEGDME) and the ester-functionalized ionic liquids at different concentrations. With these mixed electrolytes, the lithium–oxygen batteries composed of a lithium negative electrode and carbon positive electrode (without a catalyst) were assembled, and their cycling performance was evaluated. A detailed investigation of the mixed electrolyte composition was conducted in order to develop an optimized electrolyte for lithium–oxygen batteries with good cycling performance.


image file: c5ra13682b-f1.tif
Fig. 1 (a) Chemical structures of the ionic liquids synthesized in this study and (b) 1H NMR spectrum of MEEsPyr-TFSI in acetone-d6.

Experimental

Synthesis and characterization of ionic liquids

Methyl-1-methylimidazolium-3-acetate bis(trifluoromethanesulfonyl)imide (MMEsIm-TFSI), ethyl-N-methylpyrrolidinium-N-acetate bis(trifluoromethanesulfonyl)imide (MEEsPyr-TFSI), ethyl-N-methylpiperidinium-N-acetate bis(trifluoromethanesulfonyl)imide (MEEsPip-TFSI), and ethyl-N-methylmorpholinium-N-acetate bis(trifluoromethanesulfonyl)imide (MEEsMor-TFSI) were synthesized in two steps by reacting alkyl bromoacetate with 1-methylimidazole, N-methylpyrrolidine, N-methylpiperidine, and N-methylmorpholine, respectively, followed by anion exchange with lithium bis(trifluoromethanesulfonyl)imide (LiN(SO2CF3)2, LiTFSI). A representative synthesis procedure for MEEsPyr-TFSI is as follows. N-Methylpyrrolidine (17.0 g, 0.2 mol) was dissolved in a 250 mL round-bottomed flask containing acetonitrile. Ethyl bromoacetate (36.7 g, 0.22 mol) was then slowly added to the above solution under vigorous stirring in a nitrogen atmosphere. After allowing the components to react at 40 °C for 2 h, white precipitates were collected, washed with acetone, and dried under vacuum to obtain MEEsPyr-Br (46.9 g, 93%). MEEsPyr-Br (25.2 g, 0.1 mol) was dissolved in a 250 mL round bottomed flask containing CH2Cl2 (100 mL), and then reacted with LiTFSI (28.7 g, 0.1 mol) for 8 h in a nitrogen atmosphere. After filtration of the precipitated LiBr, the filtrate was washed with water to remove dissolved LiBr and treated with Na2SO4. The resulting solution was subjected to filtration and then dried under vacuum to obtain MEEsPyr-TFSI (43.1 g, 96%). Its chemical structure was confirmed by 1H NMR spectroscopy data acquired with a 400 MHz Bruker NMR spectrometer using acetone-d6 as the solvent; its 1H NMR spectrum is shown in Fig. 1(b). 1H NMR (400 MHz, acetone-d6, 25 °C): δ (ppm) = 5.32 (s, 2H, N–CH2–CO), 4.25 (q, 2H, O–CH2–C), 3.59–3.90 (m, 4H, N–CH2–C), 3.27 (s, 3H, N–CH3), 2.25 (m, 4H, C–CH2–C), 1.32 (t, 3H, C–CH3). The NMR spectra of other ionic liquids and their respective peak assignments are presented in Fig. S1–S3 of the ESI.

Preparation of mixed electrolytes

All of the synthesized ionic liquids were used after vacuum drying at 100 °C for 24 h, followed by drying with pre-dried 4 Å molecular sieves for several days. The water content in the ionic liquids, as determined by Karl Fischer titration conducted with a Mettler-Toledo Coulometer, was less than 20 ppm. Anhydrous grade TEGDME was purchased from Sigma Aldrich Co. and used after drying with 4 Å molecular sieves. LiTFSI salt (battery grade) was purchased from PANAX ETEC Co. Ltd and used after drying overnight under vacuum at 100 °C. The ionic liquid-based mixed electrolytes were prepared by adding 0.2 M LiTFSI to blended solutions of TEGDME and an ionic liquid. A low salt concentration was used to prepare the mixed electrolytes, as higher amounts of salt increased the viscosity, which in turn reduced the ionic conductivity due to an increase in ionic interactions within the solution.30,33 The contents of ionic liquid in the mixed solutions were 0, 25, 50, 75 and 100% based on volume. The mixed electrolyte systems will be abbreviated as IMI-N, PYR-N, PIP-N, and MOR-N, where N is the volumetric percent of ionic liquid in the mixed electrolyte solutions, and IMI, PYR, PIP and MOR represent type of ionic liquids, i.e., MMEsIm-TFSI, MEEsPyr-TFSI, MEEsPip-TFSI, and MEEsMor-TFSI, respectively.

Electrode preparation and cell assembly

The carbon-based positive electrode was prepared by casting an N-methyl-pyrrolidone (NMP)-based slurry containing Ketjen black EC600JD and a poly(vinylidene fluoride) (PVDF, Solvay) binder (9[thin space (1/6-em)]:[thin space (1/6-em)]1 by weight) onto a gas diffusion layer (SGL GROUP, 35BC, Germany). The electrode was then dried in a vacuum oven for 12 h at 110 °C so as to remove residual NMP. The geometrical area of the carbon positive electrode was 1.13 cm2, and the carbon loading in the positive electrode was about 1.0 mg cm−2. The negative electrode consisted of lithium metal (Honjo Metal Co. Ltd, 200 μm) that was pressed onto a copper current collector. A lithium–oxygen cell comprising a lithium negative electrode, glass microfiber filter paper (Whatman grade GF/D), and a carbon positive electrode was assembled with the mixed electrolytes into a custom-designed Swagelok-type cell fabricated from Teflon, as reported in previous work.16 All cells were assembled in an argon-filled glove box where the H2O and O2 contents were kept below 1 ppm.

Characterization and measurements

Viscosity measurements of the mixed electrolytes were performed using a viscometer (RheoSense, microvisc, USA) at 25 °C. The ionic conductivities of the mixed electrolytes were measured with a Cond 3210 conductivity meter (WTW GmbH, Germany) at 25 °C. To measure the ionic conductivity of the solid electrolyte (MEEsMor-TFSI), AC impedance measurements were performed using an impedance analyzer over a frequency range of 10 Hz to 100 kHz with an amplitude of 10 mV. The ionic conductivity (σ) was then calculated from the impedance data, using the relation σ = t/RbA, where t and A are the thickness and area of the solid electrolyte, and Rb was bulk resistance measured from the AC impedance spectrum. The lithium transference number was measured at 25 °C by a combination of AC impedance and DC polarization methods.34 The electrochemical stability of the mixed electrolyte was determined with linear sweep voltammetry (LSV) measured on a platinum working electrode, lithium metal counter electrode and reference electrodes at a scanning rate of 1.0 mV s−1. For the cycling tests, the assembled cell was placed in a chamber filled with high-purity oxygen gas at a pressure slightly higher than 1.0 atm. Charge and discharge cycling tests of the lithium–oxygen cells were then performed with battery testing equipment (WBCS 3000, Wonatech) at 25 °C. Charge and discharge curves were recorded galvanostatically at a constant current rate of 100 mA gcarbon−1 within a limited capacity of 500 mA h gcarbon−1 in the voltage range of 2.0 to 4.7 V. The mass of Ketjen black was considered as the active material loading in the positive electrode. The morphologies of the carbon electrodes were examined using field-emission scanning electron microscopy (FE-SEM, HITACHI S-4800) after rinsing with dimethyl carbonate (DMC) so as to remove residual electrolyte. X-ray photoelectron spectroscopy (XPS) data were acquired with an ESCA 2000 spectrometer (Thermo VG Scientific) after washing with DMC and ethyl alcohol.

Results and discussion

In order to optimize the composition of the mixed electrolytes with different ionic liquids, the effect of the ionic liquid content on both the viscosity and ionic conductivity of the mixed electrolytes was investigated; the results are shown in Fig. 2. Note that MEEsMor-TFSI is solid at room temperature and thus, its viscosity could not be measured. The ionic conductivity of MEEsMor-TFSI could be determined for a solid-state pellet. As shown in Fig. 2(a), the viscosity of the mixed electrolytes increased significantly at higher ionic liquid contents due to an increase in ion–solvent interactions and coulombic interactions between ionic species. Among the mixed electrolytes investigated in this study, the electrolyte solution prepared with MEEsPyr-TFSI had the lowest viscosity at same ionic liquid content. The ionic conductivities of the mixed electrolytes as a function of ionic liquid content are shown in Fig. 2(b). The ionic conductivity initially increased with increasing ionic liquid content, reaching a maximum at 25 vol%. Because the ionic liquid itself has many cations and anions, the number of ions in the electrolyte solution increased with an addition of ionic liquid. Consequently, the ionic conductivity initially increased with the ionic liquid content. However, further addition of ionic liquid decreased the ionic conductivity of the mixed electrolytes, because the reduction in ionic mobility due to the increased viscosity became more significant than the increase in the number of free ions arising from ionic liquid addition. It should be noted that the ions in ionic liquid do not participate in the electrochemical reaction in the lithium–oxygen cells. Thus the lithium transference number was measured to examine the relative contribution of lithium ion conductivity (σLi+) in the mixed electrolyte. As shown in Fig. 2(c), the lithium transference number was gradually decreased with ionic liquid content. This result can be ascribed to the decrease in relative molar ratio of lithium cations to total ions with increasing ionic liquid content. Lithium ion conductivity estimated from ionic conductivity and lithium transference number was the highest at 25 vol%, as depicted in Fig. 2(d). These results imply that a proper amount of ionic liquid should be maintained to achieve both low viscosity and high lithium ionic conductivity in the mixed electrolytes. Among the various mixed electrolyte compositions, PYR-25 exhibited the highest lithium ion conductivity at ambient temperature.
image file: c5ra13682b-f2.tif
Fig. 2 (a) Viscosities, (b) ionic conductivities, (c) lithium transference number and (d) lithium ionic conductivities of the mixed electrolytes composed of different ionic liquids and TEGDME as a function of the ionic liquid content. MEEsMor-TFSI is solid at room temperature and thus, its viscosity could not be measured.

The electrochemical stability of the various electrolytes was investigated in the absence of oxygen. Linear sweep voltammetry curves obtained for the mixed electrolytes containing 25 vol% ionic liquid are shown in Fig. 3. In the case of the IMI-25 electrolyte system, the cathodic current starts to increase around 1.5 V vs. Li/Li+ prior to the reductive deposition of lithium (i.e., Li+ + e → Li), which corresponds to reductive decomposition of the MMEsIm cation. This result is consistent with the previous report that imidazolium-based ionic liquids are not stable against reduction at lithium deposition potentials.35,36 Such instability arises from imidazolium reduction due to the presence of three acidic protons on the ring. As evident from the anodic scan shown in Fig. 3(b), the oxidative stability of the mixed electrolytes increased in the order of IMI-25 < MOR-25 < PIP-25 < PYR-25. From these results, it was concluded that the mixed electrolyte based on MEEsPyr-TFSI has the largest electrochemical stability window. The effect of the ionic liquid content on the electrochemical stability was examined for the mixed electrolytes containing MEEsPyr-TFSI; the results are shown in Fig. 4. The absence of reduction peaks before lithium plating indicates that all mixed electrolytes containing MEEsPyr-TFSI are reductively stable up to 0 V vs. Li/Li+. A decrease in both the reductive potential and current for lithium deposition in the pure ionic liquid electrolyte (i.e., PYR-100) was associated with increased ionic resistance. In the anodic scan depicted in Fig. 4(b), the oxidation potential increased slightly with MEEsPyr-TFSI content in the mixed electrolytes, which demonstrates that adding MEEsPyr-TFSI to the organic electrolyte increases the anodic stability of the electrolyte solution.


image file: c5ra13682b-f3.tif
Fig. 3 Linear sweep voltammograms of the mixed electrolytes composed of 25 vol% ionic liquid and 75 vol% TEGDME: (a) cathodic scan and (b) anodic scan (scan rate: 1 mV s−1, temperature: 25 °C).

image file: c5ra13682b-f4.tif
Fig. 4 Linear sweep voltammograms of the mixed electrolytes containing different contents of MEEsPyr-TFSI: (a) cathodic scan and (b) anodic scan (scan rate: 1 mV s−1, temperature: 25 °C).

The full discharge and charge behavior of lithium–oxygen cells assembled with different electrolyte solutions was examined at constant current densities of 0.1 mA cm−2 (100 mA g−1). Fig. 5(a) shows the first discharge and charge curves of lithium–oxygen cells assembled with mixed electrolytes containing different amounts of MEEsPyr-TFSI, which were obtained from cycling within a cut-off voltage of 2.0–4.7 V. The content of ionic liquid clearly affected the initial cycling characteristics, and the cell with PYR-25 exhibited the highest discharge capacity among the cells investigated. Such a result can be ascribed to the combined effects of the low viscosity of TEGDME and the good wettability and electrochemical stability of MEEsPyr-TFSI in the mixed electrolyte. The addition of MEEsPyr-TFSI to the organic electrolyte makes the electrolyte solution more hydrophobic, allowing it to effectively wet the hydrophobic carbon positive electrodes. It is notable that the cell assembled with PYR-25 exhibited a much higher coulombic efficiency than the organic electrolyte (PYR-0)-based cell. As reported in previous literature, the pyrrolidinium cation in MEEsPyr-TFSI is weakly acidic and thus, it effectively neutralizes weakly basic O2˙.26,37 These interactions protect the electrolyte solution from superoxide radical attack and improve the reversibility of the oxygen reduction reaction (ORR)/oxygen evolution reaction (OER) when compared to unadulterated organic electrolyte. Further addition of ionic liquid above 25 vol% decreased the initial discharge capacity. Such a result can be ascribed to the high viscosity of the ionic liquid as well as the low diffusivity and solubility of O2 in the ionic liquid.38 These results indicate that mixing an ionic liquid with an organic solvent under optimal conditions improves the cycling performance of a Li–oxygen cell when compared to the use of an organic electrolyte or ionic liquid electrolyte alone, as each component compensates for the drawbacks of the other. These synergistic effects serve to enhance the cycling performance of Li–oxygen cell. Based on the obtained results, it was concluded that the optimum amount of ionic liquid was 25 vol% and thus, the ionic liquid content was maintained at this level in subsequent experiments. Fig. 5(b) shows the initial cycling curves of lithium–oxygen cells assembled with mixed electrolytes containing 25 vol% ionic liquid. The cell with PYR-25 exhibited a larger discharge capacity (9030 mA h g−1, where the specific capacity is defined per gram of Ketjen black carbon) and higher coulombic efficiency than any of the other cells. These findings support the facile formation of Li2O2 during the oxygen reduction reaction and its reversible decomposition via the oxygen evolution reaction in the cell with a mixed electrolyte containing MEEsPyr-TFSI, which can be attributed to the high lithium ion conductivity, low viscosity for fast O2 diffusion, and high electrochemical stability of the electrolyte, as discussed above.


image file: c5ra13682b-f5.tif
Fig. 5 Initial discharge and charge curves of lithium–oxygen cells assembled with (a) mixed electrolytes containing different contents of MEEsPyr-TFSI and (b) mixed electrolytes composed of 25 vol% ionic liquid and 75 vol% TEGDME. The cells were fully cycled between 2.0 to 4.7 V at a constant current density of 0.1 mA cm−2 (100 mA g−1).

In order to verify the reversible formation and decomposition of Li2O2 at the carbon electrode in the presence of the ionic liquid, XPS analysis was performed. Fig. 6(a) and (b) show the Li 1s XPS spectra of the carbon electrode cycled in different electrolytes, which were obtained in the fully discharged and fully charged states, respectively. As shown in Fig. S4, the Li 1s peaks could be resolved into main Li2O2 peak (54.7 eV) and minor Li2CO3 peak (55.5 eV), which are well consistent with binding energies reported in the previous literature.39–41 Yao et al. reported that LiOH was also observed with Li2CO3 at around 55.4 eV, because the binding energy of the LiOH was almost same to that of Li2CO3.40 In our study, however, it is likely that the peak appeared at 55.5 eV is mainly corresponding to Li2CO3, since most of LiOH can be removed by washing with organic solvents (DMC and ethyl alcohol) prior to XPS analysis. During the discharge process, the superoxide anion radials may attack the alkylene group adjacent to the ether bond, cause its irreversible decomposition into CO2 or carbonate groups that in turn form Li2CO3 by reacting with Li2O2 formed on the carbon electrode, as previously reported.10,38,42 It is evident that the intensity of the peak corresponding to Li2O2 after the discharge cycle was the highest at 25 vol%, and then decreased with further addition of ionic liquid. This result suggests that excessive addition of ionic liquid into the organic electrolyte retard the oxygen reduction reaction, which is consistent with the cycling results in Fig. 5(a). After the charging cycle, the Li2O2 peak was barely visible and could not be detected in the mixed electrolyte containing ionic liquid, regardless of the ionic liquid content. Such a finding indicates that all discharge products were fully decomposed, and confirms the reversible decomposition of Li2O2 in ionic liquid-containing electrolyte media. In contrast, the Li2O2 peak at 54.7 eV was still present on the carbon electrode charged in the TEGDME-based organic electrolyte (i.e., PYR-0), as shown in Fig. S4(f). This result can be attributed to the absence of MEEsPyr-TFSI in the electrolyte solution, as the pyrrolidinium cation can stabilize O2˙ species that formed during the electrochemical process. Consequently, electrolyte decomposition takes place in the electrolyte without MEEsPyr-TFSI. It is thus concluded that Li2O2 formation and decomposition during the discharge and charge cycles occur most favorably in the mixed electrolyte containing 25 vol% MEEsPyr-TFSI. To further validate the reversible electrochemical process at the carbon electrode in the PYR-25-based cell, SEM images of a carbon electrode were obtained for a cell in its pristine state, after fully discharged state, and after fully charged state. Fig. 7(a) shows the individual carbon particles of Ketjen black in its pristine state. After complete discharge, reaction products were deposited onto the carbon particles of the electrode, as shown in Fig. 7(b). Such products are believed to be associated with the formation of Li2O2. After the recharging cycle, the particles in the carbon electrode looked very similar to those of the pristine electrode, indicating that all discharge products were fully decomposed, which confirms the reversible formation and decomposition of Li2O2 during cycling.


image file: c5ra13682b-f6.tif
Fig. 6 Li 1s XPS spectra of the carbon electrodes employing different electrolytes (a) in the fully discharged state at 2.0 V and (b) in the fully charged state at 4.7 V.

image file: c5ra13682b-f7.tif
Fig. 7 SEM images of carbon electrodes cycled in the PYR-25 electrolyte (a) before discharge (pristine), (b) in the fully discharged state at 2.0 V, and (c) in the fully charged state at 4.7 V.

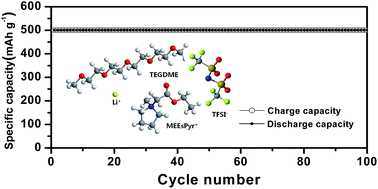
To prevent insulating discharge products from accumulating at the carbon positive electrode, the capacity utilization was limited to 500 mA h g−1 in the cut-off voltage range 2.0 to 5.0 V, since deep discharge conditions can result in poor cycling performance once the accumulation of insulating discharge products impedes the transport of lithium ions, oxygen gas, and electrons to the electrochemical interface.43,44 The cell was cycled at a constant current density of 0.1 mA cm−2 (100 mA g−1), which corresponds to a rate of 0.2C. Fig. S5 shows the discharge and charge curves of lithium–oxygen cells assembled with different electrolytes. The polarization for the charge and discharge cycles gradually increased with cycle number. The increased polarization can be attributed to partial electrolyte depletion and the gradual accumulation of irreversible products generated from electrolyte decomposition with prolonged cycling.45 It should be noted that the cell employing pure ionic liquid electrolyte (i.e., PYR-100) delivered a discharge capacity lower than 500 mA h g−1 at 25th cycle, which arises from the large overpotential. Among the cells investigated, the cell assembled with PYR-25 exhibited the lowest overpotential and the best cycling stability, which is not surprising considering the electrochemical characteristics of PYR-25 and full cycling behavior of the lithium–oxygen cell assembled with PYR-25. The cell exhibited good charge–discharge cycling stability with a coulombic efficiency of 100% through 100 cycles, as depicted in Fig. 8. The improved cycling performance observed with the addition of a proper amount of MEEsPyr-TFSI can be ascribed to its high ionic conductivity, suppression of solvent evaporation and protection of the electrolyte solution from superoxide radical attack during cycling. Fig. S6 compares the SEM images of carbon electrodes, which were obtained for a cell in its pristine state, after the 1st and 100th discharge cycle. After the 1st cycle, the discharge products are evenly deposited on carbon particles. In contrast, the carbon electrode was covered with relatively thick surface layer after 100 cycles, indicating that the electrochemical removal of the discharge products becomes more difficult as the cycling progresses. An increase of overpotential with the repeated cycling shown in Fig. 8(a) may be attributed to the inability to oxidize the non-conducting discharge product Li2O2 accumulatively deposited in the pores of the electronic active carbon electrode, which blocks the transport of lithium ions, oxygen and electrons to the electrochemical reaction sites. Thus, more systematic studies on the characteristics of the carbon electrode, such as porosity, electrode composition, the type of active carbon material and current collector should be performed to further improve the cycling performance of lithium–oxygen cells with optimized ionic liquid-based electrolytes.


image file: c5ra13682b-f8.tif
Fig. 8 (a) Discharge and charge curves of lithium–oxygen cells assembled with PYR-25 electrolyte at a constant current density of 0.1 mA cm−2 (100 mA g−1); the capacity utilization was limited to 500 mA h g−1. (b) Discharge and charge capacities as a function of the cycle number. Carbon loading in the carbon electrode was 1.0 mg cm−2.

Conclusions

Various types of ionic liquids containing ester moieties were synthesized and mixed with TEGDME so as to yield an electrolyte solution with a high ionic conductivity and low viscosity. Among the tested electrolyte compositions, the mixed electrolyte containing 25 vol% MEEsPyr-TFSI exhibited the highest ionic conductivity and good electrochemical stability. The presence of MEEsPyr-TFSI in the electrolyte mitigated electrolyte decomposition by superoxide anion radical attack, thereby allowing for the reversible formation and decomposition of Li2O2 as well as enhanced cycling stability in the lithium–oxygen cell. Based on the obtained results, the electrolyte containing MEEsPyr-TFSI is proposed as a suitable medium for application in high energy density lithium–oxygen batteries with good cycling stability.

Acknowledgements

This work was supported by the Hyundai Motor Company and the Energy Efficiency & Resources Core Technology Program of the Korea Institute of Energy Technology Evaluation and Planning (KETEP), the latter of which was granted financial resources from the Ministry of Trade, Industry & Energy, Republic of Korea (No. 20112020100110/KIER B5-2592).

References

  1. K. M. Abraham and Z. Jiang, J. Electrochem. Soc., 1996, 143, 1 CrossRef CAS PubMed.
  2. P. G. Bruce, S. A. Freunberger, L. J. Hardwick and J.-M. Tarascon, Nat. Mater., 2012, 11, 19 CrossRef CAS PubMed.
  3. H. G. Jung, J. Hassoun, J. B. Park, Y. K. Sun and B. Scrosati, Nat. Chem., 2012, 4, 579 CrossRef CAS PubMed.
  4. Z. Q. Peng, S. A. Freunberger, Y. H. Chen and P. G. Bruce, Science, 2012, 337, 563 CrossRef CAS PubMed.
  5. F. Cheng and J. Chen, Chem. Soc. Rev., 2012, 41, 2172 RSC.
  6. R. Black, B. Adams and L. F. Nazar, Adv. Energy Mater., 2012, 2, 801 CrossRef CAS PubMed.
  7. Y. C. Lu, B. M. Gallant, D. G. Kwabi, J. R. Harding, R. R. Mitchell, M. S. Whittingham and Y. Shao-Horn, Energy Environ. Sci., 2013, 6, 750 CAS.
  8. Z. L. Jian, P. Liu, F. J. Li, P. He, X. W. Guo, M. W. Chen and H. S. Zhou, Angew. Chem., Int. Ed., 2014, 53, 442 CrossRef CAS PubMed.
  9. J. Lu, L. Li, J. B. Park, Y. K. Sun, F. Wu and K. Amine, Chem. Rev., 2014, 114, 5611 CrossRef CAS PubMed.
  10. S. A. Freunberger, Y. Chen, N. E. Drewett, L. J. Hardwick, F. Barde and P. G. Bruce, Angew. Chem., Int. Ed., 2011, 50, 8609 CrossRef CAS PubMed.
  11. G. M. Veith, N. J. Dudney, J. Howe and J. Nanda, J. Phys. Chem. C, 2011, 115, 14325 CAS.
  12. J. Xiao, J. Hu, D. Wang, D. Hu, W. Xu, G. L. Graff, Z. Nie, J. Liu and J. G. Zhang, J. Power Sources, 2011, 196, 5674 CrossRef CAS PubMed.
  13. B. D. McCloskey, D. S. Bethune, R. M. Shelby, G. Girishkumar and A. C. Luntz, J. Phys. Chem. Lett., 2011, 2, 1161 CrossRef CAS PubMed.
  14. J. R. Harding, Y. C. Lu, Y. Tsukada and Y. Shao-Horn, Phys. Chem. Chem. Phys., 2012, 14, 10540 RSC.
  15. G. M. Veith, J. Nanda, L. H. Delmau and N. J. Dudney, J. Phys. Chem. Lett., 2012, 3, 1242 CrossRef CAS PubMed.
  16. S. M. Han, J. H. Kim and D. W. Kim, J. Electrochem. Soc., 2014, 161, A856 CrossRef CAS PubMed.
  17. C. O. Laoire, S. Mukerjee, E. J. Plichta, M. A. Hendrickson and K. M. Abraham, J. Electrochem. Soc., 2011, 158, A302 CrossRef CAS PubMed.
  18. R. Black, S. H. Oh, J.-H. Lee, T. Yim, B. Adams and L. F. Nazar, J. Am. Chem. Soc., 2012, 134, 2902 CrossRef CAS PubMed.
  19. M. Marinaro, S. Theil, L. Joerissen and M. Wohlfahrt-Mehrens, Electrochim. Acta, 2013, 108, 795 CrossRef CAS PubMed.
  20. C. J. Allen, S. Mukerjee, E. J. Plichta, M. A. Hendrickson and K. M. Abraham, J. Phys. Chem. Lett., 2011, 2, 2420 CrossRef CAS.
  21. M. Kar, T. J. Simons, M. Forsyth and D. R. MacFarlane, Phys. Chem. Chem. Phys., 2014, 16, 18658 RSC.
  22. G. A. Elia, J. Hassoun, W.-J. Kwak, Y.-K. Sun, B. Scrosati, F. Mueller, D. Bresser, S. Passerini, P. Oberhumer, N. Tsiouvaras and J. Reiter, Nano Lett., 2014, 14, 6572 CrossRef CAS PubMed.
  23. G. A. Elia, R. Bernhard and J. Hassoun, RSC Adv., 2015, 5, 21360 RSC.
  24. F. de Giorgio, F. Soavi and M. Mastragostino, Electrochem. Commun., 2011, 13, 1090 CrossRef CAS PubMed.
  25. C. J. Allen, J. Hwang, R. Kautz, S. Mukerjee, E. J. Plichta, M. A. Hendrickson and K. M. Abraham, J. Phys. Chem. C, 2012, 116, 20755 CAS.
  26. B. G. Kim, J. N. Lee, D. J. Lee, J. K. Park and J. W. Choi, ChemSusChem, 2013, 6, 443 CrossRef CAS PubMed.
  27. C. O. Laoire, S. Mukerjee and K. M. Abraham, J. Phys. Chem. C, 2009, 113, 20127 CAS.
  28. Y. Li, J. Wang, X. Li, D. Geng, M. N. Banis, R. Li and X. Sun, Electrochem. Commun., 2012, 18, 12 CrossRef CAS PubMed.
  29. S. Ferrari, E. Quartarone, C. Tomasi, M. Bini, P. Galinetto, M. Fagnoni and P. Mustarelli, J. Electrochem. Soc., 2015, 162, A3001 CrossRef CAS PubMed.
  30. S. M. Han, J. H. Kim and D. W. Kim, J. Electrochem. Soc., 2015, 162, A3103 CrossRef CAS PubMed.
  31. L. Cecchetto, M. Salomon, B. Scrosati and F. Croce, J. Power Sources, 2012, 213, 233 CrossRef CAS PubMed.
  32. J. S. Lee, N. D. Quan, J. M. Hwang, J. Y. Bae, H. Kim, B. W. Cho, H. S. Kim and H. Lee, Electrochem. Commun., 2006, 8, 460 CrossRef CAS PubMed.
  33. A. Guerfi, M. Dontigny, P. Charest, M. Petitclerc, M. Lagace, A. Vijh and K. Zaghib, J. Power Sources, 2010, 195, 845 CrossRef CAS PubMed.
  34. J. Evance, C. A. Vincent and P. G. Bruce, Polymer, 1987, 28, 2324 CrossRef.
  35. P. Bonhote, A. P. Dias, M. Armand, N. Papageorgiou, K. Kalyanasundaram and M. Gratzel, Inorg. Chem., 1996, 35, 1168 CrossRef CAS PubMed.
  36. B. Garcia, S. Lavallee, G. Perron, C. Michot and M. Armand, Electrochim. Acta, 2004, 49, 4583 CrossRef CAS PubMed.
  37. J. Herranz, A. Garsuch and H. A. Gasteiger, J. Phys. Chem. C, 2012, 116, 19084 CAS.
  38. W. Xu, J. Hu, M. H. Engelhard, S. A. Towne, J. S. Hardy, J. Xiao, J. Feng, M. Y. Hu, J. Zhang, F. Ding, M. E. Gross and J.-G. Zhang, J. Power Sources, 2012, 215, 240 CrossRef CAS PubMed.
  39. B. G. Kim, H. J. Kim, S. Back, K. W. Nam, Y. Jung, Y. K. Han and J. W. Choi, Sci. Rep., 2014 DOI:10.1038/srep04225.
  40. K. P. C. Yao, D. G. Kwabi, R. A. Quinlan, A. N. Mansour, A. Grimaud, Y.-L. Lee, Y.-C. Lu and Y. S. Horn, J. Electrochem. Soc., 2013, 160, A824 CrossRef CAS PubMed.
  41. L. Cheng, E. J. Crumlin, W. Chen, R. Qiao, H. Hou, S. F. Lux, V. Zorba, R. Russo, R. Kostecki, Z. Liu, K. Persson, W. Yang, J. Cabana, T. Richardson, G. Chen and M. Doeff, Phys. Chem. Chem. Phys., 2014, 16, 18294 RSC.
  42. S. A. Freunberger, Y. H. Chen, Z. Q. Peng, J. M. Griffin, L. J. Hardwick, F. Barde, P. Novak and P. G. Bruce, J. Am. Chem. Soc., 2011, 133, 8040 CrossRef CAS PubMed.
  43. T. Ogasawara, A. Debart, M. Holzapfel, P. Novak and P. G. Bruce, J. Am. Chem. Soc., 2006, 128, 1390 CrossRef CAS PubMed.
  44. M. J. Trahan, S. Mukerjee, E. J. Plichta, M. A. Hendrickson and K. M. Abraham, J. Electrochem. Soc., 2013, 160, A259 CrossRef CAS PubMed.
  45. B. Sun, B. Wang, D. Su, L. Xiao, H. Ahn and G. Wang, Carbon, 2012, 50, 727 CrossRef CAS PubMed.

Footnote

Electronic supplementary information (ESI) available: NMR spectra of MMEsIm-TFSI, MEEsPip-TFSI, and MEEsMor-TFSI. XPS Li 1s spectra of the fully discharged carbon electrodes, cycling curves and discharge capacities of lithium–oxygen cells assembled with different electrolytes, SEM images of the carbon electrodes obtained after the 1st and 100th cycle. See DOI: 10.1039/c5ra13682b

This journal is © The Royal Society of Chemistry 2015
Click here to see how this site uses Cookies. View our privacy policy here.