DOI:
10.1039/C5RA13579F
(Paper)
RSC Adv., 2015,
5, 91094-91102
Visible-light-driven Bi2O3/WO3 composites with enhanced photocatalytic activity†
Received
10th July 2015
, Accepted 19th October 2015
First published on 19th October 2015
Abstract
Semiconductor heterojunctions (composites) have been shown to be effective photocatalytic materials to overcome the drawbacks of low photocatalytic efficiency that results from electron–hole recombination and narrow photo-response range. A novel visible-light-driven Bi2O3/WO3 composite photocatalyst was prepared by hydrothermal synthesis. The composite was characterized by scanning transmission electron microscopy (STEM), scanning electron microscopy (SEM), powder X-ray diffraction (PXRD), X-ray photoelectron spectroscopy (XPS), Brunauer–Emmett–Teller (BET) surface area, Raman spectroscopy, photoluminescence spectroscopy (PL) and electrochemical impedance spectroscopy (EIS) to better understand the structures, compositions, morphologies and optical properties. Bi2O3/WO3 heterojunction was found to exhibit significantly higher photocatalytic activity towards the decomposition of Rhodamine B (RhB) and 4-nitroaniline (4-NA) under visible light irradiation compared to that of Bi2O3 and WO3. A tentative mechanism for the enhanced photocatalytic activity of the heterostructured composite is discussed based on observed activity, band position calculations, photoluminescence, and electrochemical impedance data. The present study provides a new strategy for the design of composite materials with enhanced visible light photocatalytic performance.
1. Introduction
Semiconductor-based photocatalysis is receiving a tremendous amount of interest as a promising green technology for both renewable energy production and environmental remediation.1 After the discovery of titanium dioxide (TiO2) as an ultraviolet light active photocatalyst for water splitting and degradation of organic compounds in the early 1970's, many other semiconductors have been studied as promising materials for energy generation and environmental applications.2 Nevertheless, most semiconductors studied as photocatalysts have wide band gaps, thus UVs, which represents only 5% of solar radiation, is required for the generation of electron–hole pairs necessary for redox processes at the surface of the semiconductors. The ideal photocatalyst should function in the visible light region with band gaps less than 3 eV to maximize the use of solar light.3 Thus, significant efforts have been made to develop new or modified semiconductor photocatalysts that are visible-light active. The common band gap engineering approach involves metal and/or non-metal doping.4–6 In most cases, doping tunes the band edge potentials of parent material to enhance visible light absorption efficiency. However, doping was found to affect the catalytic activity under visible light and/or UV light due to the introduction of extra energy levels in doped material, which serve as electron/hole recombination sites.7 In addition to doping, several strategies are described in the literature to inhibit charge carrier recombination.5,8 One of the most common approaches is to intimately combine two suitable semiconductors to form composites also referred to as heterojunctions. Composite photocatalysts were introduced to maximize life-time of the photogenerated electron–hole charge carriers (i.e. minimize recombination rate) as well as maximize visible light activity. In general, it is believed that properly designed heterostructured systems can be used to separate the photogenerated electron–hole pairs, thus reducing their recombination rate and increasing their lifetime so they can diffuse to the surface and be effectively involved in redox processes.9
In this context, tungsten oxide (WO3) has attracted considerable attention for use in different energy conversion devices due to its low band gap, high resistance against photo-corrosion and good chemical stability in a wide pH range under solar illumination.10–14 However, WO3 exhibits poor photocatalytic activity under visible light due to its rapid electron–hole pair recombination.15,16 To improve its photocatalytic activity, several approaches have been employed such as noble metal deposition and fabrication of composite photocatalysts by coupling other semiconductors with WO3.17–20 Similarly, bismuth oxide (Bi2O3), another important semiconductor, has recently captured considerable attention due to its visible light activity, high refractive index, dielectric permittivity, and thermal stability. It has suitable band positions for water oxidation and has proved to be an excellent sensitizer to enhance visible light activity of both UV and visible light active photocatalysts.21 The method for constructing heterostructured composites using bismuth oxide as a sensitizer has previously been demonstrated as an effective way to reduce photogenerated charge carrier recombination rate, as well as optical response extension towards visible light.22–27 Furthermore, the bismuth tungstate, Bi2WO6 which is formed by heating a mixture of Bi2O3 and WO3 in a 1/1 molar ratio at temperatures higher than 900 °C was also reported to have good photocatalytic properties.28,29 Taking this into account, a composite of WO3 coated with Bi2O3 served as the basis for this study. Since WO3 and Bi2O3 are both visible light driven photocatalysts, the Bi2O3/WO3 composite was explored as a candidate for efficient photocatalytic activity under visible light.
In this work, a novel visible light active Bi2O3/WO3 composite was synthesized using a hydrothermal process. The 1/1 molar ratio was chosen with the rational that upon heating at higher temperature, Bi2WO6 will be obtained and its photocatalytic properties can then be studied. The photocatalysts were characterized by PXRD, TGA/DSC, STEM, SEM-EDS, TEM, DRS, Raman, PL, EIS, and BET. Their photocatalytic performance was evaluated using the photocatalytic reduction of 4-nitroaniline (4-NA), and degradation of Rhodamine B (RhB) under visible light (λ ≥ 420 nm). The heterostructured composite photocatalysts showed superior activity compared to pristine tungsten oxide, bismuth oxide, and ternary bismuth tungstate. A possible mechanism for the enhancement of photocatalytic activity of Bi2O3/WO3 composite is proposed using band position calculations, electrochemical impedance, and photoluminescence data.
2. Experimental section
2.1 Synthesis
2.1.1 Reagents.
All chemicals used were analytical grade reagents and were used as received: sodium tungstate (Na2WO4·2H2O, 99.7%, J.T. Baker Chemicals, USA), bismuth nitrate (Bi(NO3)3·5H2O, 99%, Johnson Matthey Electronics, USA), hexadecyl-trimethyl ammonium bromide (CTAB, 98%, Alfa Aesar, UK), ethylene glycol (C2H6O2, EG, >95%, Fisher Scientific, USA), glycerol (C3H8O3, 99.5%, Fisher Scientific, USA), hydrochloric acid (HCl, Fisher Scientific, USA), and pure ethanol (Pharmaco-AAPER, USA).
2.1.2 Synthesis of WO3 nanoparticles.
WO3 nanoparticles were prepared according to a previously reported method with some modifications.30 In a typical procedure, 1.0 g (3.03 mmol) of Na2WO4·2H2O was dissolved in 10 mL of distilled water. 0.25 g (0.68 mmol) of CTAB was added to 5 mL of distilled water to make a clear solution. Subsequently, the two solutions were combined to obtain a clear solution. A yellow dispersion was formed after conc. HCl (3 mL) was added dropwise under constant magnetic stirring for 30 min. The yellow slurry was heated at 70 °C for 3 hours to obtain a yellow solid which was filtered, washed with deionized water and ethanol before drying under vacuum at 60 °C. The final dry mass was calcined at 400 °C for 4 hours to obtain pure WO3 nanoparticles as confirmed by PXRD.
2.2 Characterization
Bi2O3, WO3, Bi2O3/WO3 composite, and Bi2WO6, compounds were characterized by powder X-ray diffraction (PXRD) using a Bruker D8 diffractometer equipped with CuKα radiation (λ = 1.5418 Å) in the range of 2θ = 10–60°. The morphologies and structures of the obtained samples were determined with an SEM using a Hitachi S-4800 FEG-SEM at 5 kV and a scanning transmission electron microscope (STEM, JEOL 2200-FS) with aberration corrected at 200 kV. The chemical composition of the samples was determined by an X-ray energy dispersion spectrometer (EDS, Bruker X-Flash, 30 mm2 SDD) attached to the STEM. X-ray photoelectron spectroscopy (XPS) was performed using a Perkin Elmer PHI 570 ESCA/SAM System with an Al Kα source operating at 15 kV and 300 W power output to probe the elemental composition of the surface. Diffuse reflectance UV-vis spectra were collected on a Cary 5000 instrument equipped with a praying mantis kit in the range of 200 to 800 nm. Differential scanning calorimetry (DSC) and thermogravimetric analysis (TGA) were performed on a SDT-Q600 (TA instrument, USA) from 32–1000 °C under air flow and heating rate of 10 °C min−1. Nitrogen adsorption–desorption isotherms at 77 K were investigated using an autosorb-iQ instrument from Quantachrome. Raman scattering was collected on a triple Raman spectrometer (Princeton Instruments Acton Trivista-555) customized with an ellipsoidal mirror and directed by a fiber optics bundle (Princeton Instruments) using a 532 nm laser source. Photoluminescence (PL) spectra were measured on the dual grating Fluorometer-3T (JY Horiba), with right angle configuration of excitation and detection. The excitation was made with 300 nm monochromatic light, with slits on the excitation and detection monochromators set at 5 nm.
Electrochemical Impedance Spectroscopy (EIS) measurements were conducted with a Gamry 3000 electrochemical workstation. The spectra were collected using the conventional three-electrode system consisting of a modified indium-tin oxide (ITO) glass as the working electrode, Ag/AgCl as the reference electrode, and platinum wire as the counter electrodes. The EIS measurements were performed between 100 kHz–0.1 Hz at 0.25 V in a 0.1 M KCl solution with 5 mM Fe(CN)63−/Fe(CN)64− with an amplitude of 10 mV. The modified ITO working electrode was prepared by dispersing 7 mg of each photocatalyst sample in 1.0 mL of 18.2 Milli-Q water, dripping 80 μL of the slurry on ITO glass (dimensions: 1 cm × 1 cm), and drying the modified ITO working electrode in a vacuum oven at 60 °C for 5 hours prior to the measurement.
2.3 Photocatalytic test and electrochemical impedance spectroscopy (EIS)
The photocatalytic activity of the catalysts was evaluated by measuring the photocatalytic reduction of 4-nitroaniline (4-NA) and photocatalytic degradation rate of Rhodamine B (RhB) and under visible light irradiation. In a typical experiment, 80 mg of photocatalyst was dispersed in 50 mL of 4-NA aqueous solution (10 ppm) or RhB aqueous solution (10 ppm) in an 80 mL capacity quartz glass photo-reactor cell. The suspension was stirred in the dark for 30 min before turning on the lamp to establish an adsorption–desorption equilibrium. A 300 W Xenon lamp equipped with a UV cut-off filter (λ ≥ 420 nm) was used as a source of visible light. The degradation of 4-NA was performed under nitrogen (flow rate of 50 mL min−1) in the presence of 10 mg of ammonium oxalate. 1 mL of the suspension was withdrawn at predetermined time intervals (30 min or 60 min) and the catalyst was separated by centrifugation. The change in 4-NA and RhB concentrations were monitored using an Agilent-8453 UV-vis spectrometer at λ = 380 nm (for 4-NA) and λ = 553 nm (for RhB). In order to detect the active species generated in the photocatalytic process, the scavengers, including disodium ethylene diamine tetra acetate (Na2-EDTA), 1,4-benzoquinone (BQ) and isopropyl alcohol (IPA) were added as quenchers of holes (h+), superoxide radicals (˙O2−), and hydroxyl radicals (˙OH) respectively. All the experiments with scavengers were conducted in a similar manner of RhB degradation using Bi2O3/WO3 composite photocatalyst (80 mg) using visible light as explained above. Fresh RhB solutions were replaced in each experiment. The effects of scavengers were concluded based on the percentage degradation of RhB by Bi2O3/WO3 composite photocatalyst in 3 hours of visible light (λ ≥ 420 nm) irradiation.
3. Results and discussion
3.1 Characterization of photocatalysts
The identity and purity of prepared WO3, Bi2O3, Bi2O3/WO3 composite, and Bi2WO6 were determined using PXRD as shown on Fig. 1. PXRD data indicate that the observed diffraction peaks of Bi2O3/WO3 sample are in good agreement with those of monoclinic WO3 (JCPDS-072-0677) and monoclinic Bi2O3 (JCPDS-070-8243). No additional peaks were observed, as confirmed by comparing Fig. 1a–c. The Bi2O3/WO3 composite exhibits peaks from both Bi2O3 and WO3 without any impurity peak. Fig. 1d corresponds to orthorhombic phase of Bi2WO6 (JCPDS-079-2381). The refined lattice parameters along with space groups of Bi2O3, WO3 and Bi2WO6 are summarized in Table 1.
 |
| | Fig. 1 PXRD patterns of (a) WO3, (b) Bi2O3, (c) Bi2O3/WO3 composite and (d) Bi2WO6. | |
Table 1 Crystal structure representation, refined lattice parameters, band gaps and colour of Bi2O3, WO3 and Bi2WO6
| Sample |
Bi2O3 |
WO3 |
Bi2WO6 |
| Crystal system |
Monoclinic |
Monoclinic |
Orthorhombic |
| Crystal structure representation |

|

|

|
| Space group |
P21/c |
P21/n |
Pca21 |
| Refined lattice parameters |
a = 5.8481(2) Å |
a = 7.3124(4) Å |
a = 5.4443(8) Å |
|
b = 8.1651(2) Å |
b = 7.5294(3) Å |
b = 16.4391(7) Å |
|
c = 7.50921(3) Å |
c = 7.6924(2) Å |
c = 5.4603(2) Å |
|
β = 113.57(2)° |
β = 90.658(3)° |
|
| Band gaps |
2.80 eV |
2.78 eV |
2.93 eV |
| Color |
Yellow |
Yellow |
White |
To further examine the Bi2O3/WO3 composite, the morphology and microstructure were investigated by electron microscopy. SEM images of the Bi2O3/WO3 composite are shown in Fig. 2a and b with different resolutions. SEM images revealed that the composite calcined at 400 °C consists of elongated and spherical shapes particles, approximately 40–60 nm. Also, cauliflower like microstructures with 200–300 nm in size are evenly distributed in the sample. To further confirm the heterojunction composition, the samples were characterized by STEM analysis. The STEM study of pure samples (Fig. 3a and b) shows that the as prepared Bi2O3 has spherical morphology with particle size between 70 and 90 nm, while the as synthesized WO3 is a mixture of spherical and needle shaped particles with size between 40 and 60 nm.
 |
| | Fig. 2 (a and b) SEM images of Bi2O3/WO3 composite. | |
 |
| | Fig. 3 STEM images of (a) Bi2O3, (b) WO3, (c–f) Bi2O3/WO3 composite, and (g, h) STEM mapping analysis for the composite shown in (f), Bi (green) and W (red). | |
STEM images of Bi2O3/WO3 composite as shown in Fig. 3c–f show cauliflower-like structures (200–300 nm in size) as well as smaller particles (40–60 nm) evenly distributed throughout the composite. STEM-EDX mapping (Fig. 3f–h) on Bi2O3/WO3 composite microcrystalline powders, show that tungsten and bismuth are evenly distributed throughout the composite. In addition to even distribution of the two oxides, elemental mapping clearly shows that the cauliflower-like structures contain more bismuth oxide, while the rod-like and spherical particles contain more tungsten oxide than bismuth oxide. The observed lattice fringes with inter-planar spacing of 0.325 and 0.361 nm calculated from high resolution STEM images (Fig. 3e), correspond to the (120) interplanar distance of the monoclinic phase of Bi2O3 and the (200) interplanar spacing of the monoclinic phase of WO3 respectively. This result is consistent with that obtained from the PXRD analysis shown in Fig. 1.
Diffuse reflectance UV-vis spectra of Bi2O3, WO3, Bi2O3/WO3 composite, and Bi2WO6 (Fig. 4) display photo-absorption properties at wavelength shorter than 443 nm, 447 nm, 446 nm and 423 nm, respectively. This clearly demonstrates that the composite and other studied catalysts had potential applications in the visible light region (λ ≥ 420 nm). The band gap energy of a semiconductor may be calculated from eqn (1).31
where
α,
h,
ν,
Eg and
A are the absorption coefficient, the Planck's constant, the light frequency, band gap energy, and a proportionality constant, respectively. The exponent
n is determined by the type of optical transition of a semiconductor (
n = 1 for direct transition and
n = 4 for indirect transition). Thus, the band-gap energies (
Eg) of the samples could be estimated from plots of (
ahν)
2/nversus the photon energy (
hν). The value of
n is taken as 1 for Bi
2O
3, and Bi
2WO
6 and 4 for WO
3.
32–36 In the case of Bi
2O
3/WO
3 composite,
n = 4 was used, assuming that the composite was an indirect band gap semiconductor. From the plot of (
ahν)
2/nversus (
hν) (
Fig. 4b),
the band gap of Bi
2O
3, WO
3, Bi
2O
3/WO
3 composite, and Bi
2WO
6 were determined to be 2.80 eV, 2.77 eV, 2.78 eV, and 2.93 eV, respectively.
 |
| | Fig. 4 (a) Diffuse reflectance spectra of composite, its components, and ternary oxide, Bi2WO6; (b) plot of (αhν)2/nvs. energy (hν) for the determination of the band gap energy of WO3, Bi2O3, and Bi2WO6. The extrapolation of the (αhν)2/nvs. (hν) plot on the x intercepts gives optical band gaps. | |
The DSC-TGA curves of Bi2O3/WO3 composite (Fig. 5) show a major weight loss (approx. 10.5%) before 400 °C, which can be attributed to dehydration and thermal decomposition of residual organic molecules present in the precursors used during the synthesis of the Bi2O3/WO3 composite. The DSC curve of the as prepared Bi2O3/WO3 composite, shows three major endothermic peaks at 250 °C, 320 °C and 360 °C which may be assigned to loss of organics to form the Bi2O3/WO3 composite. Another endothermic peak at 830 °C is attributed to the formation and crystallization of Bi2WO6. Based on the DSC-TGA data, the as prepared composite was calcined first at 400 °C to form the composite, and at 900 °C to obtain Bi2WO6. The identity of the phases obtained was confirmed by PXRD as shown on Fig. 1. The formation of pure ternary phase (Bi2WO6) from the composite further supports the 1 to 1 molar ratio of Bi2O3 and WO3 in composite (eqn (2)).
 |
| | Fig. 5 TGA and DSC data of the Bi2O3/WO3 composite. | |
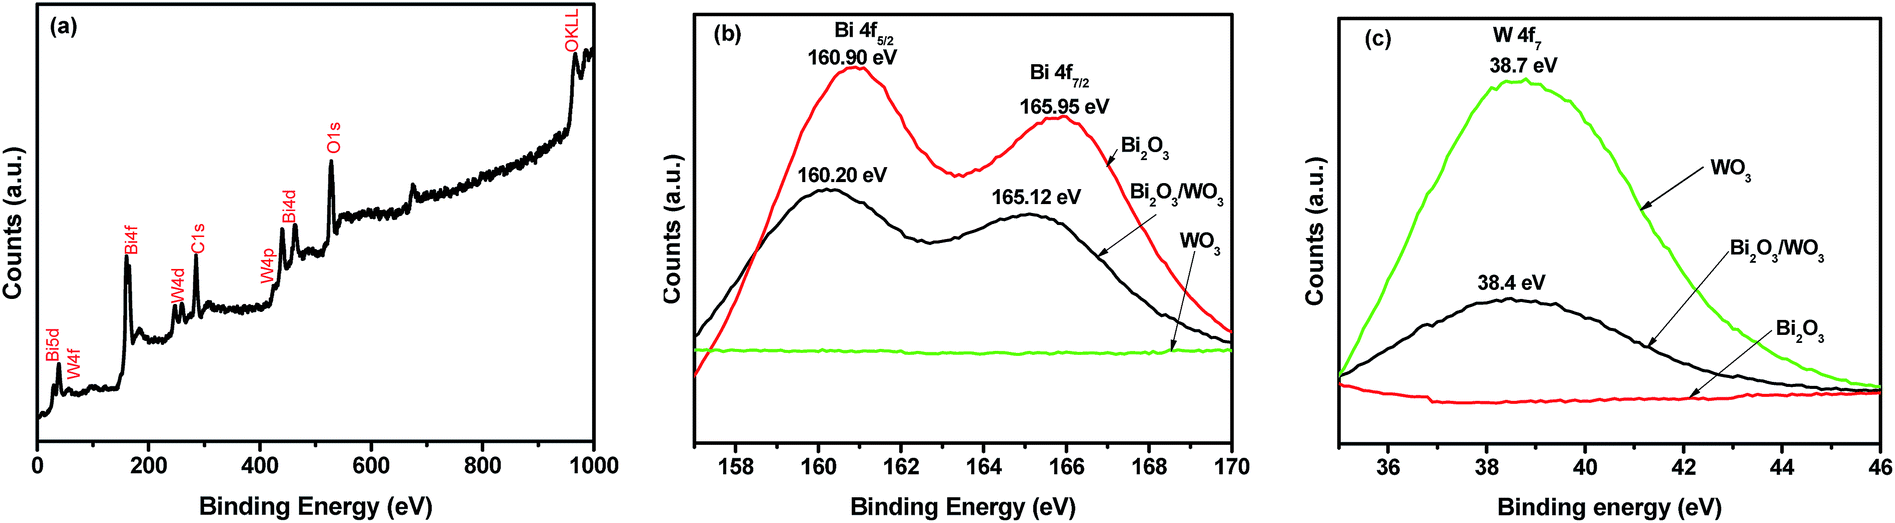
XPS spectra of Bi2O3, WO3, and Bi2O3/WO3 composite (Fig. 6) indicate the presence of W, O, and Bi in the Bi2O3/WO3 composite. The binding energy of the WO3 sample was found to be about 38.7 eV, which corresponds to 4f7/2 of W(VI).37,38 The two peaks observed at 160.09 and 165.80 eV correspond to the 4f7/2 and 4f5/2 of Bi(III), respectively, and are consistent with previously reported binding energies for Bi2O3.39,40 The binding energies of bismuth and tungsten in the composite are slightly shifted when compared to those found for pure samples, which may be attributed to the intimate contact between the Bi2O3 and WO3 particles.41
 |
| | Fig. 6 (a) XPS survey spectra for Bi2O3/WO3 composite. (b) XPS spectra of Bi 4f region for WO3, Bi2O3, and Bi2O3/WO3 composite. (c) XPS spectra of W 4f region for WO3, Bi2O3, and Bi2O3/WO3 composite. | |
BET surface area measurements were collected for all samples using nitrogen adsorption–desorption isotherms as shown in Fig. S3 (ESI†). The results indicate that the specific surface area of composite (8.27 m2 g−1) is slightly smaller than that of WO3 (10.79 m2 g−1), which may be due to particles agglomeration upon calcination. On the other hand, the surface area of composite is higher than that of pure Bi2O3 (6.46 m2 g−1). The specific surface area of bismuth tungstate (0.74 m2 g−1) is also small due to aggregation of Bi2WO6 particles upon calcination at 900 °C.
Raman spectroscopy of WO3, Bi2O3, Bi2O3/WO3 composite and Bi2WO6 (Fig. 7) was performed to determine the changes of vibrational modes of Bi2O3 and WO3 in the composite. The Raman data for pure WO3 sample has absorption bands at 276 and 332 cm−1, which are attributed to W–O–W bending vibrational modes; two other bands observed at 720 and 811 cm−1 are assigned to W–O–W stretching vibrations.42 Similarly, the bands observed at 283, 319 and 452 cm−1 are due to the presence of Bi2O3.43,44 The Bi2O3/WO3 composite contains only bands of pure Bi2O3 and WO3, which indicates that the composite consists of only these two oxides. Furthermore, the absorption becomes broader and weaker when WO3 is covered with Bi2O3 in the composite which suggests increased crystalline defects within the framework. Such defects may favour the capture of photo-generated electrons and inhibit charge carriers recombination.17 For Bi2WO6, the bands observed at 288, 311, 335, 723, 798, and 839 cm−1 correspond to the orthorhombic phase of Bi2WO6.45,46
 |
| | Fig. 7 Raman spectra of Bi2O3, WO3, Bi2O3/WO3 composite, and Bi2WO6. | |
3.2 Photocatalytic testing
3.2.1 Activity.
The photocatalytic activities of all synthesized compounds were evaluated under visible light illumination (λ ≥ 420 nm) by comparing the photocatalytic reduction 4-NA, and degradation efficiencies of RhB (Fig. 8). Fig. S4 (ESI†) shows the photocatalytic degradation of RhB by the Bi2O3/WO3 composite under visible light irradiation. A decrease of RhB absorption intensity at wavelength 553 nm is observed. Fig. 8a shows the photocatalytic degradation efficiency of RhB with different catalysts under visible light irradiation. In the absence of photocatalyst, photolysis of RhB is negligible. Pure Bi2O3 and pure WO3 can degrade RhB by 38.07% and 41.37% in 180 min, respectively, while the ternary oxide Bi2WO6 only degraded 27.15% of RhB when irradiated by visible light for the same period of time. In contrast 76.67% of RhB decomposed after 180 min visible light irradiation in the presence of Bi2O3/WO3 composite. The Bi2O3/WO3 composite exhibited significantly higher photocatalytic activity compared to pure Bi2O3, pure WO3, and Bi2WO6. For 4-nitroanilne (4-NA), 60% of 4-NA decomposed after five hours irradiation by visible light in the presence of the Bi2O3/WO3 composite, compared to only 18%, 25%, and 15% when equal amounts of Bi2O3, WO3, and Bi2WO6 were used respectively (Fig. 8b). This result clearly indicates that the Bi2O3/WO3 composite photocatalyst possesses superior photocatalytic capability in comparison to individual components as well as the ternary oxide. It is notable that blend sample (physically mixed) did not show notable enhanced photocatalytic activity as compared to Bi2O3/WO3 composite. This implies that there might be some interaction between Bi2O3 and WO3 in Bi2O3/WO3 composite sample, which played important role in improving the photocatalytic activity.
 |
| | Fig. 8 Photocatalytic degradation efficiency using different catalysts activities of different catalysts under visible light irradiation; (a) RhB and (b) 4-NA. | |
3.2.2 Kinetic and stability study.
The degradations of RhB and 4-NA agree with pseudo-first order kinetics. Their photocatalytic degradation can be described by eqn (3).where C0 is the initial concentration of RhB (or 4-NA), C is the concentration of RhB (or 4-NA) at time t, and k is the rate constant. The corresponding rate constants (k) were calculated and are reported in Table 2. Under the same experimental conditions, the rate constant of RhB degradation with the Bi2O3/WO3 composite was determined to be 3.12 times larger than that of pristine Bi2O3 and 2.78 times that of WO3. Similarly, the rate constant of 4-NA degradation with Bi2O3/WO3 composite was found to be 4.32 times as large as that of pure Bi2O3 and 3.32 times that of WO3. The rate constants for the composites are 4.33 and 5.24 times greater than that of Bi2WO6 for the degradation of RhB and 4-NA, respectively. It is also clear that the rate constants for composites are higher than those of physically mixed blend sample.
Table 2 Pseudo first order rate constants for photocatalytic degradation process of RhB or 4-NA under visible light irradiation (λ ≥ 420 nm)
| Sample |
RhB degradation rate constants (min−1) |
4-NA degradation rate constants (h−1) |
| Bi2O3 |
0.025 |
0.040 |
| WO3 |
0.028 |
0.052 |
| Bi2WO6 |
0.018 |
0.033 |
| Bi2O3/WO3 |
0.078 |
0.173 |
| Blend |
0.030 |
0.053 |
The stability of Bi2O3/WO3 composite was further investigated by recycling the photocatalyst for RhB degradation under visible light irradiation for 3 hours. During this stability test, fresh RhB solution was used after each cycle of photocatalytic experiment. The results are displayed in Fig. 9a. After five cycles, the photocatalytic ability of the Bi2O3/WO3 composite was virtually unchanged (declined by only 1.87%), indicating that the Bi2O3/WO3 composite photocatalyst possesses excellent photocatalytic stability and recyclability. Furthermore, PXRD analyses of the Bi2O3/WO3 composite photocatalyst before and after the reaction (4-NA degradation) shown in Fig. 9b, clearly indicate that the Bi2O3/WO3 composite is photo- and chemically stable.
 |
| | Fig. 9 Photocatalyst stability. (a) Cycling runs of Bi2O3/WO3 composite under visible light irradiation for 3 hour; (b) XRD patterns of Bi2O3/WO3 composite before and after photocatalytic degradation of 4-nitroaniline (4-NA). | |
3.2.3 Proposed mechanism of photocatalytic activity of RhB degradation and 4-NA degradation.
In the photocatalytic processes, a series of photo-induced reactive species, including h+, ˙OH or ˙O2−, directly take part in the redox process after the electron–hole pairs are generated. The electron can be trapped by molecular oxygen to produce the superoxide radical (˙O2−), which acts as a strong oxidant to degrade dye molecules. In the photocatalytic degradation of RhB using Bi2O3, WO3, Bi2O3/WO3 composite, or Bi2WO6, the generation of hydroxyl radicals (˙OH) is almost impossible because the valence band position of these catalysts lies much higher than the energy of ˙OH/OH− (1.99 eV). Hence, the photocatalytic degradation of RhB is primarily caused by superoxide radicals and photogenerated holes.47
In order to survey the active species in the photodegradation process of RhB over Bi2O3/WO3 composite, the trapping experiments were conducted. Various scavengers, including benzoquinone (BQ), disodium salt of ethylene diamine tetra acetic acid (Na2-EDTA) and isopropanol (IPA) were added to as the quenchers of superoxide radicals (˙O2−), holes (h+) and hydroxyl radicals (˙OH) respectively.41,48 From Table S1 (ESI†), it can be found that degradation efficiency of RhB was slightly affected by the addition of IPA. On the other hand, the degradation efficiency is significantly inhibited by the addition of BQ and Na2-EDTA. These results indicated that superoxide radicals (˙O2−) and holes (h+) are the main active species in the degradation of RhB.49
Similarly, the degradation of 4-NA also follows the same pathway except that generation of the superoxide radical (˙O2−) is unlikely because the experiment was conducted under nitrogen flow. Hence, the photogenerated holes (h+) located in the valence band of the catalysts are solely responsible for 4-NA degradation. These holes (h+) can produce active carbon-dioxide anion radial (˙CO2−) in the presence of oxalate (C2O42−) ion (eqn (4)). These ˙CO2− radical anions have a strong reductive ability and hence can reduce 4-NA.50–52
| | | C2O42− + h+ → CO2 + ˙CO2− | (4) |
3.2.4 Enhanced activity of composite.
To better understand the mechanism of the enhanced photocatalytic activity of the Bi2O3/WO3 composite, the relative band positions of the two semiconductors were determined since the band-edge potential levels play a crucial role in determining the pathway of the photogenerated charge carriers in a heterojunction. The conduction band (CB) bottoms (ECB) were calculated empirically according to eqn (5).53–55where Eg is the band gap energy of the semiconductor, E0 is a scale factor relating the reference electrode's redox level to the absolute vacuum scale (E0 = −4.5 eV for normal hydrogen electrode), and X is the electronegativity of the semiconductor, which can be expressed as the geometric mean of the absolute electronegativity of the constituent atoms. The X values for Bi2O3, WO3, and Bi2WO6 were calculated to be 6.23, 6.59 and 6.36, respectively, and the band gap energies of Bi2O3, WO3 and Bi2WO6 were determined to be 2.80 eV, 2.78 eV, and 2.95 eV, respectively (Fig. 4 and Table 1). Using eqn (5) above, the conduction band bottom (ECB) of, Bi2O3, WO3 and Bi2WO6 were calculated to be 0.33 eV, 0.70 eV, and 0.38 eV, respectively. Correspondingly, the valence band tops (EVB) were calculated to be 3.13 eV, 3.48 eV, and 3.33 eV. Because of the small band gaps in Bi2O3 and WO3, both are excited using visible light (λ ≥ 420 nm) and corresponding photo-induced electrons and holes are generated in each component of the composite. Photogenerated electrons can be injected from the conduction band of Bi2O3 to the conduction band of WO3 because of the intimate contact between the two semiconductors. Simultaneously, holes generated in the valence band of WO3 can be transferred to that of Bi2O3 because of the relative band positions (Fig. 10). Thus, the photo-generated charge carriers are efficiently separated and their recombination rate is significantly reduced.8,9,35,56,57
 |
| | Fig. 10 Scheme for electron–hole separation and transport at the visible light driven Bi2O3/WO3 composite photocatalyst with calculated band positions. | |
In order to investigate the lifetime of the photogenerated electron–hole pairs, photoluminescence (PL) experiments were carried out on all prepared phases. PL spectra are related to the transfer behaviour of the photogenerated electrons and holes. In PL experiment, the electrons are excited to CB (or sub bands) from VB at certain excitation wavelength. These electrons may go back to VB giving rise to PL signal. High photoluminescence intensity is generally considered to reflect a high recombination rate of charge carriers.41,58–60Fig. 11 shows the PL spectra for Bi2O3, WO3, Bi2O3/WO3 composite and Bi2WO6 with an excitation wavelength of 300 nm. The main emission peak is centred at about 400–440 nm for all samples. The PL emission intensity of the composite Bi2O3/WO3 is significantly smaller compared to that of the precursors Bi2O3, WO3, and ternary Bi2WO6. The PL emission intensity was found to be in the order Bi2O3/WO3 < WO3 < Bi2O3 < Bi2WO6. In addition to the PL study, we have also conducted electrochemical impedance spectra (EIS) to understand the migration and transfer process of photogenerated electron and holes. From Fig. 12, it could be seen that the diameter of the Nyquist circle of composite was significantly lower than that of the pristine Bi2O3 or WO3 and ternary oxide (Bi2WO6). The smaller diameter of the arc implied lower resistance occurred on the surface of electrode.31,41,48,61 This result further demonstrates that introduction of Bi2O3 into WO3 can enhance the separation and transfer efficiency of photogenerated electron and holes, which is favourable for enhancing the photocatalytic activity. The results from EIS are consistent with PL. These results suggest that the composite has a much lower recombination rate of photogenerated charge carriers, consistent with the observed higher photocatalytic activity.
 |
| | Fig. 11 Photoluminescence (PL) spectra for Bi2O3, WO3, Bi2O3/WO3 composite and Bi2WO6. | |
 |
| | Fig. 12 Electrochemical impedance spectra of Bi2O3, WO3, and Bi2O3/WO3 composite photocatalysts. | |
4. Conclusions
In summary, Bi2O3/WO3 composite photocatalyst fabricated via a hydrothermal method and its catalytic activity for RhB and 4-NA degradation was studied and compared to that of individual components and ternary oxide Bi2WO6. The highest degradation efficiency was achieved for the Bi2O3/WO3 composite, which induced 76.67% degradation of RhB within 3 h and 60% degradation of 4-NA within 5 h under visible light irradiation, while pure WO3 (and Bi2O3) led to 41.37% (38.07%) degradation of RhB and 17.03% (23.9%) degradation of 4-NA within the same time period. Similarly only 27.15% of RhB and 15% of 4-NA decomposed in the same time period when using Bi2WO6 under visible light irradiation. The enhanced activity is attributed to the effective separation of electron–hole pairs in the composite giving the synergetic effects between Bi2O3 and WO3. Based upon the band positions, photoluminescence and electrochemical impedance data, a simple mechanism has been proposed that provides new insights for the fabrication of composite materials that have enhanced photocatalytic performance under visible light thus maximizing the use of solar energy.
Acknowledgements
A portion of this research including the STEM, UV-Vis-DRS, Raman and PL was conducted at the Center for Nanophase Materials Sciences, which is a DOE Office of Science User Facility. The authors would like to thank Dr Corey Hewitt, Wake Forest University, Department of Physics, for his support in collecting XPS data. The authors gratefully acknowledge John Reynolds and Anna Österholm for providing access to their potentiostat for EIS measurements. Support from Phase II Triad Interuniversity Project (TIP) is acknowledged.
Notes and references
- K. Rajeshwar, J. Phys. Chem. Lett., 2011, 2, 1301–1309 CrossRef CAS PubMed.
- A. Fujishima and K. Honda, Nature, 1972, 238, 37–38 CrossRef CAS PubMed.
- F. E. Osterloh, Chem. Soc. Rev., 2013, 42, 2294–2320 RSC.
- R. Asahi, T. Morikawa, T. Ohwaki, K. Aoki and Y. Taga, Science, 2001, 293, 269–271 CrossRef CAS PubMed.
- M. Ni, M. K. H. Leung, D. Y. C. Leung and K. Sumathy, Renewable Sustainable Energy Rev., 2007, 11, 401–425 CrossRef CAS PubMed.
- R. Abe, J. Photochem. Photobiol., C, 2010, 11, 179–209 CrossRef CAS PubMed.
- A. Zaleska, Recent Pat. Eng., 2008, 2, 157–164 CrossRef CAS.
- H. Wang, L. Zhang, Z. Chen, J. Hu, S. Li, Z. Wang, J. Liu and X. Wang, Chem. Soc. Rev., 2014, 43, 5234–5244 RSC.
- R. Marschall, Adv. Funct. Mater., 2014, 24, 2421–2440 CrossRef CAS PubMed.
- K. Sivula, F. L. Formal and M. Grätzel, Chem. Mater., 2009, 21, 2862–2867 CrossRef CAS.
- D. J. Ham, A. Phuruangrat, S. Thongtem and J. S. Lee, Chem. Eng. J., 2010, 165, 365–369 CrossRef CAS PubMed.
- K. Takehara, K. Yamazaki, M. Miyazaki, Y. Yamada, S. Ruenphet, A. Jahangir, D. Shoham, M. Okamura and M. Nakamura, Virus Res., 2010, 151, 102–103 CrossRef CAS PubMed.
- R. Abe, H. Takami, N. Murakami and B. Ohtani, J. Am. Chem. Soc., 2008, 130, 7780–7781 CrossRef CAS PubMed.
- M. Qamar, M. A. Gondal and Z. H. Yamani, Catal. Commun., 2010, 11, 768–772 CrossRef CAS PubMed.
- D. Bi and Y. Xu, Langmuir, 2011, 27, 9359–9366 CrossRef CAS PubMed.
- J. Cao, B. Luo, H. Lin, B. Xu and S. Chen, Appl. Catal., B, 2012, 111–112, 288–296 CrossRef CAS PubMed.
- S. A. K. Leghari, S. Sajjad, F. Chen and J. Zhang, Chem. Eng. J., 2011, 166, 906–915 CrossRef CAS PubMed.
- H. Widiyandari, A. Purwanto, R. Balgis, T. Ogi and K. Okuyama, Chem. Eng. J., 2012, 180, 323–329 CrossRef CAS PubMed.
- T. Arai, M. Yanagida, Y. Konishi, Y. Iwasaki, H. Sugihara and K. Sayama, J. Phys. Chem. C, 2007, 111, 7574–7577 CAS.
- Z. Liu, Z.-G. Zhao and M. Miyauchi, J. Phys. Chem. C, 2009, 113, 17132–17137 CAS.
- A. Hameed, V. Gombac, T. Montini, L. Felisari and P. Fornasiero, Chem. Phys. Lett., 2009, 483, 254–261 CrossRef CAS PubMed.
- M. Li, F. Li and P. G. Yin, Chem. Phys. Lett., 2014, 601, 92–97 CrossRef CAS PubMed.
- S. Y. Chai, Y. J. Kim, M. H. Jung, A. K. Chakraborty, D. Jung and W. I. Lee, J. Catal., 2009, 262, 144–149 CrossRef CAS PubMed.
- Z. Zhang, J. Zhu, S. Li and Y. Mao, J. Solid State Chem., 2014, 211, 120–123 CrossRef CAS PubMed.
- B. Naik, S. Martha and K. M. Parida, Int. J. Hydrogen Energy, 2011, 36, 2794–2802 CrossRef CAS PubMed.
- X. Lin, J. Xing, W. Wang, Z. Shan, F. Xu and F. Huang, J. Phys. Chem. C, 2007, 111, 18288–18293 CAS.
- S. P. Adhikari, Z. D. Hood, K. L. More, I. Ivanov, L. Zhang, M. Gross and A. Lachgar, RSC Adv., 2015, 5, 54998–55005 RSC.
- X.-F. Cao, L. Zhang, X.-T. Chen and Z.-L. Xue, CrystEngComm, 2011, 13, 306–311 RSC.
- H. Ma, J. Shen, M. Shi, X. Lu, Z. Li, Y. Long, N. Li and M. Ye, Appl. Catal., B, 2012, 121–122, 198–205 CrossRef CAS PubMed.
- G.-H. He, G.-L. He, A.-J. Li, X. Li, X.-J. Wang, Y.-P. Fang and Y.-H. Xu, J. Mol. Catal. A: Chem., 2014, 385, 106–111 CrossRef CAS PubMed.
- H. Huang, L. Liu, Y. Zhang and N. Tian, RSC Adv., 2015, 5, 1161–1167 RSC.
- F. Qin, G. Li, R. Wang, J. Wu, H. Sun and R. Chen, Chem.–Eur. J., 2012, 18, 16491–16497 CrossRef CAS PubMed.
- K. C. Leonard, K. M. Nam, H. C. Lee, S. H. Kang, H. S. Park and A. J. Bard, J. Phys. Chem. C, 2013, 117, 15901–15910 CAS.
- H. Fu, L. Zhang, W. Yao and Y. Zhu, Appl. Catal., B, 2006, 66, 100–110 CrossRef CAS PubMed.
- Z. Zhang, W. Wang, L. Wang and S. Sun, ACS Appl. Mater. Interfaces, 2012, 4, 593–597 CAS.
- Y. Peng, Q.-G. Chen, D. Wang, H.-Y. Zhou and A.-W. Xu, CrystEngComm, 2015, 17, 569–576 RSC.
- M. Ge, Y. Li, L. Liu, Z. Zhou and W. Chen, J. Phys. Chem. C, 2011, 115, 5220–5225 CAS.
- G.-H. He, C.-J. Liang, Y.-D. Ou, D.-N. Liu, Y.-P. Fang and Y.-H. Xu, Mater. Res. Bull., 2013, 48, 2244–2249 CrossRef CAS PubMed.
- X. Li, R. Huang, Y. Hu, Y. Chen, W. Liu, R. Yuan and Z. Li, Inorg. Chem., 2012, 51, 6245–6250 CrossRef CAS PubMed.
- X.-F. Liu, Y.-K. Lai, J.-Y. Huang, S. S. Al-Deyab and K.-Q. Zhang, J. Mater. Chem. C, 2015, 3, 345–351 RSC.
- L. Huang, H. Xu, Y. Li, H. Li, X. Cheng, J. Xia, Y. Xu and G. Cai, Dalton Trans., 2013, 42, 8606–8616 RSC.
- L. Xu, M.-L. Yin and S. (Frank) Liu, Sci. Rep., 2014, 4, 6745 CrossRef CAS PubMed.
- Y. Wang, Y. He, T. Li, J. Cai, M. Luo and L. Zhao, Chem. Eng. J., 2012, 189–190, 473–481 CrossRef CAS PubMed.
- J. In, I. Yoon, K. Seo, J. Park, J. Choo, Y. Lee and B. Kim, Chem.–Eur. J., 2011, 17, 1304–1309 CrossRef CAS PubMed.
- J. Low, J. Yu, Q. Li and B. Cheng, Phys. Chem. Chem. Phys., 2014, 16, 1111–1120 RSC.
- Y. Li, J. Liu, X. Huang and J. Yu, Dalton Trans., 2010, 39, 3420–3425 RSC.
- P. Wilhelm and D. Stephan, J. Photochem. Photobiol., A, 2007, 185, 19–25 CrossRef CAS PubMed.
- X. Bai, L. Wang and Y. Zhu, ACS Catal., 2012, 2, 2769–2778 CrossRef CAS.
- C. Xing, Z. Wu, D. Jiang and M. Chen, J. Colloid Interface Sci., 2014, 433, 9–15 CrossRef CAS PubMed.
- W. Wu, R. Lin, L. Shen, R. Liang, R. Yuan and L. Wu, Catal. Commun., 2013, 40, 1–4 CrossRef CAS PubMed.
- K. Imamura, S. Iwasaki, T. Maeda, K. Hashimoto, B. Ohtani and H. Kominami, Phys. Chem. Chem. Phys., 2011, 13, 5114–5119 RSC.
- W. Wu, G. Liu, S. Liang, Y. Chen, L. Shen, H. Zheng, R. Yuan, Y. Hou and L. Wu, J. Catal., 2012, 290, 13–17 CrossRef CAS PubMed.
- Z. Wei, L. Feng, J. Zhi-Ming, S. Xiao-Bo, Y. Peng-Hui, W. Xue-Ren, S. Cheng, G. Zhan-Qi and L. Liang-Sheng, J. Mater. Chem. A, 2014, 2, 13226–13231 Search PubMed.
- M. Long, W. Cai, J. Cai, B. Zhou, X. Chai and Y. Wu, J. Phys. Chem. B, 2006, 110, 20211–20216 CrossRef CAS PubMed.
- M. A. Butler and D. S. Ginley, J. Electrochem. Soc., 1978, 125, 228–232 CrossRef CAS PubMed.
- B. Chen, Y. Deng, H. Tong and J. Ma, Superlattices Microstruct., 2014, 69, 194–203 CrossRef CAS PubMed.
- A. M. Abdulkarem, A. A. Aref, A. Abdulhabeeb, Y.-F. Li and Y. Yu, J. Alloys Compd., 2013, 560, 132–141 CrossRef CAS PubMed.
- J. Tang, Z. Zou and J. Ye, J. Phys. Chem. B, 2003, 107, 14265–14269 CrossRef CAS.
- Y. Du, L. Zhao and Y. Zhang, J. Hazard. Mater., 2014, 267, 55–61 CrossRef CAS PubMed.
- M. T. Mayer, C. Du and D. Wang, J. Am. Chem. Soc., 2012, 134, 12406–12409 CrossRef CAS PubMed.
- Z. Hosseini, N. Taghavinia, N. Sharifi, M. Chavoshi and M. Rahman, J. Phys. Chem. C, 2008, 112, 18686–18689 CAS.
Footnote |
| † Electronic supplementary information (ESI) available: Fig. S1: molecular structures of Rhodamine B (RhB) and 4-nitroaniline (4-NA); Fig. S2: SEM image of Bi2WO6; Fig. S3: nitrogen adsorption desorption isotherms. Fig. S4: changes in UV-vis absorbance spectra during the photocatalysis by Bi2O3/WO3 composite, Table S1: photocatalytic degradation efficiencies. See DOI: 10.1039/c5ra13579f |
|
| This journal is © The Royal Society of Chemistry 2015 |
Click here to see how this site uses Cookies. View our privacy policy here. 
![[thin space (1/6-em)]](https://www.rsc.org/images/entities/char_2009.gif) :
: