
 Open Access Article
 This Open Access Article is licensed under a
 Creative Commons Attribution 3.0 Unported Licence
Composition-dependent in vitro apatite formation at mesoporous bioactive glass-surfaces quantified by solid-state NMR and powder XRD†
Claudia Turdean-Ionescua,
Baltzar Stevenssona,
Jekabs Grinsa,
Isabel Izquierdo-Barbabc,
Ana Garcíabc,
Daniel Arcosbc,
María Vallet-Regíbc and
Mattias Edén*a
aDepartment of Materials and Environmental Chemistry, Arrhenius Laboratory, Stockholm University, SE-106 91 Stockholm, Sweden. E-mail: mattias.eden@mmk.su.se
bDepartamento de Química Inorgánica y Bioinorgánica, Facultad de Farmacia, Universidad Complutense de Madrid, Instituto de Investigación Sanitaria Hospital 12 de Octubre i+12, 28040 Madrid, Spain
cNetworking Research Center on Bioengineering, Biomaterials and Nanomedicine (CIBER-BBN), Madrid, Spain
First published on 30th September 2015
Abstract
Silicate-based bioactive glasses exhibit bone-bonding properties due to the formation of a hydroxy-carbonate apatite (HCA) layer at the glass surface on its contact with living tissues. This bone-healing process is triggered by ionic exchange between the glass and the surrounding fluids and thereby depends on the glass composition. In this work, the HCA formation from three mesoporous bioactive glasses (MBGs) of different compositions immersed in a simulated body fluid (SBF) was monitored for variable time intervals between 15 minutes to 30 days. By utilizing two independent assessment techniques, solid-state 31P NMR spectroscopy and powder X-ray diffraction (PXRD), we report the first quantitative assessment of the HCA growth (i.e., “in vitro bioactivity”) from a bioactive glass: both techniques allow for monitoring the crystallization of the amorphous calcium phosphate (ACP) precursor into HCA, i.e., a profile of the relative ACP/HCA fractions of the biomimetic phosphate layer formed at each MBG surface and SBF-exposure period. The amount of HCA present in each solid specimen after the SBF treatment, as well as the composition of the remaining cation-depleted MBG phase, was determined from PXRD data in conjunction with measured concentrations of Ca, Si, and P in the solution. In contrast with previous findings from in vitro bioactivity assessments of the same MBG compositions, the HCA formation is herein observed to increase concurrently with the Ca and P contents of the MBG; these apparently different composition-bioactivity observations stem from a significantly lower MBG-loading in the SBF solution utilized herein. The results are discussed in relation to the general task of performing bioactivity testing in SBF, where we highlight the importance of adapting the concentration of the biomaterial to its composition to avoid perturbing the HCA crystallization and thereby altering the outcome of the test.
1 Introduction
When implanted in the human body, primarily for maxillofacial/periodontal grafting, bioactive glasses (BGs) naturally integrate with the tissue by a surface-layer of hydroxy-carbonate apatite (HCA) that grows from an amorphous calcium phosphate (ACP) precursor phase.1–3 Such silicate-based glasses may be prepared by a traditional melt-quench,1 sol–gel3 or evaporation-induced self-assembly (EISA)4,5 technique. While both the sol–gel/EISA routes yield porous structures associated with large surface areas, the EISA-derived mesoporous bioactive glasses (MBGs)5–8 feature ordered mesoporous networks that are believed to accelerate the HCA formation rate, i.e., the “bioactivity” of the material.5–7 Several MBGs of the CaO–SiO2–P2O5 system with variable compositions and textural properties are reported,5–10 including hierarchically structured meso/macro-porous scaffolds.11–13The “in vitro bioactivity” of a given (M)BG specimen is normally evaluated by monitoring the onset of HCA formation, and qualitatively assessing the amount thereof when the biomaterial is immersed in a simulated body fluid (SBF) for progressively increased time intervals. The widely exploited traditional HCA-detection techniques of powder X-ray diffraction (PXRD), Fourier transform infrared spectroscopy (FTIR), scanning or transmission electron microscopy (SEM/TEM)1,3,5,7–9,14–17 are more recently complemented by solid-state nuclear magnetic resonance (NMR) spectroscopy.18–24 Such studies are often complemented by measuring the concentrations of Ca, P, and Si in the solution after the SBF-exposure of the (M)BG; this typically reveals an initial elevation of the Ca and P concentrations (stemming from the (M)BG dissolution), followed by their reduction during the subsequent ACP/HCA formation processes. However, existing reports on HCA growth are qualitative rather than quantitative.
We recently demonstrated that the relative amounts of the ACP/HCA components of the biomimetic calcium phosphate layer may be quantified either by utilizing solid-state 31P NMR22,23 or PXRD,23 thereby providing a direct assessment of the extent of ACP → HCA conversion. Herein, we further show that direct quantifications of the relative HCA/ACP contents out of all solid components are accessible. These new quantification procedures for the HCA formation are noninvasive and representative for the entire (solid) sample. Here they are applied for assessing the relative in vitro bioactivities of three MBGs of distinct compositions and textural properties:7,9 “S58” (37CaO–58SiO2–5P2O5), “S85” (10CaO–85SiO2–5P2O5), and “S90” (10CaO–90SiO2), where each sample is labeled according to its nominal SiO2 content in mol%. We evaluated the HCA growth across a wide range of SBF-immersion periods from 15 minutes to 30 days.
Note that the in vitro bioactivity of each S58, S85, and S90 composition has been assessed earlier in several reports.7–9,22,23,25,26 However, most of them were only of qualitative nature and moreover involved high MBG-loadings per SBF unit volume (3–20 g L−1): as discussed by Gunawidjaja et al.,23 bioactivity assessments at such high concentrations may yield very misleading results and—depending on the cation-composition of the MBG—may even quench the HCA formation. Consequently, the present study that utilized a markedly lower MBG concentration of 0.6 g L−1 provides the first direct and quantitative probing of the dependence of the HCA formation on the MBG composition. We discuss the present findings in relation to previous ones,5–7,9,23 and provide a set of general recommendations useful for future in vitro bioactivity-testing of biomaterials.
2 Materials and methods
2.1 MBG preparation
An EISA procedure4 was employed to prepare three MBG specimens of nominal molar compositions 10CaO–90SiO2, 10CaO–85SiO2–5P2O5, and 37CaO–58SiO2–5P2O5 (see Table 1). Each of Si, P, and Ca was incorporated by using precursors of tetraethyl orthosilicate (TEOS), triethyl phosphate (TEP), and Ca(NO3)2·4H2O, respectively. The MBG synthesis was performed at 40 °C, using the non-ionic P123 triblock copolymer as structure-directing agent and other conditions as described in detail in ref. 7. The resulting homogeneous membranes were heated at 700 °C for 6 h to remove organic species and nitrate ions.| Sample | aCaO | bSiO2 | cP2O5 | Stoichiometric formulab | SBETc (m2 g−1) | Vpd (cm3 g−1) | dpe (nm) | Mesoporous structure |
|---|---|---|---|---|---|---|---|---|
| a Each MBG sample is denoted Sb, where b is the nominal oxide equivalent of SiO2 in mol% of the composition aCaO–bSiO2–cP2O5, where a + b + c = 100 mol%. Values in parentheses represent the respective XRF-analyzed oxide equivalents.b Charge-balanced XRF-analyzed stoichiometric composition, with cation coefficients summing to 100.0 (mol).c Surface area (SBET) determined by the Brunauer–Emmett–Teller (BET) method.47d Total pore volume (Vp) calculated from the amount of N2 adsorbed at a relative pressure of P/P0 = 0.98 according to Gregg et al.48e Average pore diameter (dp) obtained by the Barrett–Joyner–Halenda procedure.49 | ||||||||
| S90 | 10.0(9.6) | 90.0(90.4) | 0.0(0.0) | Ca9.6Si90.4P0.0O190.4 | 468 | 0.63 | 5.37 | p6mm |
| S85 | 10.0(10.6) | 85.0(86.5) | 5.0(2.9) | Ca10.3Si84.1P5.6O192.5 | 480 | 0.64 | 5.38 | Ia![[3 with combining macron]](https://www.rsc.org/images/entities/char_0033_0304.gif) d d |
| S58 | 37.0(36.6) | 58.0(59.0) | 5.0(4.4) | Ca35.1Si56.5P8.4O169.2 | 195 | 0.46 | 9.45 | p6mm |
2.2 In vitro studies and composition analyses
An SBF solution was prepared according to Kokubo et al.27 by dissolving NaCl, KCl, NaHCO3, K2HPO4·3H2O, MgCl2·6H2O, CaCl2, and Na2SO4 into distilled water. It was buffered at pH = 7.38 by using tris(hydroxymethyl)-aminomethane/HCl (TRIS/HCl) and subsequently passed through 0.22 μm Millipore filters to avoid bacterial contamination. 600 mg of each pristine MBG sample in the form of a fine powder (<20 μm particles) was immersed in 1.000 L of SBF in a sealed polyethylene container placed in an Ecotron HT incubator. The solutions were stirred continuously (100 rpm) at 37 °C for variable intervals between 15 minutes and 30 days. After SBF immersion, each solid phase was retained by filtration, soaked in acetone to quench the surface reactions and washed with water, after which it was vacuum-dried at 37 °C for several days. The SBF-soaked specimens will be denoted S90-τSBF, S85-τSBF, and S58-τSBF, with the immersion period τSBF specified either in hours (h) or days (d).The solution accompanying each solid MBG-τSBF phase was analyzed as follows: the pH value was determined as the average of three measurements by using an Ilyte system with ion-selective electrodes specific for Na+, K+, and Ca2+. The concentrations of Si, Ca, and P were analyzed by inductively coupled plasma/optical emission spectrometry (ICP/OES) with a Perkin Elmer OPTIMA 3300 DV instrument. Three analyses were performed per solution and element, from which each average value and standard deviation were calculated.
The cation composition of each pristine S90, S85, and S58 MBG specimen was determined by X-ray fluorescence (XRF) spectroscopy, using a Philips PANalytical AXIOS spectrometer (Philips Electronics NV), and X-rays generated by the Rh Kα line at λ = 61.4 pm. The as-analyzed weight percentages of the (Si, Ca, P) elements were converted into the charge-balanced stoichiometric compositions listed in Table 1. The minor hydrogen content of each specimen was not accounted for; it mainly consists of physisorbed water molecules and to a lesser extent silanol (SiOH) surface groups.22,26,28 Except for some losses of P, an overall good agreement was observed between the batched and analyzed compositions, as well as with our previously reported results from MBG samples of nominally identical compositions and preparation conditions.23,26 However, while the corresponding XRF analyses of the SBF-exposed samples appeared to be reliable for short immersion intervals up to a few hours (as assessed against other constraints from 31P NMR and the ICP/OES-determined cation concentrations of the accompanying solutions), systematic errors in the XRF-analyses of the solid phases were evident for τSBF ≳ 24 h. Consequently, a more reliable estimate of each MBG-τSBF composition was obtained as follows: the ICP/OES-determined stoichiometric amounts of Si, Ca, and P present in the accompanying solution at the given immersion interval were combined with the XRF-analyzed cation contents of the corresponding pristine MBG specimens listed in Table 1; this information together with eqn (2) allowed us to determine the stoichiometric composition of the solid MBG-τSBF phase.
2.3 Powder X-ray diffraction
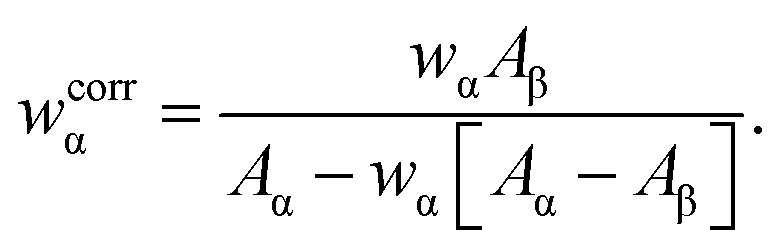
Powder X-ray diffraction patterns were recorded with Cu Kα radiation (λ = 154.1 pm), using a PANalytical X'Pert PRO MPD diffractometer equipped with an X'Celerator detector. The powders were dispersed on zero-background Si plates and the diffractograms were collected using variable slits and 4 cm2 irradiated area in the 2θ-range of 10–80° for a total time of 12 h.The fractions of crystalline HCA present in the SBF-exposed S58/S85/S90 samples were estimated by using the Rietveld method and the FullProf program,29 and assuming that the in vitro-formed nanocrystalline HCA phase (here labeled “α”) conforms to the ideal stoichiometric calcium hydroxyapatite composition (HAp), Ca5(PO4)3(OH). The apparent weight fraction of HCA (wα) was obtained by dividing refined scale factors for the samples by that of a crystalline HAp reference sample, denoted “HAref”, which was purchased from Aldrich and used as received. These apparent fractions were then corrected according to ref. 30, in order to account for the distinct X-ray mass absorption coefficient of HAp [Aα ≡ (μ/ρ)α] and that of the remaining amorphous phases (β) of the sample [Aβ ≡ (μ/ρ)β], where μ denotes the linear absorption coefficient and ρ is the density of the sample:
 | (1) |
The accuracy of the estimated relative HCA/ACP fractions are primarily limited by the uncertainties of the analyzed sample compositions and how well the as-assumed stoichiometric composition of HAp approximates that of the real carbon-bearing HCA structure, which also comprises minor amounts of other ions, such as Na+, K+, and Mg2+.1 By using data from ref. 31, the mass absorption coefficients of HAp and SiO2 were estimated as 86.4 cm2 g−1 and 35.9 cm2 g−1, respectively. For the present samples, the estimates of Aβ did not vary significantly with either the particular S58/S85/S90 MBG-τSBF specimen or the SBF-exposure interval, amounting in values of ≈45 cm2 g−1, ≈40 cm2 g−1, and ≈40 cm2 g−1 for the S58, S85, and S90 deriving MBGs, respectively. Hence, the marginally larger values than that for vitreous SiO2 suggests that all amorphous components of the SBF-soaked specimens are dominated by an MBG phase that is almost completely leached with respect to Ca and P.
2.4 Solid-state 31P NMR
All magic-angle spinning (MAS) NMR experimentation was performed at 9.4 T using a Bruker Avance-III spectrometer. Powders of the MBG-τSBF specimens were packed in 7 mm zirconia rotors and spun at 7.00 kHz. 31P MAS NMR spectra were obtained by 90° excitation pulses operating at a nutation frequency of νP ≈ 60 kHz. Typical relaxation delays were in the range of 300–900 s (≈2000 s for the pristine MBG samples) and were selected to ensure a fully quantitative NMR spectrum from each specimen; 16–128 and 1000–1500 signal transients were accumulated for MBG-τSBF samples with high (τSBF > 24 h) and low (0.25 h ≤ τSBF ≲ 24 h) P contents, respectively. We first verified that application of high-power 1H decoupling did not affect the 31P NMR peak-widths perceptibly, and all subsequent experimentation was performed without 1H decoupling. No signal apodization was employed in the data processing. 31P chemical shifts are quoted relative to 85% H3PO4(aq). The 31P MAS NMR data from the HAref sample was reproduced from Gunawidjaja et al.233 Results
3.1 Cation release in SBF
Fig. 1(a) shows the variation of pH in the SBF solution after exposing 600 mg of each MBG specimen in 1 L of SBF for periods between 15 minutes and 30 days. The three S58, S90 and S85 series reveal the same trend: their respective pH values raise rapidly but only marginally from 7.38 to 7.62, 7.51, and 7.48 during the first 15 minutes, the elevation being roughly proportional to the Ca content of the MBG (see Table 1). The pH then stays relatively constant throughout the remaining of the soaking period, except for a decrease observed beyond ≈24–72 h, which however is only significant for the S85 series. | ||
| Fig. 1 Variations of (a) the pH-value, and the concentrations of (b) Si, (d) Ca, and (f) P after soaking the as-indicated S90/S85/S58 MBG series for increasing time periods (τSBF). Dotted horizontal lines in (a, d, and f) mark the respective initial pH/concentration in the SBF solution (τSBF = 0). (c, e, and g) The fraction of the total (c) Si, (e) Ca, and (g) P reservoir present in the solution for the as-indicated MBG specimen and immersion interval [see eqn (2)]. Each dotted horizontal line in (c, e and g) represents the respective fraction at τSBF = 0 that is accommodated in the SBF out of the total amount of element E for the given MBG series; S90 (black), S85 (red), and S58 (green). Note the logarithmic horizontal scale. Data uncertainties are around the size of the symbols. | ||
Fig. 1(b), (d), and (f) plot the concentrations of Si, Ca, and P, whereas Fig. 1(c), (e), and (g) display the respective fraction of the total amount of each element present in the solution after the soaking [ysoln(E)], with the remaining partitioned among two heterogeneous solid phases, i.e., the ion-leached MBG and the biomimetic phosphate layer:
| ysoln(E) = nsolnE(τSBF)/[nSBFE(τSBF = 0) + nMBGE]. | (2) |
Each horizontal dotted line in Fig. 1(e) and (g) marks the contribution from the SBF solution to the total Ca and P reservoirs, revealing that ≈71% of the entire amount of Ca originates from the SBF for the mixtures involving the S90 and S85 MBGs [Fig. 1(e)]. For the Ca-rich S58 specimen, on the other hand, only 42% of the total Ca reservoir derives from the SBF solution, i.e., the majority stems from the leached MBG. The corresponding SBF contributions to the total amount of P is 100%, 64%, and 54% for S90, S85, and S58, respectively [Fig. 1(g)]. As discussed further in Sections 3.4 and 4.2, the distinct overall contributions from each MBG powder to the total Ca and P reservoirs have bearings for the amounts of HCA formed within each SBF-soaked S58/S85/S90 series, and thereby also the assessments of their relative “in vitro bioactivity”.
Fig. 1(b) reveals an increasing concentration of Si in the aqueous medium during the first 3 days (72 h) of the gradual degradation of each MBG specimen over the 30 days of immersion, whereupon [Si] saturates at ≈2.2 mmol L−1 (≈62 mg L−1), in accordance with previous in vitro tests of (M)BGs in SBF.6,23,32 The two SiO2-rich S85 and S90 specimens manifest very similar dissolution characteristics [Fig. 1(c)], amounting to a net dissolution of 24–27% of the total Si content of the MBG after 30 days of SBF exposure. In contrast, owing to its more fragmented silicate network,26 the Ca-rich S58 pore-walls reveal a higher degree of degradation, with ≈39% of its entire Si content residing in the solution after 30 days.
Next considering the leaching of Ca2+ [Fig. 1(d)] that accompanies the raise in pH, all MBGs exhibit a very fast release already during the first 15 minutes of SBF immersion (notably so the Ca-rich S58 specimen), followed by a plateau of nearly constant [Ca] at ≈3.5 mmol L−1 (S90 and S85) and ≈5.0 mmol L−1 (S58) up to 8 h (4 h for S90). Then a sharper drop of the [Ca] is observed after 8 h for the S58/S85 samples, whereas this reduction occurs already between 4–8 h for the S90 MBG. Throughout the remaining of the immersion period, the Ca concentration diminishes steadily. After around 1 week, the solutions associated with the soaking of S90 and S85 feature a lower [Ca] than the value of the initial SBF [Fig. 1(d)], while the concentration during the immersion of S58 consistently remain above that at τSBF = 0.
Concerning the SBF immersion of the Ca-poor S85/S90 specimens, the trends observed for [P] in Fig. 1(f) and (g) overall mirror those for [Ca] in Fig. 1(d) and (e): S85 releases nearly all of its P content during the first 15 minutes, whereupon the [P] remains constant up to 8 h, and thereafter drops steeply. As for the concentration of Ca, the soaking of S90 is associated with an earlier drop of the [P] in the solution at τSBF = 8 h. As demonstrated in Section 3.3, the steep reductions in [Ca] and [P] coincide with the onset of HCA crystallization. We note that the spread of values among three independent ICP measurements for each of [Si], [Ca], and [P] concentration are around the symbol sizes in Fig. 1(b), (d), and (f): consequently, since the S90 structure is free of P, the initially observed values [P] > 1 mmol L−1 and ysoln(P) > 1 in Fig. 1(d) and (e) reflect systematic measurement errors of [P]. Such systematic errors were approximately accounted for when deriving the uncertainty of the composition of each solid phase (discussed in Section 3.2).
For the solutions resulting from immersion of the Ca-rich S58 MBG, the trends for P in Fig. 1(f) and (g) differ markedly from those of Ca in Fig. 1(d) and (e): for all intervals τSBF > 0, a lower P concentration is observed relative to that in the initial SBF solution, suggesting that although the S58 structure leaches Ca2+ rapidly during the first 15 minutes, there is nevertheless a net uptake of phosphate ions into the S58-τSBF solid phases. This must imply a minor formation of (presumably) Ca-deficient ACP during the first few hours of S58-exposure to the SBF, as opposed to the case of S85 that reveals a concurrent release of both Ca2+ and PO3−4 ions to the solution at the earliest SBF-immersion stages. Nevertheless, between 3 and 30 days, the solutions accompanying each distinct S58/S85/S90-deriving solid phase become continuously depleted in P, which for the S58-τSBF series implies that the entire P reservoir resides in the solid phase after 30 days; see Fig. 1(g).
3.2 Composition of each solid MBG-τSBF phase
We now focus on the composition of each solid phase that coexists with the solution at a given τSBF interval. Fig. 2(a), (c), and (e) plot the respective molar fractions of Si, Ca, and P, normalized such that xSi + xCa + xP = 1. The right panel displays the ratio of the fractions of Si, Ca, and P present in each solid phase at a given SBF-immersion period relative to that of the pristine MBG, i.e., the ratio xE(MBG-τSBF)/xE(MBG), where E = {Ca, Si, P}: this is henceforth referred to as the “relative uptake of E”. As expected from the complementary scenario for the concentration of each respective element present in the solution, Fig. 2 reveals a consistent decrease in xSi over the entire soaking period, accompanied by increased values of {xCa, xP} that are associated with the emergence of an amorphous calcium phosphate layer after a few hours (note that the larger-than-unity “uptakes of Si” in Fig. 2(b) simply reflect the continuous leaching of Si from the solid phases). | ||
| Fig. 2 (a, c, e) Molar fraction xE of (a) Si, (c) Ca, and (e) P present in the solid phase at the given SBF-immersion interval and MBG series, where the data associated with S90, S85, and S58 are plotted in black, red, and green color, respectively. Note that the molar fraction xE = nE/(nCa + nSi + nP) is here defined out of all cations. The dotted horizontal lines mark the respective contribution from the pristine MBG. (b, d, f) The relative uptake of (b) Si, (d) Ca, and (f) P of each MBG-τSBF specimen compared with its pristine counterpart: xE(MBG-τSBF)/xE(MBG). (g) The molar ratio between Ca and P, nCa/nP = xCa/xP. The dotted horizontal line at xCa/xP = 1.67 represents the value for stoichiometric HAp [Ca5(PO4)3OH]. The error bar of each xE-value and relative uptake are as indicated for the corresponding S85-deriving data set. | ||
The previously highlighted distinct release/uptake trends of Ca and P of the S58 specimen relative to its S90 and S85 counterparts also manifest clearly in Fig. 2(c)–(f): the latter two MBGs release all/most of their Ca reservoirs after 15–60 minutes, while for the case of S85, most of its P content is also completely leached. This implies that the biomimetic ACP/HCA components accounts for (nearly) all P and Ca present in these solid phases after 8 h (for S90) and 24 h (S85), with the remainings of the MBG constituting essentially pure SiO2. The situation for S58 is very different: despite a quick Ca release occurring during the first 15 minutes, a large fraction (≈40%) of the Ca reservoir remains in the S58-0.25h structure. Next follows a continuous accumulation of Ca in the solid S58-τSBF phases over all the remaining SBF immersion period. On the other hand, the uptake of P occurs stepwise, where xP is almost doubled after 15 minutes, whereupon it remains nearly constant out to 24 h, when it elevates again such that the P content of the S58-1d specimen is ≈2.7 times that of the pristine S58 sample; see Fig. 2(e) and (f). The corresponding relative uptake for S85-1d only amounts to ≈1.6. Altogether, after 30 days of immersion, both the S85-30d and S58-30d solid phases comprise ≈2.5 times higher P content relative to each respective pristine MBG (that for the case of S58-30d implies an effectively lowered value compared with the result at τSBF = 24 h).
Finally considering the limiting molar ratios nCa/nP of Ca and P in each MBG-stemming sample at the longest immersion intervals τSBF ≥ 7 days shown in Fig. 2(g), they amount to ≈1.8 (for S90), ≈1.5–1.7 (S85), and ≈1.6–1.85 (S58). Noteworthy, these values scatter around the stoichiometric ratio expected for hydroxyapatite (nCa/nP = 1.667), although it is only for the S90/S85-deriving samples—which initially exhibited a nearly complete release of both Ca and P for short τSBF periods—where these nCa/nP-values translate directly into the corresponding compositions of the biomimetic phosphate layer.
3.3 Qualitative assessments of HCA formation by PXRD and 31P NMR
Fig. 3 presents the sets of powder diffractograms recorded from each MBG-τSBF series. For τSBF ≤ 8 h, they exhibit no signatures of crystalline phases. However, the onset of HCA crystallization is clearly evidenced after 24 h of SBF immersion for all S90/S85/S58 MBG compositions, whose diffractograms reveal the characteristic patterns of HAp. A continuous HCA growth occurs for increasing the SBF-soaking intervals, whereas at a fixed τSBF-value, the XRD data suggests that the HCA content increases along the series S90 < S85 < S58, i.e., that the MBG richest in Ca and P produces the largest amount of HCA. | ||
| Fig. 3 X-ray diffractograms recorded from powders of the as-indicated MBG-τSBF samples with the SBF immersion interval increasing from bottom to top. All sharp diffraction peaks stem from the in vitro-formed HCA. | ||
Fig. 4 displays 31P MAS NMR spectra recorded by single pulses from the pristine (a) S58 and (b) S85 specimens, as well as from the corresponding SBF-exposed samples for increasing τSBF values. The results from the S90-τSBF series are shown in (c). As typically observed from orthophosphate groups in amorphous phases, the NMR signals from each parent MBG specimen are essentially Gaussian-shaped and broad (≈6.2 ppm full-width at half maximum height; implying ≈1000 Hz at B0 = 9.4 T). As discussed in our previous work,9,22,25,28,33,34 P is present as nm-sized amorphous calcium phosphate (CaP) clusters dispersed across the main silicate pore-wall component. The CaP clusters are larger in the S85 MBG relative to those of S58 (ref. 33 and 34) and exhibit many structural similarities to bulk amorphous calcium phosphate (ACP).25 The 31P NMR peak observed from S58 and S85 is slightly tailed towards lower shifts (as indicated by the shaded areas in Fig. 4); this resonance stems from minor amounts of surface-associated P–O–Si moieties28 that rapidly dissolves on SBF exposure [see Fig. 4(a, b) and S1 of the ESI†].
 | ||
| Fig. 4 31P MAS NMR spectra recorded from powders of the (a) S58, (b) S85, and (c) S90 MBG specimens before and after exposure to SBF for the as-indicated intervals. The NMR peak-narrowing for increasing τSBF reflects the formation of nano-crystalline HCA. The result from a sample of crystalline hydroxyapatite, “HAref”, is also displayed in (c). Note that since the S90 MBG is devoid of P, all 31P NMR signals detected from the S90-τSBF phases stem from the biomimetic phosphate layer. | ||
While no significant changes occur in the 31P NMR peak maxima throughout the SBF exposure, a pronounced peak-narrowing results when τSBF is increased (Fig. 4 and S1†), signifying the concurrent growth of an ordered phosphate phase, i.e., nano-crystalline HCA. Hence, each 31P NMR response stems from two distinct 31P sources of the SBF-treated specimens: one ordered phase (HCA) coexisting with an amorphous counterpart. For τSBF ≥ 8 h, the latter derives exclusively from the ACP component of the biomimetic calcium (ortho)-phosphate layer in the cases of the S85 and S90 specimens, whose structures were completely depleted in Ca and P over the first 4 h of soaking (see Fig. 1 and 2). In contrast, for the series of SBF-soaked S58 samples, non-negligible amounts of CaP clusters remain in the MBG that also contributes to the 31P resonances in Fig. 4(a). Owing to the nearly identical 31P NMR responses of the CaP clusters and biomimetic ACP,22,25 these two amorphous calcium phosphate components cannot be probed separately by NMR. While revealing markedly more ordered orthophosphate environments than its ACP counterpart, the biomimetic apatite phase remains nano-crystalline and is known to exhibit structural disorder from the incorporation of additional ion species, such as Na+, Mg2+, and CO2−3.1,22 For reference, Fig. 4(c) also includes NMR data recorded from the crystalline hydroxyapatite reference specimen (“HAref”) that produces a Lorentzian-shaped and markedly narrower 31P NMR peak compared with those from the MBG-τSBF samples.
3.4 Quantifying the HCA/ACP components
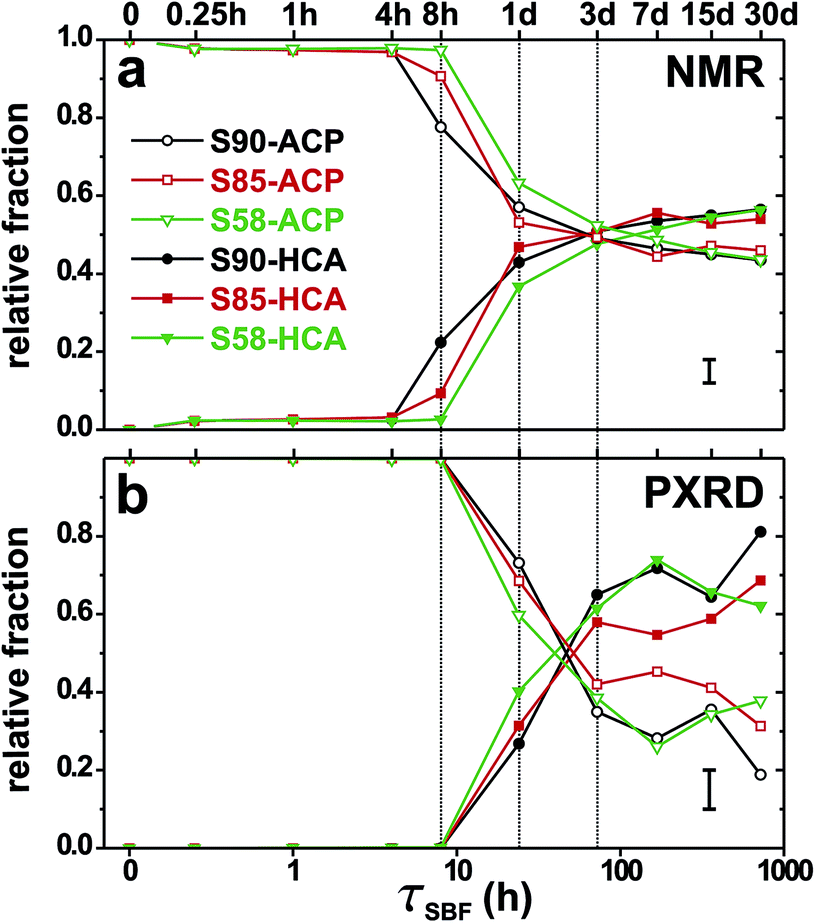
The resulting molar fractions of HCA (xHCA) and ACP (xACP) obtained from either 31P NMR or PXRD are plotted in Fig. 5(a) and (b), respectively, for each MBG-τSBF series and increasing τSBF-values. Note the normalization xHCA + xACP = 1 for each MBG-τSBF sample. An overall good agreement is observed between the estimates from the two techniques. Both verify a rapid HCA growth starting around 8 h (assessed by NMR) or 24 h (from XRD) and quickly reaching ≈50% (NMR) and ≳60% (XRD) of HCA out of the total phosphate layer after ≈72 h. Fig. 5(b) reveals that nanocrystalline HCA accounts for around 50–80% of the biomimetic phosphate layer at SBF immersion intervals beyond 1 week.
 | ||
| Fig. 5 Relative fractions of ACP (open symbols) and HCA (solid symbols) estimated by (a) 31P NMR and (b) PXRD, and plotted against τSBF for the as-indicated S90 (black), S85 (red), and S58 (green) series of SBF-soaked samples. Note the logarithmic horizontal scale. Typical uncertainties of the data are indicated by the error bar at the bottom right part of each diagram. | ||
The longer-term ACP → HCA conversion constitutes the main qualitative discrepancy between the inferences from NMR and XRD. The NMR-derived HCA fractions manifest very similar trends among all three MBG series and SBF-immersion intervals τSBF ≳ 7 days, where ≈55% of the total P content is present in the ordered HCA phase; see Fig. 5(a). In contrast, the XRD-derived apatite fraction grows continuously as τSBF is increased, except for the S58-τSBF series for which an optimum value xHCA ≈ 0.74 is observed for S58-7d, whereupon the relative amount of HCA decreases. This perhaps counterintuitive effect stems from the depletion of phosphate groups in the solution during the later MBG-soaking stages; see Fig. 1(f) and (g). Insufficient concentrations of P in the aqueous medium was shown previously to impede the ACP → HCA conversion.16 Similar observations were made by us in an earlier SBF-soaking study of the same three MBG series as those herein but employing a significantly higher MBG concentration in the aqueous medium23 (see Section 4.2).
![[thin space (1/6-em)]](https://www.rsc.org/images/entities/char_2009.gif) :1.39:2.28. Identical trends are observed if instead considering the corresponding weight fractions of HCA (not shown). Hence, the in vitro bioactivity enhances concurrently with increasing amounts of Ca and P in each pristine MBG: their Ca contents relate as 1.00:1.64:2.84 for the S90, S85, and S58 specimens, respectively, while the P counterparts are 1.00 (S85):1.28 (S58). Note, however, that the HCA fraction of each MBG-τSBF sample also depends implicitly on the degradation degree of the silicate network during the SBF immersion: from Fig. 1(c) follows that ≈39%, ≈27%, and ≈24% of the total Si reservoirs of the S58, S85, and S90 structures have dissolved, respectively, at the τSBF-value that optimizes the HCA content. If the comparatively higher Si release from the S58 MBG is accounted for (that in the scenario of equal HCA contents among the distinct MBGs would lead to an apparently higher relative HCA fraction out of all S58-associated solid phases), the estimated relative HCA fractions of the S90:S85:S58 series (1.00:1.39:2.28) become 1.00:1.34:1.85. Consequently, the S58 structure forms a higher amount of HCA than the S85/S90 MBGs and also converts more completely into HCA on SBF exposure.
:1.39:2.28. Identical trends are observed if instead considering the corresponding weight fractions of HCA (not shown). Hence, the in vitro bioactivity enhances concurrently with increasing amounts of Ca and P in each pristine MBG: their Ca contents relate as 1.00:1.64:2.84 for the S90, S85, and S58 specimens, respectively, while the P counterparts are 1.00 (S85):1.28 (S58). Note, however, that the HCA fraction of each MBG-τSBF sample also depends implicitly on the degradation degree of the silicate network during the SBF immersion: from Fig. 1(c) follows that ≈39%, ≈27%, and ≈24% of the total Si reservoirs of the S58, S85, and S90 structures have dissolved, respectively, at the τSBF-value that optimizes the HCA content. If the comparatively higher Si release from the S58 MBG is accounted for (that in the scenario of equal HCA contents among the distinct MBGs would lead to an apparently higher relative HCA fraction out of all S58-associated solid phases), the estimated relative HCA fractions of the S90:S85:S58 series (1.00:1.39:2.28) become 1.00:1.34:1.85. Consequently, the S58 structure forms a higher amount of HCA than the S85/S90 MBGs and also converts more completely into HCA on SBF exposure.
 | ||
| Fig. 6 XRD-derived molar fraction of the biomimetic HCA (out of the net composition of the solid phases) plotted against τSBF for each as-indicated series of S90/S85/S58 samples. | ||
After having discussed the relative (stoichiometric) amounts of P present in the HCA and ACP phases, respectively (Fig. 5), and the relative molar content of HCA out of each MBG-τSBF specimen (Fig. 6), we consider the partitioning of P and Ca in the amorphous (ACP) and crystalline (HCA) components of each solid phase. This XRD-derived information is provided in Fig. 7, which displays the atomic fractions of P (xP) and Ca (xCa) in the top and bottom panels, respectively. Note that xP and xCa are here defined with respect to all atom species, including oxygen: xE = nE/(nCa + nSi + nP + nO), in contrast to the complementary data in Fig. 2 that concerned the molar fractions with respect to solely the cations (Ca, Si, P). Each black curve in Fig. 7 represents the total atomic fraction of P (a–c) or Ca (d–f) in the solid; xE(tot) = xE(ACP) + xE(HCA), with E = {P, Ca}. Note that for τSBF ≤ 8 h, the entire P reservoir resides in ACP. The previously highlighted initiation of the ACP → HCA crystallization ≈24 h is here witnessed by the forking of each curve for xP(tot) [Fig. 7(a)–(c)] and xCa(tot) [Fig. 7(d)–(f)] into an xE(ACP) contribution that is accompanied by the emergence of a progressively growing HCA phase quantified by xE(HCA).
 | ||
| Fig. 7 Total atomic fraction xE of (a–c) P and (d–f) Ca in each solid MBG-τSBF phase (black traces), shown together with the XRD-derived partitioning of each respective element in ACP (red traces) and HCA (green traces). xE = nE/(nCa + nSi + nP + nO). | ||
Consistent with the results of Fig. 5, the fraction of the total P content deposited as HCA reaches beyond that of the amorphous phase for τSBF ≥ 72 h. The data of Fig. 7 indicates two continuous and concurrent growth processes: ACP formation on the one hand, and ACP → HCA crystallization on the other. Only for the case of S90 [Fig. 7(c) and (f)], clear evidence is provided for a significant reservoir of ACP first being accumulated at τSBF = 8 h prior to the onset of HCA formation (τSBF = 24 h). However, it is likely that analogous trends prevail also during the soaking of the P-bearing S85 and (particularly) S58 specimens. As already commented, the “ACP” phase detected in each S58-τSBF specimen carries non-negligible contributions from the amorphous CaP clusters of the MBG, while the data of Fig. 1(f, g) and 2(e, f) strongly suggest the presence of significant ACP deposits already after 15 minutes of SBF-exposure.
4 Discussion
4.1 Composition-bioactivity trends
Both 31P MAS NMR and PXRD evidence significant HCA deposits at the surfaces of all three MBG specimens at 24 h of SBF immersion (Fig. 5). Although the powder diffractograms reveal no signatures of HCA formation before 24 h, already after 8 h the NMR data suggest ≈22% and 9% of HCA out of the biomimetic calcium phosphate layers at the S90 and S85 surfaces, respectively. This apparent discrepancy likely stems from poorly ordered nm-sized HCA crystallites that escape detection by XRD. The overall highest XRD-derived HCA fractions are 81% (after 30 days), 69% (30 days), and 74% (7 days) for the S90, S85, and S58 series, respectively, whereas the corresponding estimates by NMR are all ≈55% for τSBF ≥ 7 d.Considering the highest observed relative amounts of HCA out of the entire MBG-τSBF solid phase, the S58-7d specimen reveals 2.28 (1.85) and 1.64 (1.34) times higher HCA contents than its S90-30d and S85-30d counterparts, respectively, where the numbers in parentheses correct for the differences of Si release among the samples; see Section 3.4.2 and Fig. 1 and 6. Consequently, the in vitro bioactivity enhances according to S90 < S85 < S58, meaning that the amount of HCA correlates with an increase of the Ca and P contents of each pristine MBG (or, equivalently, with decreasing Si content35,36). Two inferences are noteworthy: (i) this trend mirrors that established for melt-prepared BGs in that the bioactivity generally enhances when the P content of the glass is increased (up to ≲6 mol% P2O5);14,37,38 the concurrent bioactivity-growth for increasing P content was recently suggested to be monotonic, provided that P is present as readily released orthophosphate ions.39 The latter condition is obeyed for the MBGs;26,28 see Fig. 4. (ii) Whereas the HCA formation clearly depends on the MBG composition, the mesoporous arrangement and/or the surface area of the MBG (Table 1) correlate neither with the time-point when HCA starts crystallizing nor with the amount of HCA subsequently formed. Incidentally, the highest HCA deposits occur for the S58 specimen associated with lowest surface area (195 m2 g−1). This effect must imply that all parent MBGs exhibit silicate networks exposed sufficiently well to the solution that the precise total surface area becomes immaterial.
Somewhat intriguing, however, is that although the bioactivity trends observed herein overall agree with earlier reports from sol–gel glasses [whose degradation and HCA formation increases (decreases) with the Ca (Si) content35,36], it differs markedly from those inferred previously for MBGs,5–9,23 where the formation rate of HCA and its amount deposited was maximized for MBGs with ≈80–85 mol% SiO2 and then decreasing as the SiO2 content was increased.5,7,8 Besides that previous bioactivity-composition evaluations (as assessed from FTIR and/or electron microscopy) were of qualitative nature, these apparent discrepancies originate from very different MBG loadings in the SBF solution. The choice of (M)BG concentration for the bioactivity testing have profound bearings for the HCA formation, which generally diminishes as the (M)BG concentration is increased.15,16 While Yan et al.5,6 utilized reasonably low ratios mMBG/V = 1.0 g L−1 (where mMBG denotes the mass of the MBG powder and V is the SBF-volume), the corresponding MBG-loadings utilized by us in previous work were significantly higher, ranging from mMBG/V ≈ 4–5 g L−1 (ref. 7 and 8) to 20 g L−1 in more recent work.9,22,23 As discussed by Gunawidjaja et al.,23 the latter condition quenched the HCA formation completely in the case of S58, such that no HCA was detected by PXRD even over prolonged SBF-exposure intervals up to 7 days, while the 31P NMR peak-width only revealed an insignificant narrowing. Similar NMR/PXRD responses were observed for the S90 MBG at the high mMBG/V = 20 g L−1 loading (not shown), whereas it did not exhibit the characteristic “peak-splitting” for orthophosphate species in FTIR spectra.9 Under the same in vitro conditions, the highly bioactive S85 counterpart manifested a markedly delayed onset of HCA formation compared with previous reports that utilized lower MBG concentrations in the bioactivity assessments.7,8
4.2 The importance of the bioactivity assessment conditions
The apparently reduced HCA formation at high MBG loadings in the SBF may be understood from an insufficient P reservoir in the aqueous medium, coupled with the large surface area of the mesoporous material:16 the very rapid leaching of Ca2+ ions from the powder initiates a substantial ACP formation at the pore-surface due to local supersaturation. Consequently, the entire P content becomes incorporated into the ACP phase, leaving an insufficient number of phosphate ions in the solution to allow for a further ACP growth—and most important—the subsequent ACP → HCA crystallization stage.16 Note that the effects of the HCA crystallization process from using too high m/V ratios are more detrimental for MBGs than for their melt-prepared BG counterparts that feature significantly lower surface areas and thereby a more limited number of nucleation sites for the ACP/HCA growth. Hence, the inherent advantage of the ordered mesoporous structure then merely becomes a severe shortcoming that may completely alter the outcome of the bioactivity assessment.Even under the markedly more dilute mMBG/V = 0.6 g L−1 condition utilized herein compared to the previous ones of 4–20 g L−1,7–9,22,23 there are indications from the S58-soaking that insufficient amounts of P in the solution hampered the HCA growth; note that the reduction of the HCA fraction for τSBF ≥ 15 days in Fig. 6 coincides with a nearly total depletion of P in the SBF [see Fig. 1(f) and (g)]. Notably, the very rapid ACP formation accompanying the essentially instantaneous release of Ca from the S58 MBG (on its immersion into the solution) is clearly witnessed in Fig. 2(e) and (f) by an increased P content of the solid phase already after 15 minutes. This also rationalizes previous observations7 that the ACP formation accelerates for a decreasing Si content and an accompanying elevated Ca content of the pristine MBG, while the ACP → HCA conversion exhibits the reverse MBG-composition trend.5,7
The critical aspects highlighted by Yan et al.16 and Gunawidjaja et al.,23 as well as herein, regarding the choice of concentration of any porous material (vide infra) raises serious concerns about the implementation of SBF testing of powders under non-flowing conditions of the aqueous medium. A circulating and constantly replenished solution40–42 largely circumvents the problems of insufficient P (or Ca) amounts available for the (unrestricted) generation of ACP and its subsequent crystallization into HCA, thereby emulating the real in vivo scenario more faithfully. However, such testing conditions are more cumbersome to arrange, particularly if a large series of (M)BGs are to be evaluated. As criticized previously,32,42 the prevailing ISO standard43 implements a constant surface area of the biomaterial relative to the solution unit volume and was specifically developed for in vitro bioactivity testing of bulk samples, as opposed to powders, and notably not those exhibiting a large internal surface area. For these reasons, a new standard was recently proposed that recommends using a constant m/V-value, equivalent to a (relatively high) loading of 1.5 g L−1.32 Also this option will often prove unsuitable for assessments of Ca-rich and readily degradable (M)BGs, as the ACP → HCA crystallization will eventually be compromised for longer immersion intervals, unless the SBF solution is replenished regularly, which may potentially interfere with the test result and thereby introducing additional undesirable precautions.
A major flaw of all hitherto proposed in vitro testing protocols is their ignorance of the potential complications arising from the (M)BG composition when selecting the m/V ratio. The insight into the relative importance of each factor affecting the in vitro HCA formation (such as the composition, textural properties, and particle size of the biomaterial15–17,36,42,44–46)—and particularly the understanding of their complex interplay—is currently insufficient. Hence, it may simply be premature to attempt at defining any “universal” standard testing protocol, but merely aim at settling the most sensible and practically feasible conditions for each given series of assessments, then giving priority to selecting a constant m/V ratio throughout, such that sufficient amounts of Ca and P are available for an unrestricted HCA growth for all samples tested. We reiterate the suggestion by Gunawidjaja et al.:23 a presumably optimal in vitro evaluation is arranged when the Ca2+ and PO3−4 contents initially present in the aqueous medium (far) exceed the corresponding Ca2+/PO3−4 reservoirs of the biomaterial itself. In practice, this implies that the fluid must incorporate a sufficiently large amount of phosphate ions to (at least) match the stoichiometric equivalent of the Ca2+ species leached from the bulk solid/powder. Notably, provided that the cation concentrations in the solution are available at each sampled τSBF value, an anomalous HCA crystallization may be suspected whenever [P] approaches zero [e.g., see Fig. 1(f)].
Although the more dilute conditions the better (except for an infinite dilution when readily dissolved materials will disintegrate completely before HCA is deposited), the obvious drawback with too low m/V-ratios is that an impractically large solution volume is required to produce a large mass of the SBF-exposed solid material (≳200 mg), such as that demanded for the quantitative NMR/XRD analyses employed in the current work.
5 Conclusions
Solid-state 31P NMR and PXRD were employed to quantify the relative fractions of ACP and HCA forming at the surfaces of three MBGs of variable Si, Ca, and P contents, thereby allowing for a detailed quantitative insight into the ACP → HCA conversion. The PXRD data together with measured concentrations of Ca, Si and P in the solution was used to estimate the amount of HCA present in each solid specimen after the SBF treatment, as well as the composition of the remaining cation-depleted MBG phase.Although HCA started forming at equal SBF-immersion intervals (∼24 h) among all three MBGs, the amount of HCA increased concurrently with the Ca and P contents of the MBGs according to S90 < S85 < S58. This trend is at odds with previous inferences about the in vitro bioactivity from MBGs of similar/identical compositions,7–9,22,23 but was rationalized as stemming from a too high MBG loading in the SBF solution (i.e., too high m/V ratio) employed in previous tests. Notably, the surface areas of the present MBGs are sufficiently large that no correlation was observed between the surface area and the HCA formation rate or/and the resulting amount of HCA.
We highlighted the importance of adapting the m/V ratio to the composition of the biomaterial (vide infra), where the in vitro evaluation must invoke a sufficiently large SBF volume such that its Ca2+ and PO3−4 reservoirs exceed those of the biomaterial itself. This condition is not necessarily met if employing hitherto ISO-standard protocols for bioactivity testing in SBF. Considering the currently modest insight into the complex interplay of the various factors affecting the HCA growth, we suggest to adapt the particular testing condition of a given series of biomaterials such that a sufficiently large phosphate reservoir is available to allow for an unrestricted HCA formation from each specimen. Tendencies of anomalous HCA crystallization may be suspected whenever the phosphate concentration in the solution approaches zero.
Acknowledgements
This work was supported by the Swedish Research Council (projects VR-NT 2010-4943; 2014-4667), the Faculty of Natural Sciences at Stockholm University, Ministerio de Ciencia e Innovación (project MAT2012-35556), Ministerio de Economía y Competitividad (project MAT2013-43299-R) and Agening Network of Excellence (CSO2010-11384-E). C. T.-I. was supported by a postdoctoral grant from the Carl Trygger Foundation. We gratefully acknowledge NMR equipment Grants from the Swedish Research Council, and the Knut and Alice Wallenberg Foundation. We thank Renny Mathew for experimental help.References
- L. L. Hench, J. Am. Ceram. Soc., 1991, 74, 1487–1510 CrossRef CAS PubMed.
- L. L. Hench and J. M. Polak, Science, 2002, 295, 1014–1017 CrossRef CAS PubMed.
- M. Vallet-Regí, C. V. Ragel and A. J. Salinas, Eur. J. Inorg. Chem., 2003, 1029–1042 CrossRef PubMed.
- C. J. Brinker, Y. Lu, A. Sellinger and H. Fan, Adv. Mater., 1999, 11, 579–585 CrossRef CAS.
- X. X. Yan, C. Z. Yu, X. F. Zhou, J. W. Tang and D. Y. Zhao, Angew. Chem., Int. Ed., 2004, 43, 5980–5984 CrossRef CAS PubMed.
- X. Yan, X. Huang, C. Yu, H. Deng, Y. Wang, Z. Zhang, S. Qiao, G. Lu and D. Zhao, Biomaterials, 2006, 27, 3396–3403 CrossRef CAS PubMed.
- A. López-Noriega, D. Arcos, I. Izquierdo-Barba, Y. Sakamoto, O. Terasaki and M. Vallet-Regí, Chem. Mater., 2006, 18, 3137–3144 CrossRef.
- I. Izquierdo-Barba, D. Arcos, Y. Sakamoto, O. Terasaki, A. López-Noriega and M. Vallet-Regí, Chem. Mater., 2008, 20, 3191–3198 CrossRef CAS.
- A. García, M. Cicuéndez, I. Izquierdo-Barba, D. Arcos and M. Vallet-Regí, Chem. Mater., 2009, 21, 5474–5484 CrossRef.
- H.-S. Yun, S.-E. Kim and Y.-T. Hyun, Solid State Sci., 2008, 10, 1083–1092 CrossRef CAS PubMed.
- X. Li, X. Wang, H. Chen, P. Jiang, X. Dong and J. Shi, Chem. Mater., 2007, 19, 4322–4326 CrossRef CAS.
- H.-S. Yun, S.-E. Kim and Y.-T. Hyeon, Chem. Commun., 2007, 2139–2141 RSC.
- Y. Zhu, C. Wu, Y. Ramaswamy, E. Kockrick, P. Simon, S. Kaskel and H. Zreiqat, Microporous Mesoporous Mater., 2008, 112, 494–503 CrossRef CAS PubMed.
- C. Ohtsuki, T. Kokubo and T. Yamamuro, J. Non-Cryst. Solids, 1992, 143, 84–92 CrossRef CAS.
- J. R. Jones, P. Sepulveda and L. L. Hench, J. Biomed. Mater. Res., 2001, 58, 720–726 CrossRef CAS PubMed.
- H. Yan, K. Zhang, C. F. Blanford, L. F. Francis and A. Stein, Chem. Mater., 2001, 13, 1374–1382 CrossRef CAS.
- M. Cerruti, D. Greenspan and K. Powers, Biomaterials, 2005, 26, 1665–1674 CrossRef CAS PubMed.
- S. Hayakawa, K. Tsuru, C. Ohtsuki and A. Osaka, J. Am. Ceram. Soc., 1999, 82, 2155–2160 CrossRef CAS PubMed.
- K. S. K. Lin, Y.-H. Tseng, Y. Mou, Y.-C. Hsu, C.-M. Yang and J. C. C. Chan, Chem. Mater., 2005, 17, 4493–4501 CrossRef CAS.
- L. J. Skipper, F. E. Sowrey, R. Rashid, R. J. Newport, Z. Lin and M. E. Smith, Phys. Chem. Glasses, 2005, 46, 372–376 CAS.
- E. Dietrich, H. Oudadesse, M. le Floch, B. Bureau and T. Gloriant, Adv. Eng. Mater., 2009, 11, B98–B105 CrossRef PubMed.
- P. N. Gunawidjaja, A. Y. H. Lo, I. Izquierdo-Barba, A. García, D. Arcos, B. Stevensson, J. Grins, M. Vallet-Regí and M. Edén, J. Phys. Chem. C, 2010, 114, 19345–19356 CAS.
- P. N. Gunawidjaja, I. Izquierdo-Barba, R. Mathew, K. Jansson, A. García, J. Grins, D. Arcos, M. Vallet-Regí and M. Edén, J. Mater. Chem., 2012, 22, 7214–7223 RSC.
- M. T. Souza, M. C. Crovace, C. Schröder, H. Eckert, O. Peitl and E. D. Zanotto, J. Non-Cryst. Solids, 2013, 382, 57–65 CrossRef CAS PubMed.
- R. Mathew, P. N. Gunawidjaja, I. Izquierdo-Barba, K. Jansson, A. García, D. Arcos, M. Vallet-Regí and M. Edén, J. Phys. Chem. C, 2011, 115, 20572–20582 CAS.
- P. N. Gunawidjaja, R. Mathew, A. Y. H. Lo, I. Izquierdo-Barba, A. García, D. Arcos, M. Vallet-Regí and M. Edén, Philos. Trans. R. Soc., A, 2012, 370, 1376–1399 CrossRef CAS PubMed.
- T. Kokubo, H. Kushitani, S. Sakka, T. Kitsugi and T. Yamamuro, J. Biomed. Mater. Res., 1990, 24, 721–734 CrossRef CAS PubMed.
- E. Leonova, I. Izquierdo-Barba, D. Arcos, A. López-Noriega, N. Hedin, M. Vallet-Regí and M. Edén, J. Phys. Chem. C, 2008, 112, 5552–5562 CAS.
- J. Rodríguez-Carvajal and T. Roisnel, Newsletter, 1998, 20, 35 Search PubMed.
- V. K. Pecharsky and P. Y. Zavalij, Fundamentals of Powder Diffraction and Structural Characterization of Materials, Springer, 2nd edn, 2009 Search PubMed.
- A. J. C. Wilson, International Tables for Crystallography, Kluwer Academic Publishers, Dordrecht, 1995, vol. C Search PubMed.
- A. L. B. Maçon, T. B. Kim, E. M. Valliant, K. Goetschius, R. K. Brow, D. E. Day, A. Hoppe, A. R. Boccaccini, I. Y. Kim, C. Ohtsuki, T. Kokubo, A. Osaka, M. Vallet-Regí, D. Arcos, L. Fraile, A. J. Salinas, A. V. Teixeira, Y. Vueva, R. M. Almeida, M. Miola, C. Vitale-Brovarone, E. Verné, W. Höland and J. R. Jones, J. Mater. Sci.: Mater. Med., 2015, 26, 115 CrossRef PubMed.
- R. Mathew, C. Turdean-Ionescu, B. Stevensson, I. Izquierdo-Barba, A. García, D. Arcos, M. Vallet-Regí and M. Edén, Chem. Mater., 2013, 25, 1877–1885 CrossRef CAS.
- B. Stevensson, R. Mathew and M. Edén, J. Phys. Chem. B, 2014, 118, 8863–8876 CrossRef CAS PubMed.
- R. Li, A. E. Clark and L. L. Hench, J. Appl. Biomater., 1991, 2, 231–240 CrossRef CAS PubMed.
- D. Arcos, D. C. Greenspan and M. Vallet-Regí, J. Biomed. Mater. Res., Part A, 2003, 65, 344–351 CrossRef CAS PubMed.
- I. Lebecq, F. Désanglois, A. Leriche and C. Follet-Houttemane, J. Biomed. Mater. Res., Part A, 2007, 83, 156–168 CrossRef CAS PubMed.
- M. D. O'Donnell, S. J. Watts, R. G. Hill and R. V. Law, J. Mater. Sci.: Mater. Med., 2009, 20, 1611–1618 CrossRef PubMed.
- M. Edén, J. Non-Cryst. Solids, 2011, 357, 1595–1602 CrossRef PubMed.
- I. Izquierdo-Barba, A. J. Salinas and M. Vallet-Regí, J. Biomed. Mater. Res., 2000, 51, 191–199 CrossRef CAS.
- D. Zhang, M. Hupa, H. T. Aro and L. Hupa, Mater. Chem. Phys., 2008, 111, 497–502 CrossRef CAS PubMed.
- D. Rohanová, D. Horkavcová, A. Helebrant and A. R. Boccaccini, J. Non-Cryst. Solids, 2015 DOI:10.1016/j.jnoncrysol.2015.03.016.
- International standard ISO 23317, Implants for surgery – In vitro evaluation for apatite-forming ability of implant materials.
- P. Sepulveda, J. R. Jones and L. L. Hench, J. Biomed. Mater. Res., 2002, 61, 301–311 CrossRef CAS PubMed.
- K. Zhang, H. Yan, D. C. Bell, A. Stein and L. F. Francis, J. Biomed. Mater. Res., Part A, 2003, 66, 860–869 CrossRef PubMed.
- X. Yan, G. Wei, L. Zhao, J. Yi, H. Deng, L. Wang, G. Lu and C. Yu, Microporous Mesoporous Mater., 2010, 132, 282–289 CrossRef CAS PubMed.
- S. Brunauer, P. H. Emmett and E. Teller, J. Am. Chem. Soc., 1938, 60, 309–319 CrossRef CAS.
- S. J. Gregg and K. S. W. Sing, Adsorption, surface area, and porosity, Academic Press, London, New York, 1982 Search PubMed.
- E. P. Barrett, L. G. Joyner and P. P. Halenda, J. Am. Chem. Soc., 1951, 73, 373–380 CrossRef CAS.
Footnote |
| † Electronic supplementary information (ESI) available. See DOI: 10.1039/c5ra13410b |
| This journal is © The Royal Society of Chemistry 2015 |