
 Open Access Article
 This Open Access Article is licensed under a Creative Commons Attribution-Non Commercial 3.0 Unported Licence
Studies of intermolecular interactions in solid dispersions using advanced surface chemical analysis
M.
Maniruzzaman
*,
Martin J.
Snowden
,
Mike S.
Bradely
and
D.
Douroumis
Faculty of Engineering and Science, University of Greenwich, Chatham Maritime, Kent ME4 4TB, UK. E-mail: M.Maniruzzaman@gre.ac.uk; D.Douroumis@gre.ac.uk
First published on 27th August 2015
Abstract
The aim of this study is to utilise an advanced surface chemical analysis based on X-ray photoelectron spectroscopy (XPS) to determine and characterise drug/polymer interactions in solid dispersions manufactured via hot melt extrusion (HME). Cetirizine HCl (CTZ) and verapamil HCl (VRP) were used as model cationic drugs while Eudragit® grade L100 and L100-55 polymers were used as anionic carriers. A molecular dynamics (MD) based simulation approach predicted drug/polymer interactions while scanning electron microscopy/energy dispersive X-ray spectroscopy (SEM/EDS) mapping showed homogenous distribution of the drug particles onto the polymer matrices. Hot stage microscopy (HSM) characterised the solid state of the drugs in extruded formulations. XPS analysis revealed the strength and nature of interaction between the –NH3 groups of the APIs with the –COOH groups of the polymers. The results obtained from XPS were supported by XRD and NMR studies. The estimation of non-protonated/protonated N atom (N/N′) ratios using XPS revealed the strength of the intermolecular interaction in drug/polymer extrudates which can be used as an efficient tool to study the drug/polymer interaction.
Introduction
To date the prediction of drug–polymer interactions is of exponential interest for the development of solid dispersions (a mixture of a group of solids consisting of at least two components). In most instances, solid dispersions consist of a crystalline drug and an amorphous polymeric carrier (a relatively larger molecule). The process involves the interactions of a small molecule drug with a polymer matrix. According to the thermodynamics of mixing, the first condition for the interactions to take place between a drug in polymer is obtaining negative change in free energy of mixing.1–4 The change in free energy of mixing is related to the enthalpy and entropic contributions according to the following equation (eqn (1)).| ΔGmix = ΔHmix − T × ΔSmix | (1) |
ΔGmix is the Gibbs' free energy, whereas ΔHmix is the enthalpy of mixing, ΔSmix is the entropy of mixing and T is the temperature (system). A negative value of ΔGmix shows that the mixing process is spontaneous which decreases upon the increase of ΔSmix in mixing (due to the increase in randomness). The cohesive and repulsive intra- and intermolecular forces (e.g. dispersion force, dipole–dipole interaction, and hydrogen bonding forces) present in the system may also make the drug–polymer interactions more complicated.
The lattice-based Flory–Huggins (F–H) theory, established by Flory 1952, is a well-known theory describing interactions between two components based on the Gibbs' free energy change before and after mixing.4,5 It has been reported in the literature that F–H theory can successfully be applied to determine the strength of the interactions between two compounds during their melting but to a limited extent.5,6 For example, F–H theory doesn't work in case of strong multiple interactions the drug–polymer systems. On the other hand, the available limited data for different group contributions in the van Krevelen equation for atomic groups also make this approach questionable.6 This approach also does not take into account the effect of chain conformation, including branching and linkages between monomer units and the molecular weight (Mw) of compounds. These are considered as important factors for the solubility of the drug molecule into one polymer. Therefore, such limitation in the foregoing methods indicates an immense need for a more robust practical method to accurately determine the interactions in drug/polymer and thus estimate the drug miscibility with a polymer.
In silico molecular modelling approach based on molecular dynamics (MD) can be used as a powerful tool to determine the drug–polymer interactions through both visualization and estimation of the strength of the interactions. It has been seen that very few molecular studies in the literature have reported on MD-based molecular modelling to describe solid dispersion process as well as drug–polymer interactions.7–16 Recently, the quantum mechanical (QM) calculations (Gaussian 09) were used to identify drug/polymer interactions.17,18 The results indicated the existence of hydrogen bonding between the amine group of the drug molecule and the carboxyl groups of the polymer among different drug/polymer formulations. The X-ray photoelectron spectroscopy (XPS) can be employed as a valuable tool for the characterization of polymer surfaces providing a quantitative elemental analysis and also information on the chemical bonding within the surface layers of the polymer as well as the prediction of the changes onto the material surface.19 XPS has made a significant contribution to investigate the 1st layer atomic surfaces of various polymers providing significantly precise quantitative elemental analysis and also information on the chemical bonding such as H bonding via –NH3 group of the drug (non-protonated/protonated N atom ratios).18,19 XPS can also provide information about the actual chemical composition via its advanced surface analysis and chemical state of surfaces and interfaces determining the properties of the interacting materials.18 Here we report the first case of the non-protonated/protonated nitrogen atoms ratios (N/N′) determined via advanced chemical surface analysis by XPS to identify the strength and types of the possible drug–polymer interactions which has been supported by QM based molecular modeling. In addition, the EDS based surface analysis has been used to determine the distribution of the drugs in solid dispersions while the NMR T1 relaxation time calculation has successfully elucidated the existence of the intermolecular interaction between the drugs and polymers.
Materials and method
Materials
Cetirizine HCl (CTZ) and verapamil HCl (VRP) were purchased from Sigma Aldrich (London, UK). Eudragit L100 (L100) and Eudragit L100-55 (L100-55) were kindly donated by Evonik Pharma Polymers (Darmstadt, Germany) and Colorcon Ltd (Dartford, UK), respectively. All other materials were used as received. The chemical structures of the compounds used in this study are given in Fig. 1a.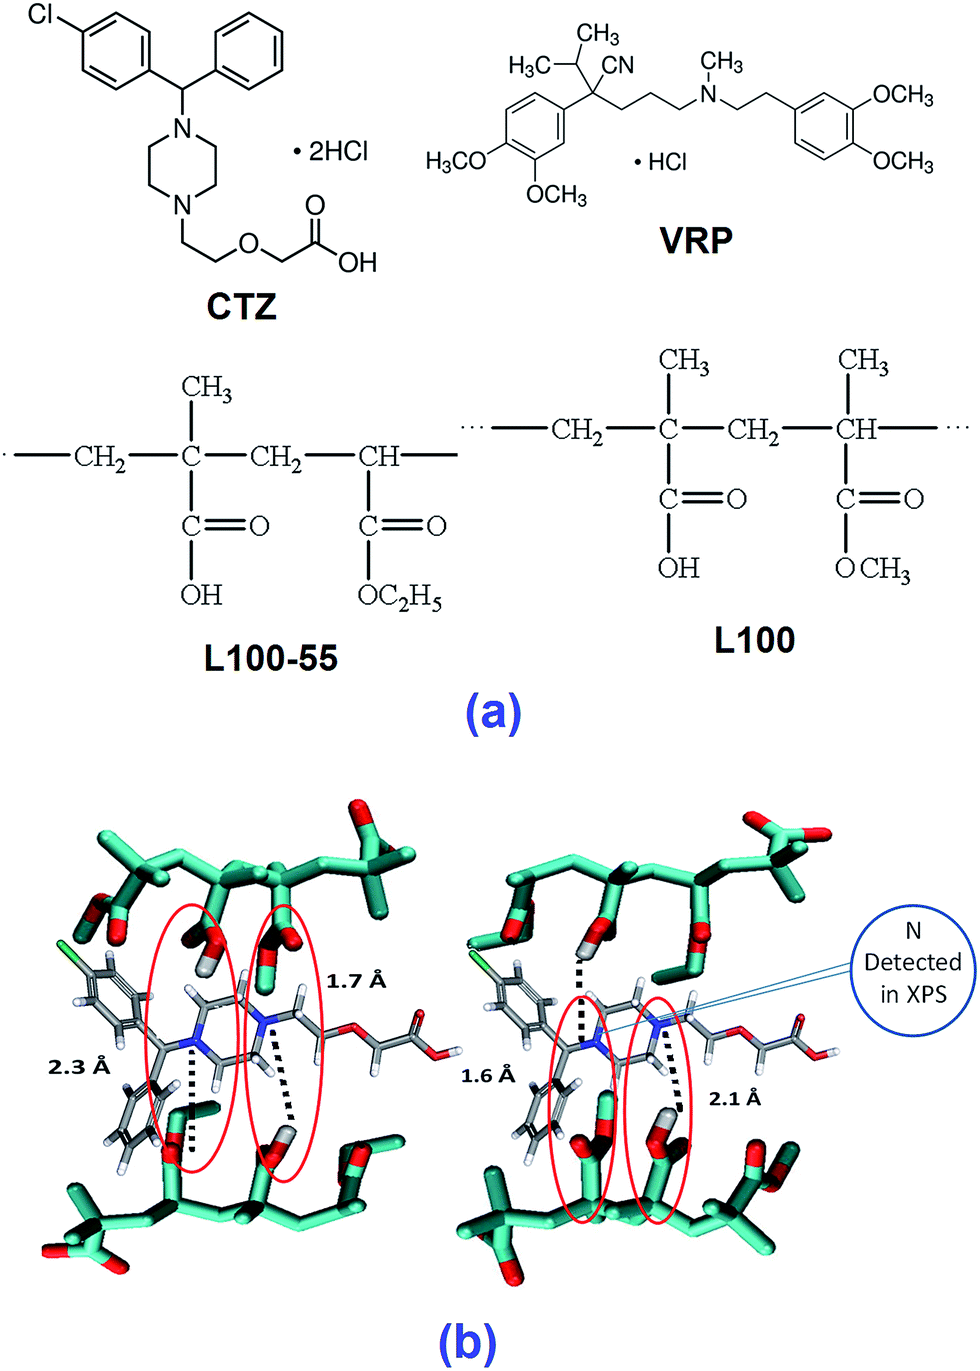 | ||
| Fig. 1 (a) Chemical structures of the drugs and polymers, (b) molecular modelling of CTZ with L100 (energy optimized to local minima at the B3LYP/6-31G* level and verified by frequency calculations using Gaussian 09). | ||
Hot melt extrusion (HME) processing to manufacture solid dispersions
Drug/polymer blends were blended in 100 g batches for 10 min each with a Turbula (TF2, Basel) mixer. The extrusion of all batches was performed using a Randcastle (USA) single-screw extruder (RCP0625) equipped with a 5 mm rod die at 100 °C/150 °C/155 °C/155 °C/155 °C (feeder → die) temperature profiles and screw speeds at 15 rpm. The drug–polymers composition consisted of VRP/L100, VRP/L100-55, CTZ/L100 and CTZ/L100-55 at ratios of 10/90 w/w. The produced extrudates (strands) were ground by using a Ball Milling System (Retsch, Germany) to obtain granules (<500 μm) at a rotational speed of 400 rpm for 5 min.Flory–Huggins (F–H) interaction parameter (χ)
The F–H interaction parameter, χ, of the model system was determined at two different conditions using the Nishi–Wang eqn (2)20 | (2) |
 | (3) |
Solubility parameter calculated via van Krevelen method
Solubility parameters (δ) using van Krevelen methods, of both drugs as well as the polymers were calculated in order to determine the theoretical drug/polymer miscibility. By considering the chemical structural orientations of all drugs/polymers, the solubility parameters were calculated18 according to the following equation: | (4) |
Here,

Molecular modelling study
The monomeric structures of both polymers and drugs were constructed by commercially available program Gaussview 09.22 Hydrogen bonding patterns were identified after energy optimisation at the B3LYP 6-31G* level using Gaussian 09.23,24 In all of the drug/polymers combinations primarily two different H bonding were detected with up to 2 Å distance. All possible H bonding were shown in dash line in the constructed figures.SEM/EDS analysis
Secondary electron images of gold-coated extrudates were obtained using a Cambridge Instruments Stereoscan scanning electron microscope at 20 kV. Photomicrographs of pure drugs and extruded solid dispersions were obtained by a scanning electron microscopy using a JEOL JSM-5310LV (JEOL, Tokyo, Japan) at 15 kV accelerating voltage, 20 mm working distance, spot size 14, secondary electron detector. Elemental assays and mapping were accomplished using an AZtec Energy Dispersive X-ray microanalysis system with 50 mm2 X-Max detector (EDS) (Oxford Instruments). Samples were placed on double sided adhesive carbon tabs applied to aluminium stubs and coated with a thin layer of carbon in an Edwards 306 high vacuum carbon evaporator. All samples were run in singlet.HSM studies
Characterization of drugs in polymeric carrier was assessed using hot stage microscopy (n = 1). During the analysis, an Olympus BX60 microscope (Olympus Corp., Centre Valley, PA) with Insight QE camera (Diagnostic Instruments, Inc., Sterling Heights, MI) was used to visually observe samples, while a FP82HT hot stage controlled by a FP 90 central processor (Mettler Toledo, Columbus, OH) maintained temperatures at 20–250 °C. Images were captured under visible and polarized light using Spot Advance Software (Diagnostic Instruments, Inc.).X-ray powder diffraction (XRPD)
XRPD was also used to assess the crystalline state of the drug in all extrudates (n = 1). Samples of pure and loaded drugs were evaluated using a Bruker D8 Advance (Germany) in theta–theta mode, Cu anode at 40 kV and 40 mA, parallel beam Goebel mirror, 0.2 mm exit slit, LynxEye position sensitive detector with 3 degree opening and Lynx Iris at 6.5 mm, sample rotation at 15 rpm. All samples were scanned with a step size of 0.02 degrees 2-theta from 2 to 40 degrees and a counting time of 0.2 seconds per step. All XRPD scans represent a single run.Nuclear magnetic resonance (NMR) studies
NMR analysis was conducted by using a Jeol ECA 500 NMR spectrometer, incorporating a 5 mm inverse probe (the 1H operating frequency was 500 MHz). 1H NMR spectra of the drugs, polymers and drug/polymer formulations were recorded using the standard Jeol pulse sequence. All samples were dissolved in CD3OD, degassed and then maintained at 25 °C during data acquisition. Samples were referenced with respect to the solvent. 1H T1 relaxation experiments were recorded for all samples using a standard inverse recovery experiment. Recovery delays (τ) were investigated between 10 ms and 20 s. The relaxation delay was set to be >5T1. T1s were calculated from curve fitting (Jeol curve fitting software), peak intensities, obtained from the spectra recorded for different recovery delays. Samples were run in triplicate.Advanced chemical surface analysis via XPS
Advanced chemical surface analysis via XPS was performed (n = 1) by using a Kratos Axis Ultra-DLD using a monochromatic Al Kα X-ray source (120 W) and an analyzer pass energy of 160 eV (survey scans) or 20 eV (high resolution scans); the pressure during analysis was 1 × 10⁻⁹ Torr. All data were referenced to the C (1s) signal at 285.0 eV attributable to unsaturated C–C/C–H bonds.25 Quantification and curve fitting was performed in CasaXPS™ (Version 2.3.15) using elemental sensitivity factors supplied by the manufacturer.Results and discussion
F–H interaction and Hansen solubility parameters
The calculation of the interaction parameters by using F–H theory which depends heavily on various factors such as crystalline melting temperature of APIs, Tg of polymers, molecular volumes and degree of polymerisations has successfully been implemented in our study. Apparently, the examination of the molecular structures of both drugs and polymers used in this study (Fig. 1a) shows that they all are polar and thus can form additional interactions (e.g. H-bonding). All required data for the calculation of the interaction parameters were successfully collected from the thermal analysis of the drug–polymer binary mixtures.The negative values of the interaction parameter in Table 1 indicate that there is a net attraction force between species in a binary mixture.5,6 Therefore higher absolute values of χ, suggest stronger interactions between drug/polymers species. In Table 1, shows that L100 facilitates stronger interactions with both drugs compared to those of L100-55. To further support this observation similar results were confirmed by using the Nishi–Wang approach. However, the overall results obtained from the F–H calculations just indicate the strength of possible interactions but do not show where the interaction takes place or the type of interactions. Therefore, a more robust approach using both molecular modelling and XPS was implemented.
| Form. | Volume fractions (ϕ) | Nishi–Wang (−χ) | Hildebrand–Scott (−χ) × 10−5 |
|---|---|---|---|
| VRP/L100 | 10![[thin space (1/6-em)]](https://www.rsc.org/images/entities/char_2009.gif) :90 :90 |
0.25 | 28.9 |
| VRP/L100-55 | 10:90 |
0.09 | 3.70 |
| CTZ/L100 | 10:90 |
0.21 | 11.0 |
| CTZ/L100-55 | 10:90 |
0.08 | 6.70 |
The theoretical approach applied for the estimation of the solubility parameter suggests that compounds with similar δ values are likely to be miscible. The reason is that the energy of mixing from intra-molecular interactions is balanced with the energy of mixing from intermolecular interactions.26 Greenhalgh (1999) demonstrated that compounds with Δδ < 7 MPa1/2 were likely to be miscible and compounds with Δδ > 10 MPa1/2 were likely to be immiscible.26,27
It has been reported elsewhere28 that the difference between the calculated solubility parameters of the polymers and the drug indicate that both CTZ and VRP are likely to be miscible with both polymers as the Δδ values for CTZ/L100, CTZ/L100-55, VRP/L100 and VRP/L100-55 are 2.07, 0.97, 3.4 and 2.3 MPa1/2, respectively. Moreover, the calculated molar attraction constant due to the hydrogen bonding for both CTZ (9.60 MPa1/2) and VRP (6.95 MPa1/2) are relatively high and quite close to those calculated for both polymers (L100: 12.03 MPa1/2 and L100-55, 11.69 MPa1/2). These high H-bonding values from the calculated solubility parameters may have played a vital role for the possible drug/polymer intermolecular interactions (see XPS analysis for more details).
Molecular modelling
The dimers of both polymers and the drugs interact predominantly through hydrogen bonds therefore we interpret the calculated binding energy (12.0–25.0 kcal mol−1) as a reflection of the strength of hydrogen bonds. Overall, the strength of the interactions is dependent on both the type of donor and acceptor and the number of hydrogen bonds formed between the drug and the polymer. Comparisons between VRP/L100 and between VRP/L100-55 show that with structurally similar polymers L100 and L100-55, the interactions (15.0–25 kcal mol−1) formed between the tertiary amine of the drug and the protonated carboxylate group of the polymers are significantly higher than those (12.0–15.0 kcal mol−1) between the alkoxy(–O–) group of the drug and the protonated carboxylate group of the polymers. Similar observations have been seen in case of CTZ.Higher binding energy represents more stable drug/polymer intermolecular interactions formed after the extrusion process. The interactions between tertiary amine of the drug molecules (VRP and CTZ) and the carboxylate group of both L100 and L100-55 (COOH) are the strongest as the intermolecular distance of two binding sites of drug/polymer is much shorter (1.3–1.6 Å) than the other (Fig. 1b). This simply indicates that the possible strongest interactions can take place between the amine group (–NH3) of the drugs and carboxylic group of the polymers.17,18 However, advanced chemical surface analysis performed by XPS can validate the findings from the foregoing claims.
HME processing to manufacture solid dispersions
Extrusion processing of all CTZ and VRP based formulations was performed at 155 °C with relatively lower screw speed of 15 rpm in order to allow homogenous blending of the drug/polymer binary mixtures. The rationale for the selection of high processing temperature was due to the higher Tgs of polymeric carriers used. Various formulation trials were conducted during the process optimization stage ranging the drug loading from 10–20% (w/w ratios). Preliminary results showed no significant differences in terms of the solid state of the extrudates and physical performance between the formulation containing 20% and 10% drugs. Both CTZ and VRP (cationic charged substances) were intentionally selected as model drugs with two different polymers (anionic charged) as carriers due to their oppositively charged groups which can possibly facilitate intermolecular interactions in order to manufacture molecular dispersions. The cationic CTZ and VRP may interact with the functional groups of the negatively charged polymers to effectively develop solid dispersion in HME.SEM was used to examine the surface morphology of the drugs and the extrudates. The extrudates containing L100 and L100-55 showed homogenous particle distribution on the extruded granules with both VRP and CTZ drugs. Fig. 2 shows excellent HME processing of the extruded materials where the particle size distribution (data not shown) showed particle sizes lower than 500 μm for most formulations ranging from 40–400 μm. Only a small amount of small granules with sizes <40 μm due to the optimized milling process which reduced fines in the final extruded batches.
 | ||
| Fig. 2 SEM images of CTZ pure, CTZ/L100 and VRP/L100-55 extruded formulations. | ||
SEM/EDS analysis
SEM/EDS was performed to determine the presence and distribution of the drugs in the extruded polymeric matrices. Chlorine (Cl) atoms were used as a marker to confirm the presence of both drugs in the extruded polymeric matrices, because both L100 and L100-55 do not contain Cl atoms in their structures. The distribution of CTZ and VRP was visualized by EDS elemental mapping of Cl atoms (Fig. 3a and b). As expected, the most abundant element detected was carbon, comprising a majority of APIs and substances for oral drug delivery including CTZ, VRP and both polymers, which were employed in this study. Secondary electron images (SEI) showed the sample morphology, while chlorine Kα X-ray maps and overlays of the X-ray maps onto the SEI show the distribution of Cl in the sample (Fig. 3a and b).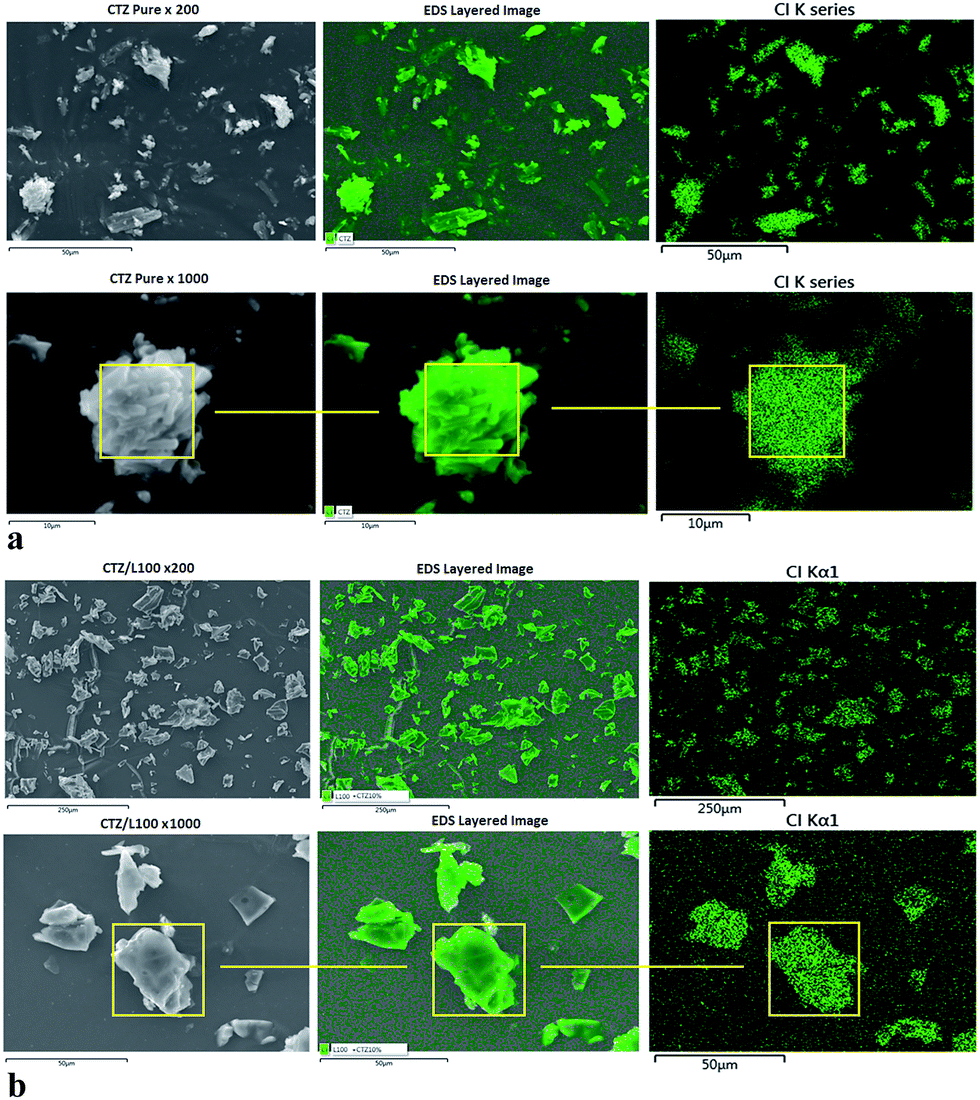 | ||
| Fig. 3 (a) SEM-EDS mapping images of chlorine (Cl) atom detected on pure CTZ particles. (b) SEM-EDS mapping images of Cl atom detected on CTZ/L100 extruded formulations. | ||
In each formulation, the amount of Cl present in CTZ or VRP comprised a minimum proportion of all of the other elements. Oxygen atoms were also detected, and these atoms were identified as components of the chemical structure of the drugs and both polymers.
As can be seen in Fig. 3a that CTZ pure exhibits a homogenous distribution of Cl atoms in EDS mapping indicated by green color. Since none of the polymeric carriers used in the extrusion process contain Cl atoms in their chemical structure, any presence of Cl atoms in the extruded formulations would have to come from the drug. Fig. 3b indicates that EDS mapping on the surface of CTZ/L100 extruded formulations confirmed the presence of Cl atoms. It was also evaluated that CTZ was homogenously dispersed into the extrudates matrices during the extrusion processing by EDS mapping analysis. The data derived from the EDS analysis of CTZ/L100-55 and VRP/polymers showed quite similar results. A similar study has been reported by our group recently for the observation of homogenous distribution of API on extruded tablets.29
HSM analysis
In order to validate the results obtained from DSC reported previously,28 hot stage microscopy (HSM) studies were conducted to visually determine the live thermal transitions and extent of drug melting (solubilisation) within the polymer matrices at different stages of heating. Images taken by HSM under optical and polarizing light are shown in Fig. 4. Both CTZ and VRP in L100 and L100-55 solid dispersions showed nominal API melting until reaching temperatures above 140 °C and thereafter from 145 °C showed extensive solubilisation of the drug (Fig. 4). The HSM image taken above 150 °C showed complete solubilisation of both drugs in the inert polymeric carriers indicating that the drug is miscible with both polymers used. However, thermal analysis cannot provide further information of possible intermolecular interactions patterns. Therefore, a more advanced chemical surface analysis using XPS can be of great interest to utilise.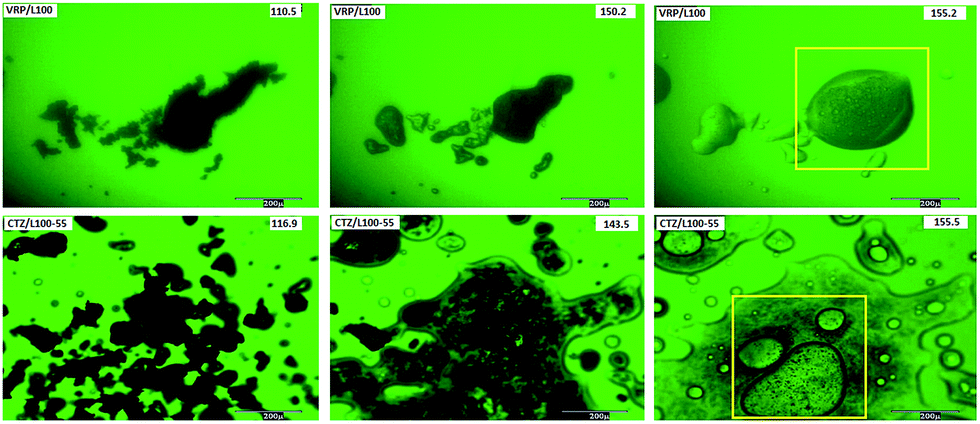 | ||
| Fig. 4 HSM images of VRP/L100 and CTZ/L100-55 extruded formulations. | ||
Previous studies28 with differential scanning calorimetry (DSC) and X-ray powder diffraction showed that both drugs (CTZ and VRP) were molecularly dispersed within the solid dispersions.
X-ray powder diffraction (XRPD) analysis
X-ray analysis, studied the drug–polymer extrudates, including pure drugs and physical mixtures (PM) of the same composition and the diffractograms were recorded to examine both APIs physical (crystalline or amorphous) state. As depicted in Fig. 5 the diffractograms of CTZ and VRP based physical mixtures presented distinct peaks which are characteristics peaks due to the presence of crystalline drugs at lower intensities suggesting that both drugs retained their crystallinity. However, in contrast no intensity peaks were observed in the extruded formulations. The absence of crystalline intensity peaks in the extruded formulations indicates the presence of amorphous APIs in the extruded solid dispersions complemented by DSC results (data not shown). This conversion of highly crystalline drugs to its amorphous forms may also be attributed to the possible intermolecular interactions and thus formation of molecular/amorphous solid dispersions. Similar studies have also been reported elsewhere to evaluate the drug/polymer interaction.30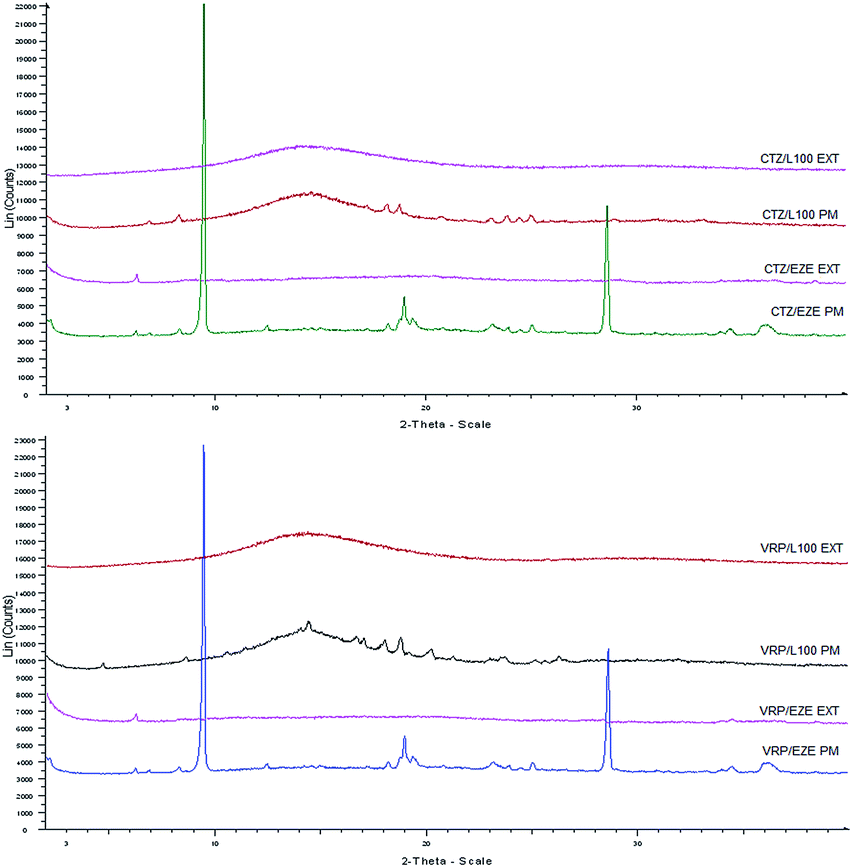 | ||
| Fig. 5 XRD diffractograms of CTZ and VRP loaded physical mixtures (PM) and extruded formulations (EXT). | ||
NMR analysis
1H T1 NMR spectroscopy was employed to monitor the possible chemical changes and thus the interactions at the molecular level by analyzing chemical shifts of NMR signals. Solid state NMR was tried initially but the low drug loading in our formulations didn't accord NMR a meaningful interpretation. 1H T1 NMR experiments were used to analyse spin relaxation times to look at potential changes of the drug's molecular motion, before and after the extrusion process. It would be assumed that the free drug (with a low molecular weight) would have quite a high molecular motion leading to fairly high T1 relaxation delays. After formulation, any consequence of an interaction between the drug and polymer would result in a decrease in the amount of molecular motion observed for the drug. The calculated T1 relaxation times have significantly been decreased in the CTZ/L100 formulations (5−445 ms) compared to that of pure drug (200 ms to 8.2 s) which are equivalent to a 16–20 folds of decrease in the T1 relaxation time. This indicates the existence of a strong drug/polymer interactions leading to a significant decrease in the relaxation time. T1 relaxation delays are particularly sensitive to intermediate molecular motions and molecules having fast or slow molecular motion can have comparable T1s.18 Although, the type of interactions cannot be elucidated by using this NMR analysis but can certainly be used to indicate the presence of molecular interaction between the drug and polymer.Advanced surface chemical analysis via XPS
XPS is a powerful technique to analyse the chemical surfaces of various compounds. The surface chemistry and the differences in the total hydrogen consumption between analysed samples using VRP, CTZ, L100 and L100-55 and their combinations was revealed via XPS analysis.Fig. 6 shows that VRP predominantly contained O (22.95%) and C (76.38%) atoms while CTZ contained O (23.42%) and C (75.41%). In both drugs N contained less than 1% which is in good agreement with that of theoretically derived structure based calculations. The N (1s) binding energy (BE) of both drugs suggests the protonation of the NH+ group while Cl (2p) energy of ∼198.035 eV (data not shown) significantly supports the foregoing statement. The N (1s) energy in both drug/polymer extrudates represents more protonation effects compared to that of pure drugs. The overall protonation effects in the extruded formulations can be seen illustrated as the following equation:
| N − H+ → NH3+/NH2+ | (5) |
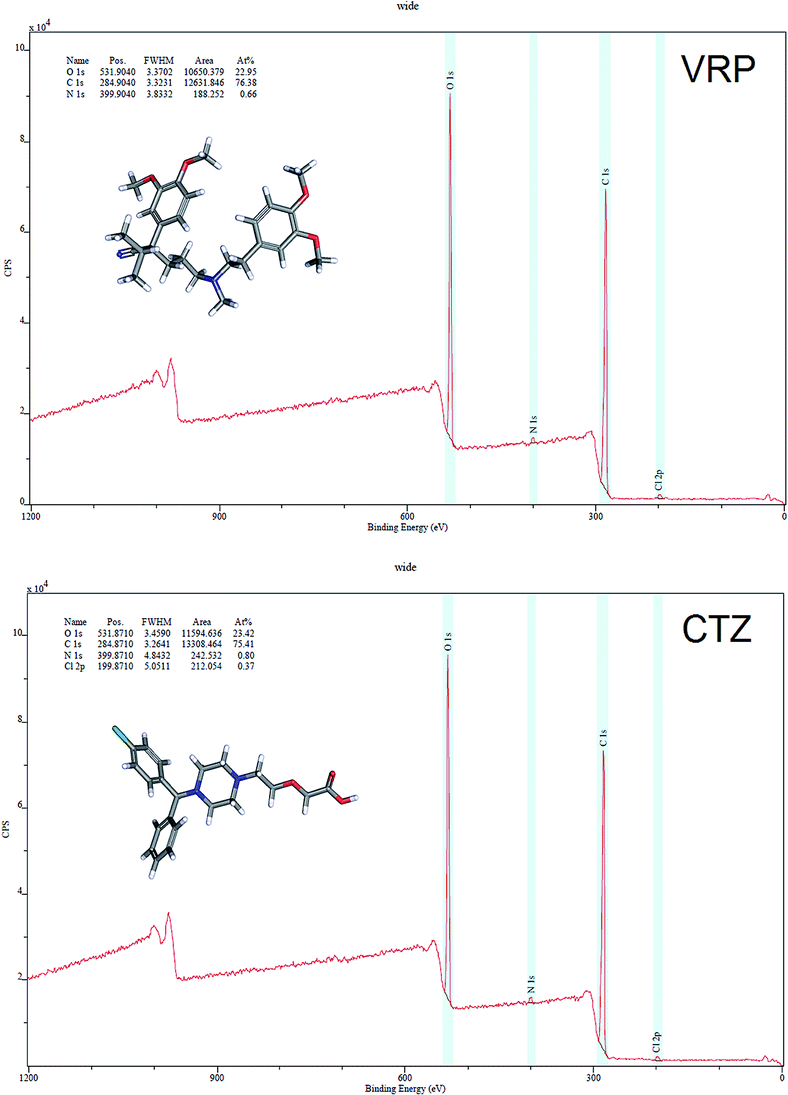 | ||
| Fig. 6 XPS surveys of pure CTZ and VRP showing binding energy (BE) peaks of C 1s, O 1s, N 1s and Cl 2p atoms and their area ratios. | ||
The N (1s) binding energy (BE) of ∼402.5 eV (Fig. 7) in VRP suggests the protonation of the NH+ group while the slightly higher values of N (1s) energy (∼403.6 eV) in PRP/L100 extrudates represents further protonation effect of N atom as NH3+. This observed N 1s peak at BE = ∼403.6 eV is in good agreement with the previously observed protonation of amide group by Beamson and Briggs.31 The BE peak at ∼403.60 eV (higher than typically observed for amines BE = ∼400.5 eV and much more for –NH2+ group) for N 1s is an indication of C–O–NH2+ structure.32–34
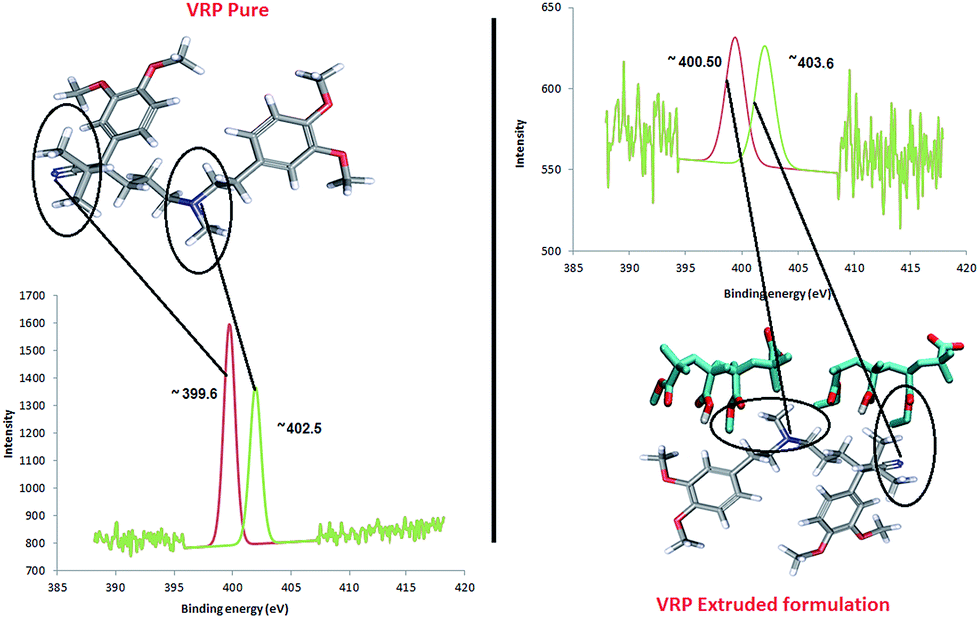 | ||
| Fig. 7 N/N′ ratio determination of VRP in XPS analysis (from the peak fitting using CasaXPS™ – Version 2.3.15). | ||
These results strongly indicate an interaction between the amide group of the API and carboxyl group of the polymer (L100) via H-bonding as confirmed by molecular modelling. Similarly, N 1s peaks from VRP/L100-55 also complement the observations from VRP/L100 formulations. The N (1s) energy of ∼402.7 eV in CTZ/L100 formulation suggests protonation of the amide group as observed for aforementioned VRP/L100 formulation.
The BE peak at ∼402.7 eV (Fig. 8) for N 1s is an indication of C–O–NH2+ structure with slightly lesser peak shift than that of VRP/L100. As before, it can be concluded that a strong interaction between the amide group of API and carboxyl group of polymer through H-interactions has taken place.17,35 Furthermore, the calculations of N/N′ ratio (ratio between non-protonated over protonated N atoms) for all extruded formulations indicated the strength of the intermolecular interactions within the solid dispersions. The calculated N/N′ ratios for all extruded formulations are summarized in Table 2.
 | ||
| Fig. 8 N/N′ ratio determination of CTZ in XPS analysis (peak fitting performed using CasaXPS™ – Version 2.3.15). | ||
| Formulations | N 1s binding energy (eV) | Calculated N/N′ ratios | |
|---|---|---|---|
| Non-protonated N (eV) | Protonated N (eV) | ||
| CTZ/L100 | 63.00 | 100.00 | 0.63 |
| CTZ/L100-55 | 85.00 | 60.00 | 1.01 |
| VRP/L100 | 65.00 | 59.90 | 0.78 |
| VRP/L100-55 | 80.00 | 67.00 | 1.14 |
The values in Table 2 clearly show that the N/N′ ratios values of the active L100 extrudates are smaller than those of L100-55 extrudates. It has been reported that the lower the N/N′ ratio, the higher the amount of protonated N atoms in drugs and thus the stronger the interaction between polymer and APIs.36,37 So XPS advanced surface analysis revealed both the strength and types of the possible intermolecular interactions between each drugs and polymers used which cannot be done via F–H interaction parameter calculations.
Conclusions
The molecular modelling and F–H calculations revealed presence of intermolecular interactions between drug and polymer molecules and estimated the strength as well. The findings obtained from the surface analysis using EDS mapping showed the existence of the drug molecule in molecular dispersion state. The analysis derived from the XRD and NMR studies revealed the existence of the possible drug/polymer interactions. The findings from XPS advanced chemical surface analysis has confirmed the mechanism of the interaction via a H-bonding between the carboxyl group of the anionic methacrylate co-polymers and the amine group of the active substances as well as the interaction strength. The advanced surface analysis performed using XPS allows the study of drug–polymer interactions at the atomic level and with great detail where traditional methods may have significant limitation to estimate.Conflicts of interest
The authors have declared that no competing interests exist.Acknowledgements
The authors would like to acknowledge Dr David Morgan (Cardiff University) and Dr Jiayun Pang (University of Greenwich) for their support to run XPS and molecular modelling studies, respectively.Notes and references
- L. D. Icoz and J. L. Kokini, Carbohydr. Polym., 2007, 68, 59–67 CrossRef PubMed.
- M. A. Altamimi and S. H. Neau, Drug Dev. Ind. Pharm., 2015 DOI:10.3109/03639045.2015.1075033.
- K. Wlodarski, W. Sawicki, A. Kozyra and L. Tajber, Eur. J. Pharm. Biopharm., 2015, 96, 237–246 CrossRef CAS PubMed.
- P. J. Marsac, T. Li and L. S. Taylor, Pharm. Res., 2009, 26, 139–151 CrossRef CAS PubMed.
- Y. Zhao, P. Inbar, H. P. Chokshi, W. Malick and D. S. Choi, J. Pharm. Sci., 2011, 100, 3196–3207 CrossRef CAS PubMed.
- J. S. Higgins, J. E. S. Lipson and R. P. White, Philos. Trans. R. Soc., A, 2010, 368, 1009–1025 CrossRef CAS PubMed.
- D. S. Dantas, J. I. N. Oliveira, J. X. L. Neto, R. F. da Costa, E. M. Bezerra, V. N. Freire, E. W. S. Caetano, U. L. Fulco and E. L. Albuquerque, RSC Adv., 2015, 5, 49439–49450 RSC.
- M. J. Meunier, Chem. Phys., 2005, 123, 134906 CAS.
- D. Rigby, Fluid Phase Equilib., 2004, 217, 77–87 CrossRef CAS PubMed.
- V. Milman, B. Winkler and M. I. J. Probert, J. Phys.: Condens. Matter, 2005, 17, 2233–2241 CrossRef CAS.
- Y. K. Ye, S. Bai, S. Vyas and M. J. Wirth, J. Phys. Chem. B, 2007, 111, 1189–1198 CrossRef CAS PubMed.
- A. D. Do and A. R. Schmitzer, RSC Adv., 2015, 5, 635–639 RSC.
- J. Kempf, N. Noujeim and A. R. Schmitzer, RSC Adv., 2014, 4, 42293–42298 RSC.
- A. Simperler, A. Kornherr, R. Chopra, P. A. Bonnet, W. Jones, W. D. S. Motherwell and G. Zifferer, J. Phys. Chem. B, 2010, 110, 19678–19684 CrossRef PubMed.
- R. Galeazzi, P. Bruni, E. Crucianelli, E. Laudadio, M. Marini, L. Massaccesi, G. Mobbili and M. Pisani, RSC Adv., 2015, 5, 54070–54078 RSC.
- J. Mravljak, J. Konc, M. Hodošček, T. Šolmajer and S. Pečar, J. Phys. Chem. B, 2006, 110(51), 25559–25561 CrossRef CAS PubMed.
- M. Maniruzzaman, J. Pang, D. J. Morgan and D. Douroumis, Mol. Pharm., 2015, 12(4), 1040–1049 CrossRef CAS PubMed.
- M. Maniruzzaman, D. J. Morgan, A. P. Mendham, J. Pang, M. J. Snowden and D. Douroumis, Int. J. Pharm., 2013, 443(1–2), 199–208 CrossRef CAS PubMed.
- Y. Zhao and D. G. Truhlar, Theor. Chem. Acc., 2008, 120, 215–241 CrossRef CAS.
- T. Nishi and T. T. Wang, Macromolecules, 1975, 8, 909–915 CrossRef CAS.
- J. Hildebrand and R. Scott, Solubility of non-electrolytes, 3rd edn, New York, Reinhold, 1950 Search PubMed.
- R. Dennington, T. Keith and J. Millam, Gauss View, Version 5, Semichem Inc., Shawnee Mission KS, 2009 Search PubMed.
- Y. Zhao and D. G. Truhlar, Theor. Chem. Acc., 2008, 120, 215–241 CrossRef CAS.
- S. F. Boys and F. Bernardi, Mol. Phys., 1970, 19, 553–566 CrossRef CAS PubMed.
- M. C. Davies, I. R. Wilding, R. D. Short, M. A. Khan, J. F. Watts and C. D. Melia, Int. J. Pharm., 1989, 57, 183–187 CrossRef CAS.
- C. M. Hansen, Ind. Eng. Chem. Prod. Res. Dev., 1969, 8, 2–11 CAS.
- D. J. Greenhalgh, et al. , J. Pharm. Sci., 1999, 88, 1182–1190 CrossRef CAS PubMed.
- M. Maniruzzaman, M. Bonnefille, A. Aranyos, M. J. Snowden and D. Douroumis, J. Pharm. Pharmacol., 2014, 66(2), 323–337 CrossRef CAS PubMed.
- K. Vithani, M. Maniruzzaman, I. J. Slipper, S. Mostafa, C. Miolane, Y. Cuppok, D. Marchaud and D. Douroumis, Colloids Surf., B, 2013, 110, 403–410 CrossRef CAS PubMed.
- J. Gu, W. P. Cheng, C. Hoskins, P. K. T. Lin, L. Zhao, L. Zhu, X. Qu and Z. Yang, J. Microencapsulation, 2011, 28(8), 752–762 CrossRef CAS PubMed.
- G. Beamson and D. Briggs, J. Chem. Educ., 1993, 70, PA25 Search PubMed.
- N. Vandencasteele and F. Reniers, J. Electron Spectrosc. Relat. Phenom., 2010, 178–179, 394–408 CrossRef CAS PubMed.
- P. Ghods, O. B. Isgor, J. R. Brown, F. Bensebaa and D. Kingston, Appl. Surf. Sci., 2011, 257, 4669–4677 CrossRef CAS PubMed.
- L. Sabbatini and P. G. Zambonin, J. Electron Spectrosc. Relat. Phenom., 1996, 81, 285–301 CrossRef CAS.
- K. C. Popat, S. Sharma and T. A. Desai, J. Phys. Chem. B, 2004, 108(17), 5185–5188 CrossRef CAS.
- A. Gryckze, Degussa report (Melt Extrusion with Eudragit), Germany, 2006 Search PubMed.
- D. Palmer, M. Levina, D. Douroumis, M. Maniruzzaman, D. J. Morgan, T. P. Farrell, A. R. Rajabi-Siahboomi and A. Nokhodchi, Colloids. Surf., B, 2013, 104, 174–180 CrossRef CAS PubMed.
| This journal is © The Royal Society of Chemistry 2015 |