DOI:
10.1039/C5RA13026C
(Paper)
RSC Adv., 2015,
5, 70178-70185
Controllable self-assemblies of sodium benzoate in different solvent environments†
Received
4th July 2015
, Accepted 11th August 2015
First published on 12th August 2015
Abstract
Sodium benzoate is an important and widely used food additive, however, its self-assembly properties in diverse solvents have been rarely studied. Here, we report different self-assembled aggregates, including sodium benzoate vesicles and sodium benzoate gel, in different solvent environments. Sodium benzoate vesicles and gel were identified by Transmission Electron Microscopy (TEM), Scanning Electron Microscopy (SEM) and Dynamic Light Scattering (DLS). Ultraviolet-visible (UV-vis) spectroscopy, Fourier Transform Infrared (FT-IR) spectroscopy, Thermal Gravity Analysis (TGA), Differential Scanning Calorimetry (DSC) and Small-Angle X-ray Scattering (SAXS) were further employed to study the formation mechanism of the sodium benzoate gel. A possible gel formation mechanism was proposed. Furthermore, sodium benzoate gel has multiple stimulus responsiveness, the addition of hydrochloric acid and metal ions can all cause disaggregation of sodium benzoate gel. Finally, sodium benzoate aggregates were found in calf serum.
1. Introduction
Supramolecular self-assembly based on low molecular weight molecules has been a research highlight in the past decade.1 Natural compounds or their derivatives, such as sugars,2 porphyrins,3 folic acid4 and so on, can all be used as the building blocks of supramolecular self-assembled aggregates. Besides, some designed compounds can act as building blocks too.5 These low molecular weight molecules can self-assemble into various aggregates like micelles,6 vesicles,7 nanofibers,8 nanoribbons9 and nanotubes.10 Low molecular weight molecules can self-assemble through non covalent bonds,11 including H-bonds, π–π stacking, van der Waals forces and dipole–dipole forces. These self-assembled aggregates have many potential applications in drug delivery carriers,12 synthesis templates,13 catalysis,14 etc. Hence, it is important to study the self-assembly behavior of low molecular weight molecules.
Vesicles, which have hollow structures, are spherical aggregates with bilayered or multilayered membranes.15 As a significant self-assembly, vesicles have attracted considerable attention for their potential applications in drug delivery or cell membranes mimic.16 So far, surfactants17 and host–guest supramolecular amphiphiles18 are the mainly reported building blocks for vesicles preparation. But, vesicles constructed by some small organic molecules, such as sodium benzoate, have been rarely reported.
Gelator can self-assemble into fibers and then the fibers can trap the surrounding solvents into a 3-dimensional network to form gel. Recently, our group reported cyclodextrin and folic acid gel.19 Cyclodextrin and folic acid gel can be prepared through good/poor method. When poor solvents were added into cyclodextrin and folic acid good solvents solution, cyclodextrin and folic acid fibers formed, and then obtained cyclodextrin and folic acid fibers can trap the surrounding solvents to form gel. There are so many applications for gel, such as drug delivery,20 heavy metal ions absorption21 and so on. So the preparation of gel has great significance in supramolecular self-assembly.
Sodium benzoate is a preservative, which is widely used in our daily life as food additive. But, the self-assemblies of sodium benzoate in diverse solvents have been rarely studied. In this work, we systematically studied the self-assembly behaviors of sodium benzoate in water, water/acetone mixture solution and calf serum. Typical vesicles were obtained in water when the concentration of sodium benzoate was around 2 × 10⁻⁴ mol L−1. The morphologies and sizes of the vesicles were identified by TEM, SEM and DLS. Sodium benzoate gel was prepared by adding amount of acetone into sodium benzoate aqueous solution. The morphologies of the gel were identified by TEM and SEM. The gel formation mechanism was studied by UV-vis, FT-IR, TGA, DSC, SAXS and the possible gel formation mechanism was proposed. Moreover, different sodium benzoate gel, which has different mechanical stress and yield stress, can be prepared through regulating the concentration of gelator or the ratio of acetone. Besides, the obtained gel can respond to various external stimuli, including hydrochloric acid and metal ions. Meanwhile, this gel formation showed pH reversible responsiveness. The addition of hydrochloric acid can destroy sodium benzoate gel into solution with precipitates, when amount of sodium hydroxide was added into the above solution, the gel will form again. Finally, the self-assembly behavior of sodium benzoate in calf serum was studied. Micrometers aggregates were observed. Hence, the safety of sodium benzoate should cause our attention since sodium benzoate aggregates may have bad effect on human health just like cholesterol deposition.
2. Experimental
2.1 Materials
Sodium benzoate, analytical reagent, was purchased from Tianjin Bodi Chemical Co. Ltd, China. Ethanol, acetone, acetonitrile and zinc chloride, analytical reagents, were purchased from Tianjin Fuyu Fine Chemical Co. Ltd, China. Anhydrous calcium chloride, analytical reagent, was purchased from Tianjin Guancheng Chemical Co. Ltd, China. Calf serum was purchased from Zhejiang Tianhang Biological Technology Co. Ltd, China. All the other solvents and reagents were analytical reagents and were purchased from Aladdin Industrial Corporation without further purification.
2.2 Analytical instruments and methods
Morphologies and sizes. TEM images were carried out on a JEM-1011 electron microscope. SEM pictures and Energy Dispersive Spectrum were obtained with a Hitachi S-4800 scanning electron microscope with a OXFORD INCAx-act energy dispersive spectroscopy. The samples for TEM detection were dropped in a copper wire mesh and stained by phosphotungstic acid. Then the samples were air-dried. SEM samples were prepared by spraying gold on the TEM sample. The average diameter of the vesicle was recorded by DLS measurement with a Wyatt QELS Technology DAWN HELEOS instrument, which used a 12-angle replaced detector in a scintillation vial and a 50 mW solid-state laser. The water for preparation samples of DLS was filtered by a 0.45 μm filter and samples of DLS were also filtered by a 0.45 μm filter before testing.
Rheological properties. Rheological properties were measured by a Thermo Haake RS6000 rheometer with cone and plate geometry (35 mm diameter, 0.105 mm cone gap). Stress sweep result was recorded when frequency value was fixed at 1 Hz. Frequency sweep result of gelator concentration effect was recorded when stress value was fixed at 20 Pa. Frequency sweep result of solvent ratio effect was recorded when stress value was fixed at 80 Pa.
Mechanism study. SAXS measurements were carried out using an in-house set-up with rotating anode X-ray generator (Rigaku RU 300, 12 kW) equipped with two laterally graded multilayer optics in a side-by-side arrangement, giving a highly focused parallel beam of mono-chromatic Cu Ka radiation. X-Ray Diffraction (XRD) experiment was performed on a German Bruker/D8 ADVANCE diffractometer with Cu Kα radiation. The FT-IR spectrum was obtained on an Avatar 370 FT-IR Spectrometer with the KBr pellet method at room temperature. UV-vis curves were obtained at room temperature with a TU-1800pc UV-vis spectrophotometer which was purchased from Purkinje General Co. Ltd, Beijing, China. A certain concentration of solution was poured into a quartz cuvette to detect the absorption peaks. TGA and DSC thermograms were recorded in the temperature range 25–800 °C at a heating rate of 2 °C per min under a N2 atmosphere with a reference of empty aluminum. A DSC 822e thermal analysis system from Mettler-Toledo (Switzerland) was employed. The samples (about 3 mg) were weighed into unsealed aluminum pans.
Sonication and molecular simulation. The sonication was performed with a KQ3187 ultrasonic cleaner for jewelry, Kunshan ultrasonic apparatus Co. Ltd, China. The sizes of sodium benzoate and water molecules were obtained from the software Materials Studio 5.5 by Accelrys.
2.3 Preparation of sodium benzoate vesicles
The 10−2 mol L−1 mother aqueous solution of sodium benzoate was prepared by dissolving certain molar quantities powder samples in water directly. Then mother solutions were diluted into 2 × 10⁻⁴ mol L−1 with deionized water. Finally, the vesicles samples were prepared after the solutions were sonicated 40 minutes at ambient temperature and placed for about one day.
2.4 Preparation of sodium benzoate gel
The 1.6 mol L−1 mother aqueous solution of sodium benzoate was prepared by dissolving certain molar quantities powder samples in water directly. Then 5.5 ml acetone was added into 0.5 ml mother aqueous solution of sodium benzoate. The sodium benzoate gel was obtained by shaking with an external mechanical stress at room temperature.
2.5 Preparation of phase diagram of sodium benzoate
Controlling variable method was used to draw phase diagram of sodium benzoate. Firstly, the weight of sodium benzoate was fixed, different states of sodium benzoate were gotten along with water/acetone ratio changed. Secondly, water/acetone ratio was fixed, different states of sodium benzoate were gotten along with the weight of sodium benzoate changed. Thirdly, the obtained different states points of sodium benzoate were used to draw phase diagram of sodium benzoate.
2.6 Stimulus responsiveness of sodium benzoate gel
Stimuli responsiveness of sodium benzoate was measured by adding a certain amount of acid/base or metal ions into the gel. When equivalent hydrochloric acid to sodium benzoate was added into the gel, white precipitate was obtained within 30 minutes. And then the precipitate was transformed into gel after adding equivalent sodium hydroxide into the precipitate within 0.5 h. Besides, when half of equivalent metal ions such as Cu2+, Ca2+ and Zn2+ was added into the gel, sodium benzoate gel was destroyed as well.
3. Results and discussions
3.1 Morphologies and sizes
As shown in Fig. 1(a) and (b), sodium benzoate vesicles can be observed clearly under TEM22 at low concentration. The obtained vesicles have the hollow spherical characteristic with obvious contrast between the bright center and dark periphery. The diameters of vesicles are mainly around 100 nm. The morphologies of the vesicles can be further verified by the SEM detection. SEM with gold-sputter-coating process to enhance the electro-conductivity of the samples for better observation is a significant method to observe the surface topography of vesicles.23 From the SEM images of Fig. 1(c) and (d), we could confirm the vesicles spheres morphologies. Meanwhile, the vesicles diameter distribution in SEM images is consistent with the TEM results. Energy dispersive spectrum (EDS) was used to analyze whether the obtained vesicles were constructed by sodium benzoate.24 It was found that the main elements of the obtained vesicles were carbon and oxygen (Fig. S1†), this confirmed that the obtained vesicles were constructed by sodium benzoate. As for other elements, their emergence was attributed to samples preparation process. Copper appeared due to copper grid base. Tungsten arose because of the phosphotungstic acid used in TEM sample preparation process. The emergence of gold was attributed to gold spraying in SEM sample preparation process.
 |
| | Fig. 1 TEM and SEM images of sodium benzoate vesicles (2 × 10⁻⁴ mol L−1) at room temperature: (a) TEM, scale bar = 200 nm; (b) TEM, scale bar = 100 nm, inset: the amplified TEM image of the cyan rectangle marked vesicle; (c) SEM, scale bar = 200 nm; (d) SEM, scale bar = 100 nm, inset: the amplified SEM image of the cyan rectangle marked vesicle. | |
The DLS result in Fig. 2 illustrates that the diameters of sodium benzoate vesicles mainly range from 80 nm to 198 nm, which have a relatively concentrated particle size distribution.25 The diameters of sodium benzoate vesicles of DLS result are slightly larger than the results of TEM and SEM. It is reasonable that the DLS sample is full of water in aqueous solution, while the samples of TEM and SEM are dried through air-drying before detection. Therefore, the radius distribution of DLS is consistent with the TEM and SEM results.
 |
| | Fig. 2 DLS diameter distribution of sodium benzoate vesicles (2 × 10⁻⁴ mol L−1) in water at room temperature. | |
Sodium benzoate can dissolve in strong polar solvents like water, but it can't dissolve in poor solvents like acetone. When amount of acetone was added into sodium benzoate aqueous solution, sodium benzoate gel was obtained in this process. Sodium benzoate gel can be identified by naked eyes since it will not flow when it was inverted. Moreover, TEM and SEM, which can give the micro-morphology of sodium benzoate gel, were used in this study. As shown in Fig. 3, the widths of sodium benzoate fibers were around 20 to 220 nm and the lengths of sodium benzoate fibers were about several to tens micrometers. Long fibers connected with each other to form a network, the obtained network can capture the solvents to form gel.
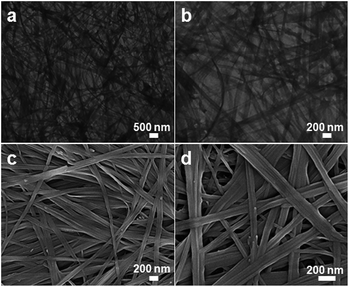 |
| | Fig. 3 TEM and SEM images of sodium benzoate gel in water/acetone mixture solvents at room temperature: (a) TEM, scale bar = 500 nm; (b) TEM, scale bar = 200 nm; (c) SEM, scale bar = 200 nm; (d) SEM, scale bar = 200 nm. | |
3.2 Gel properties
Rheological study was used to explore mechanical properties of the obtained sodium benzoate gel.26 Frequency sweep and dynamic oscillatory stress sweep of different samples are given in Fig. 4. The elastic modulus G′ can show solid-like behavior and the viscous modulus G′′ can show liquid-like behavior. In the linear viscoelastic region, if G′ is higher than G′′, it means that the gel sample has solid property. When beyond the linear viscosity region, G′ becomes smaller than G′′, the gel will transform into a liquid-like state. Therefore, when a high oscillatory stress is imposed on the gel sample, the gel will become liquid. The highest oscillatory stress is the yield stress, indicating the strength of the gel. The intersection of G′ and G′′ is the value of the yield stress. As shown in Fig. 4(a) and (b), mechanical stress and yield stress increases along with the concentration of gelator increases. Across the whole frequency range, G′ of gel sample is all higher than G′′, meaning that the gel contains the weak matrix. With the concentration of gelator increases, the value of yield stress increases as well, from 46 Pa in 1.2 M to 142 Pa in 2.0 M. Ratios of water to acetone can also affect mechanical stress and yield stress of the gel samples. Mechanical stress and yield stress increases along with the ratio of the acetone increases. Across the whole frequency range, G′ of gel sample is all higher than G′′, indicating that the gel contains the weak matrix. When acetone increases, yield stress increases as well, from 145 Pa in 1/7.5 to 221 Pa in 1/10. Hence, we can get sodium benzoate gel with different mechanical stress and yield stress through regulating the concentration of gelator and the ratio of acetone.
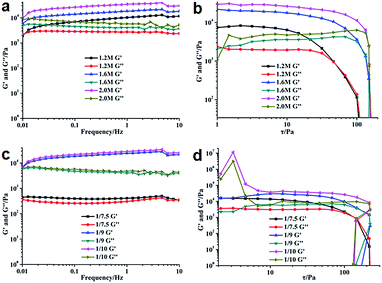 |
| | Fig. 4 Frequency sweep and dynamic oscillatory stress sweep of different samples with (a and b): different gelator concentrations (1/11, v/v, water/acetone) and (c and d): different solvent ratios (concentration fixed at 1.2 M). | |
3.3 Solvent effect
In order to explore when sodium benzoate can form gel, phase diagram of sodium benzoate was drawn, as illustrated in Fig. 5. When the molar quantity of sodium benzoate is fixed, as the percent of acetone increases, the state of sodium benzoate water/acetone mixture solution will change. The state changes to crystal from solution and then changes to gel or gel & precipitate from crystal. Finally, the state will change to precipitate totally. So we can get sodium benzoate gel through regulating the molar quantity of sodium benzoate or the percent of acetone. The critical gel concentration (CGC) was calculated to be about 0.366 wt%.
 |
| | Fig. 5 Phase diagram of sodium benzoate in the mixture between water and acetone. CGC: critical gel concentration. | |
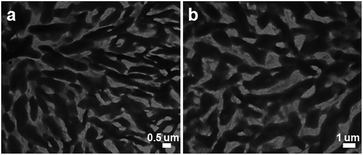
Sodium benzoate gel was obtained by adding a proper amount of acetone into sodium benzoate aqueous solution, so it is worthy to know whether other poor solvents can induce sodium benzoate gel formation. When different poor solvents were added in the sodium benzoate aqueous solution, the states of sodium benzoate in good/poor mixture solvents were different. As shown in Table 1, sodium benzoate can form gel when poor solvents are ethanol, acetonitrile, isopropanol, acetone, dimethyl formamide and dimethylsulfoxide. However, when poor solvents are petroleum ether, methylbenzene, dichloromethane, diethyl ether and ethyl acetate, the layered solution are obtained since those poor solvents are immiscible with water. When the poor solvent is dimethylacetamide, sodium benzoate precipitate appears in the mixture solution. Hence, we can get different sodium benzoate gel through regulating the kind of poor solvents. It is interesting that flower-like micrometer aggregates emerged in sodium benzoate gel (water/ethanol), as shown in Fig. 6. The widths of micrometer fibers were around 0.2 to 0.8 μm and the lengths of micrometer fibers were about several to tens micrometers. As for sodium benzoate gels in other poor solvents, including acetonitrile, isopropanol, dimethyl formamide and dimethylsulfoxide, they are all constructed by long sodium benzoate fibers as shown in Fig. S2 and S3.†
Table 1 States of sodium benzoate in different types of good/poor solvents systems. G: Gel, LS: Layered Solution, P: Precipitate
| Entry |
Good solvent |
Poor solvent |
State |
| 1 |
Water |
Ethanol |
G |
| 2 |
Water |
Acetonitrile |
G |
| 3 |
Water |
Isopropanol |
G |
| 4 |
Water |
Acetone |
G |
| 5 |
Water |
Petroleum ether |
LS |
| 6 |
Water |
Methylbenzene |
LS |
| 7 |
Water |
Dichloromethane |
LS |
| 8 |
Water |
Diethyl ether |
LS |
| 9 |
Water |
Ethyl acetate |
LS |
| 10 |
Water |
Dimethyl formamide |
G |
| 11 |
Water |
Dimethylacetamide |
P |
| 12 |
Water |
Dimethylsulfoxide |
G |
 |
| | Fig. 6 TEM and SEM images of sodium benzoate gel (water/ethanol) at room temperature: (a) TEM, scale bar = 1 μm; (b) TEM, scale bar = 1 μm; (c) SEM, scale bar = 2 μm; (d) SEM, scale bar = 0.5 μm. | |
3.4 Mechanism study
The Ultraviolet-visible (UV-vis) spectrum, Fourier Transform Infrared (FT-IR) spectroscopy, Thermal Gravity Analysis (TGA), Differential Scanning Calorimetry (DSC) and Small-Angle X-ray Scattering (SAXS) were employed to study the sodium benzoate gels formation mechanism.
3.4.1 UV-vis characterization. Fig. 7 displays the UV-vis spectra comparison of sodium benzoate in water and sodium benzoate gel. Sodium benzoate molecules in water should be in a single molecule state for their good solubility in water. However, sodium benzoate molecules in gel should be another state for their low solubility in the mixture between acetone and water. The main absorption peak of sodium benzoate in water is 224 nm, which exhibits an obvious blue shift to 217 nm in sodium benzoate gel, indicating the formation of H-type π–π stacking molecular model.27 Hence, π–π stacking may be one of the driving forces for constructing the sodium benzoate gel.
 |
| | Fig. 7 UV-vis spectra comparison of sodium benzoate in water and sodium benzoate gel. | |
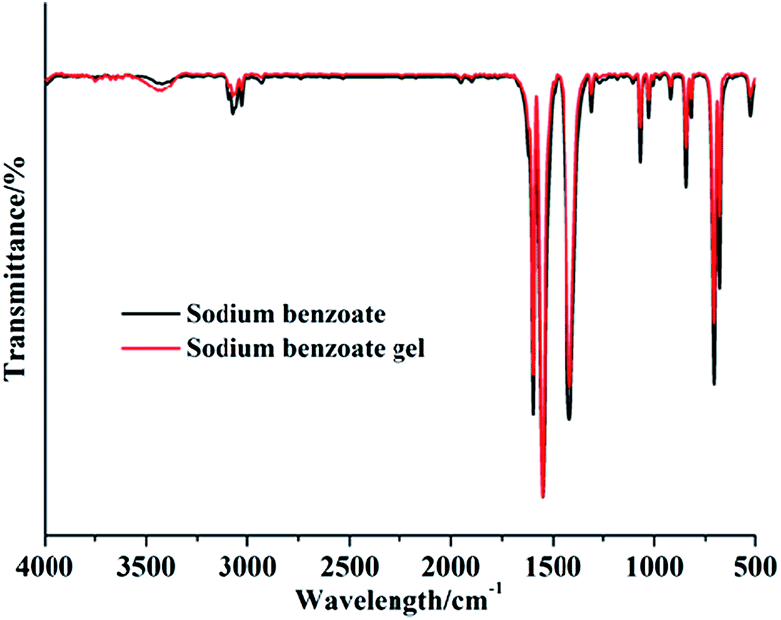
3.4.2 FT-IR characterization. FT-IR was used to investigate the driving force of sodium benzoate gels28 since it can provide the information about H-bonds between different molecules. As shown in Fig. 8, the characteristic absorption peaks of sodium benzoate can all be found in the curves of sodium benzoate and sodium benzoate gels. However, the peak of νCOO− = 3438 cm−1 in sodium benzoate gel becomes broad and strong than that of sodium benzoate, indicating the formation of H-bonds in sodium benzoate gel. So H-bonding may be one driving force for sodium benzoate gel formation too.
 |
| | Fig. 8 FT-IR spectra comparison of sodium benzoate and sodium benzoate gel. | |
3.4.3 TGA/DSC characterization. Via the analysis of FT-IR, we can find that H-bonding should be one driving force for sodium benzoate gel formation. However, carboxylate ion of one sodium benzoate can't form H-bonding with carboxylate ion of another sodium benzoate. Hence, there should be other molecules participating in the H-bonding formation process. TGA and DSC were used to study which molecule participated in this process.29 As shown in Fig. 9(b), compared to DSC spectrum of sodium benzoate, there is a clear endothermic peak around 100 °C in sodium benzoate gel, indicating that there should be water molecules in sodium benzoate gel. What's more, from Fig. 9(a), we can find that sodium benzoate gel lost more weight than sodium benzoate before 100 °C, further certifying the existence of water molecules in sodium benzoate gel. Those results mean that water molecules should participate in the H-bonds formation. Two sodium benzoate molecules can be linked by one water molecule through H-bonds.
 |
| | Fig. 9 TGA thermogram comparison and DSC thermogram comparison of the sodium benzoate and sodium benzoate gel. | |
3.4.4 SAXS characterizations. SAXS was used in our study to investigate more detailed microstructure information of sodium benzoate gel. As shown in Fig. 10, three scattering peaks, including peak 1, 2 and 3, appear in sodium benzoate gel, their relative positions are around 1:2:3, corresponding to the 001, 002 and 003 planes of the lamellar structure.30 The d value of peak 3 at high q region can be calculated about 1.1 nm through equations (q = 4π![[thin space (1/6-em)]](https://www.rsc.org/images/entities/char_2009.gif) sinθ/λ and 2dsinθ = nλ). The d value is in agree with the length of two sodium benzoate molecules and one water molecule (calculated about 0.59 nm per sodium benzoate molecule and 0.16 nm per water molecule from Material Studio 5.5). Two benzene rings of sodium benzoate molecules overlap through π–π stacking and two carboxyl groups can be linked together with one water molecule through H-bonding. Moreover, we can find that X-ray Diffraction (XRD) pattern of sodium benzoate gel is different from that of sodium benzoate (Fig. S4†). There is a new peak in sodium benzoate gel than that in sodium benzoate. The d value of this new peak is about 2.2 nm based on Bragg equation, which is the double of 1.1 nm calculated by SAXS. The result of XRD is consistent with SAXS result as well.
sinθ/λ and 2dsinθ = nλ). The d value is in agree with the length of two sodium benzoate molecules and one water molecule (calculated about 0.59 nm per sodium benzoate molecule and 0.16 nm per water molecule from Material Studio 5.5). Two benzene rings of sodium benzoate molecules overlap through π–π stacking and two carboxyl groups can be linked together with one water molecule through H-bonding. Moreover, we can find that X-ray Diffraction (XRD) pattern of sodium benzoate gel is different from that of sodium benzoate (Fig. S4†). There is a new peak in sodium benzoate gel than that in sodium benzoate. The d value of this new peak is about 2.2 nm based on Bragg equation, which is the double of 1.1 nm calculated by SAXS. The result of XRD is consistent with SAXS result as well.
 |
| | Fig. 10 SAXS pattern sodium benzoate gel. | |
3.4.5 The possible mechanism of the vesicular formation. From the above results, we can propose the possible self-assemblies’ formation mechanism of sodium benzoate, just as illustrated in Scheme 1. Sodium benzoate is easy to dissolve in water. It is fascinating that one sodium benzoate molecule is just like a surfactant molecule in terms of its structure. The carboxylate ion acts as hydrophilic head. Meanwhile, the benzene ring acts as the hydrophobic tail. Hence, sodium benzoate can self-assemble into vesicles under some concentrations in aqueous solution. The benzene rings are hid in the membrane of the vesicle to avoid exposing in water while the carboxylate ions contact with water. When more sodium benzoate is added in the sodium benzoate vesicles aqueous solution and then poor solvents, such as acetone and ethanol are added in the solution, sodium benzoate gel is obtained. Although sodium benzoate is easy to dissolve in water, it's difficult to dissolve in poor solvents. When poor solvents are added, sodium benzoate molecules will aggregate induced by non-covalent bonds. The benzene rings of sodium benzoate can stack together through H-type π–π stacking. Meanwhile, the carboxylate ions between different sodium benzoate molecules can be linked together by water molecules through H-bonds.31 Sodium benzoate fibers are formed in this process, which can further capture the solvents to form sodium benzoate gel.
 |
| | Scheme 1 The proposed formation mechanism of sodium benzoate vesicles and sodium benzoate gel. | |
3.5 Stimuli-responsiveness
It is interesting that sodium benzoate gel presents multiple stimulus responsiveness. As shown in Fig. 11, when equivalent hydrochloric acid to sodium benzoate was added into sodium benzoate gel, sodium benzoate gel was destroyed into precipitate in 30 minutes. But, when equivalent sodium hydroxide was added into the above precipitate, sodium benzoate gel was obtained again. Moreover, the new obtained sodium benzoate gel can be destroyed by hydrochloric acid as well. This reversible process can be repeated several times. This should be attributed to the transform between sodium benzoate and benzoate acid since benzoate acid can dissolve in acetone easily while sodium benzoate can't almost dissolve in acetone (Fig. S5†). Hence, we can adjust the aggregate states of sodium benzoate through changing pH value of solvent environment.
 |
| | Fig. 11 Multiple stimulus responsiveness of sodium benzoate gel, including acid, base and metal ions responsiveness. | |
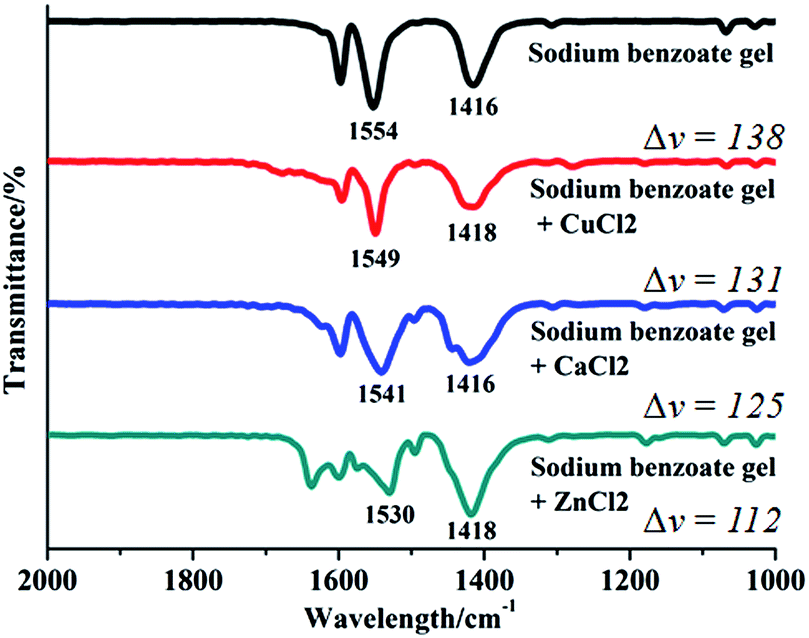
Besides, when half of equivalent different metal ions were added into sodium benzoate gel, sodium benzoate gel was also destroyed in 30 minutes. Calcium ions and copper ions can destroy sodium benzoate gel into precipitate while zinc ions can destroy sodium benzoate gel into solution. To study why metal ions can destroy sodium benzoate gel, FT-IR was employed to explore the cause (Fig. 12). Two peaks at v = 1554 cm−1 and v = 1416 cm−1 of sodium benzoate gel are ascribed to the C![[double bond, length as m-dash]](https://www.rsc.org/images/entities/char_e001.gif) O asymmetric and symmetric stretching modes of COO−, respectively. It is reported that Δv (Δv = vas (COO−) − vs (COO−)) value of bidentate chelating complex was smaller than that of mono COO−.21 The Δv value of COO− in sodium benzoate gel was 138 while it became 131, 125, 112 when copper ions, calcium ions or zinc ions were added into sodium benzoate gel. Therefore, the above metal ions should complex with sodium benzoate through a bidentate chelating mode (Fig. S5†). The formation of metal complex can destroy H-bonds between sodium benzoate and water molecules, which can further destroy sodium benzoate gel.
O asymmetric and symmetric stretching modes of COO−, respectively. It is reported that Δv (Δv = vas (COO−) − vs (COO−)) value of bidentate chelating complex was smaller than that of mono COO−.21 The Δv value of COO− in sodium benzoate gel was 138 while it became 131, 125, 112 when copper ions, calcium ions or zinc ions were added into sodium benzoate gel. Therefore, the above metal ions should complex with sodium benzoate through a bidentate chelating mode (Fig. S5†). The formation of metal complex can destroy H-bonds between sodium benzoate and water molecules, which can further destroy sodium benzoate gel.
 |
| | Fig. 12 FT-IR spectra comparison of sodium benzoate gel and sodium benzoate gel treated with different metal ions. | |
3.6 The self-assembly behavior of sodium benzoate in calf serum
As known to all, sodium benzoate is a common food additive to avoid food spoilage, which is widely used in food industry and can be found in much food, including packed meat, fish, drinking and so on. Based on the self-assembly behavior of sodium benzoate in different solvent environment, we want to know the self-assembly behavior of sodium benzoate in calf serum since it is important to know the effect of sodium benzoate on animal or human bodies. Amount of sodium benzoate was dissolved in calf serum to observe it's self-assembly behavior, as shown in Fig. 13. It's amazing that micrometers sodium benzoate aggregates can be found in calf serum compared to pure calf serum (Fig. S6†). Those aggregates may have bad effect on the health of animal or human just like cholesterol deposition. Hence, the safety of sodium benzoate should cause our attention.
 |
| | Fig. 13 TEM images of sodium benzoate aggregates in calf serum. | |
4. Conclusions
In conclusion, we have studied the self-assemblies of sodium benzoate in different solvents environments. Sodium benzoate can self-assemble into vesicles in water on certain concentration. When poor solvent like acetone was added into sodium benzoate aqueous solution, sodium benzoate gel was obtained. The mechanical stress and yield stress of this gel can be regulated. What's more, the obtained sodium benzoate gel shows multiple stimulus responsiveness, the addition of hydrochloric acid and metal ions can all destroy this gel. Finally, micrometers aggregates were found in sodium benzoate calf serum solution, so the safety of sodium benzoate should cause our attention.
Notes and references
- Y. P. Wang, H. P. Xu and X. Zhang, Adv. Mater., 2009, 21, 2849–2864 CrossRef CAS PubMed; C. Wang, Z. Q. Wang and X. Zhang, Acc. Chem. Res., 2012, 45, 608–618 CrossRef PubMed; P. Y. Xing, T. Sun and A. Y. Hao, RSC Adv., 2013, 3, 24776–24793 RSC; M. F. Wang, A. R. Mohebbi, Y. M. Sun and F. Wudl, Angew. Chem., Int. Ed., 2012, 51, 6920–6924 CrossRef PubMed; H. C. Zhang, X. Ma, K. T. Nguyen and Y. L. Zhao, ACS Nano, 2013, 7, 7853–7863 CrossRef PubMed; Z. Wu, Y. Yan and J. B. Huang, Langmuir, 2014, 30, 14375–14384 CrossRef PubMed.
- T. Sun, H. C. Zhang, L. Kong, H. W. Qiao, Y. M. Li, F. F. Xin and A. Y. Hao, Carbohydr. Res., 2011, 346, 285–293 CrossRef CAS PubMed.
- P. P. Guo, G. Y. Zhao, P. L. Chen, B. Lei, L. Jiang, H. T. Zhang, W. P. Hu and M. H. Liu, ACS Nano, 2014, 8, 3402–3411 CrossRef CAS PubMed.
- P. Y. Xing, X. X. Chu, G. Y. Du, M. Z. Li, J. Su, A. Y. Hao, Y. H. Hou, S. Y. Li, M. F. Ma and Q. B. Yu, RSC Adv., 2013, 3, 15237–15244 RSC.
- S. G. Chen, Y. Ruan, J. D. Brown, J. Gallucci, V. Maslak, C. M. Hadad and J. D. Badjic, J. Am. Chem. Soc., 2013, 135, 14964–14967 CrossRef CAS PubMed; A. G. Cheetham, Y. H. Ou, P. C. Zhang and H. G. Cui, Chem. Commun., 2014, 50, 6039–6042 RSC; P. Y. Xing, H. Z. Chen, L. Y. Bai and Y. L. Zhao, Chem. Commun., 2015, 51, 9309–9312 RSC.
- H. Q. Yin, S. Lei, S. B. Zhu, J. B. Huang and J. P. Ye, Chem.–Eur. J., 2006, 12, 2825–2835 CrossRef CAS PubMed.
- C. C. Zhou, X. H. Cheng, Q. Zhao, Y. Yan, J. D. Wang and J. B. Huang, Langmuir, 2013, 29, 13175–13182 CrossRef CAS PubMed.
- G. L. Wu, P. Verwilst, K. Liu, M. Smet, C. F. J. Faul and X. Zhang, Chem. Sci., 2013, 4, 4486–4493 RSC; C. Wang, Y. S. Guo, Y. P. Wang, H. P. Xu, R. J. Wang and X. Zhang, Angew. Chem., Int. Ed., 2009, 48, 8962–8965 CrossRef CAS PubMed; K. Wang, C. Y. Wang, Y. Wang, H. Li, C. Y. Bao, J. Y. Liu, S. X. A. Zhang and Y. W. Yang, Chem. Commun., 2013, 49, 10528–10530 RSC.
- H. G. Cui, A. G. Cheetham, E. T. Pashuck and S. I. Stupp, J. Am. Chem. Soc., 2014, 136, 12461–12468 CrossRef CAS PubMed.
- C. Wang, S. C. Yin, S. L. Chen, H. P. Xu, Z. Q. Wang and X. Zhang, Angew. Chem., Int. Ed., 2008, 47, 9049–9052 CrossRef CAS PubMed.
- Y. P. Liu, T. Y. Wang, Z. B. Li and M. H. Liu, Chem. Commun., 2013, 49, 4767–4769 RSC; Q. X. Jin, L. Zhang and M. H. Liu, Chem.–Eur. J., 2013, 19, 9234–9241 CrossRef CAS PubMed; S. Ahmed, J. H. Mondal, N. Behera and D. Das, Langmuir, 2013, 29, 14274–14283 CrossRef PubMed.
- A. G. Cheetham, P. C. Zhang, Y. A. Li, L. L. Lock and H. G. Cui, J. Am. Chem. Soc., 2013, 135, 2907–2910 CrossRef CAS PubMed.
- X. P. Gao, F. Lu, B. Dong, T. Zhou, W. F. Tian and L. Q. Zheng, Chem. Commun., 2014, 50, 8783–8786 RSC.
- K. Liu, R. R. Xing, C. J. Chen, G. Z. Shen, L. Y. Yan, Q. L. Zhou, G. H. Ma, H. Mohwald and X. H. Yan, Angew. Chem., Int. Ed., 2015, 54, 500–505 Search PubMed; S. S. Song, A. X. Song and J. C. Hao, J. Colloid Interface Sci., 2014, 413, 133–139 CrossRef CAS PubMed.
- T. Sun, Q. Guo, C. Zhang, J. C. Hao, P. Y. Xing, J. Su, S. Y. Li, A. Y. Hao and G. C. Liu, Langmuir, 2012, 28, 8625–8636 CrossRef CAS PubMed.
- P. Stano, E. D'Aguanno, J. Bolz, A. Fahr and P. L. Luisi, Angew. Chem., Int. Ed., 2013, 52, 13397–13400 CrossRef CAS PubMed; M. F. Ma, W. Q. Shang, P. Y. Xing, S. Y. Li, X. X. Chu, A. Y. Hao, G. C. Liu and Y. M. Zhang, Carbohydr. Res., 2015, 402, 208–214 CrossRef PubMed.
- S. S. Song, Q. S. Zheng, A. X. Song and J. C. Hao, Langmuir, 2012, 28, 219–226 CrossRef CAS PubMed.
- Q. P. Duan, Y. Cao, Y. Li, X. Y. Hu, T. X. Xiao, C. Lin, Y. Pan and L. Y. Wang, J. Am. Chem. Soc., 2013, 135, 10542–10549 CrossRef CAS PubMed; H. C. Zhang, W. An, Z. N. Liu, A. Y. Hao, J. C. Hao, J. Shen, X. H. Zhao, H. Y. Sun and L. Z. Sun, Carbohydr. Res., 2010, 345, 87–96 CrossRef PubMed; H. C. Zhang, Z. N. Liu, F. F. Xin, W. An, A. Y. Hao, J. Y. Li, Y. Y. Li, L. Z. Sun, T. Sun, W. J. Zhao, Y. M. Li and L. Kong, Carbohydr. Res., 2011, 346, 294–304 CrossRef PubMed.
- Z. L. Li, A. Y. Hao and X. Li, J. Mol. Liq., 2014, 196, 52–60 CrossRef CAS PubMed; X. X. Chu, P. Y. Xing, S. Y. Li, M. F. Ma and A. Y. Hao, Colloids Surf., A, 2014, 461, 11–17 CrossRef PubMed; P. Y. Xing, X. X. Chu, M. F. Ma, S. Y. Li and A. Y. Hao, Phys. Chem. Chem. Phys., 2014, 16, 8346–8359 RSC.
- X. M. Li, J. Y. Li, Y. Gao, Y. Kuang, J. F. Shi and B. Xu, J. Am. Chem. Soc., 2010, 132, 17707–17709 CrossRef CAS PubMed.
- S. S. Song, H. Q. Wang, A. X. Song and J. C. Hao, Chem.–Asian J., 2014, 9, 245–252 CrossRef CAS PubMed.
- K. Wang, D. S. Guo, M. Y. Zhao and Y. Liu, Chem.–Eur. J., 2014, 20, 1–10 CrossRef CAS PubMed; T. Sun, H. Yan, G. C. Liu, J. C. Hao, J. Su, S. Y. Li, P. Y. Xing and A. Y. Hao, J. Phys. Chem. B, 2012, 116, 14628–14636 CrossRef PubMed.
- K. Wang, D. S. Guo, X. Wang and Y. Liu, ACS Nano, 2011, 5, 2880–2894 CrossRef CAS PubMed.
- Y. Y. Lin, Y. Qiao, Y. J. Wang, Y. Yan and J. B. Huang, J. Mater. Chem., 2012, 22, 18314–18320 RSC.
- X. D. Chi, X. F. Ji, D. Y. Xia and F. H. Huang, J. Am. Chem. Soc., 2015, 137, 1440–1443 CrossRef CAS PubMed; T. Sun, Y. M. Li, H. C. Zhang, J. Y. Li, F. F. Xin, L. Kong and A. Y. Hao, Colloids Surf., A, 2011, 375, 87–96 CrossRef PubMed.
- W. Q. Liu, P. Y. Xing, F. F. Xin, Y. H. Hou, T. Sun, J. C. Hao and A. Y. Hao, J. Phys. Chem. B, 2012, 116, 13106–13113 CrossRef CAS PubMed.
- Y. Qiao, Y. Y. Lin, S. Liu, S. F. Zhang, H. F. Chen, Y. J. Wang, Y. Yan, X. F. Guo and J. B. Huang, Chem. Commun., 2013, 49, 704–706 RSC.
- M. F. Ma, P. Y. Xing, S. G. Xu, S. Y. Li, X. X. Chu and A. Y. Hao, RSC Adv., 2014, 4, 42372–42375 RSC.
- P. Y. Xing, X. X. Chu, S. Y. Li, M. F. Ma and A. Y. Hao, ChemPhysChem, 2014, 15, 1–10 CrossRef PubMed.
- P. Y. Xing, X. X. Chu, S. Y. Li, F. F. Xin, M. F. Ma and A. Y. Hao, New J. Chem., 2013, 37, 3949–3955 RSC.
- V. Havel, V. Sindelar, M. Necas and A. E. Kaifer, Chem. Commun., 2014, 50, 1372–1374 RSC.
Footnotes |
| † Electronic supplementary information (ESI) available. See DOI: 10.1039/c5ra13026c |
| ‡ These authors contributed equally. |
|
| This journal is © The Royal Society of Chemistry 2015 |
Click here to see how this site uses Cookies. View our privacy policy here.