Cheng-Gong Han,
Chunyu Zhu,
Genki Saito and
Tomohiro Akiyama*
Center for Advanced Research of Energy and Materials, Hokkaido University, Sapporo 062-8628, Japan. E-mail: takiyama@eng.hokudai.ac.jp; Fax: +81 11 726 0731; Tel: +81 11 706 6842
First published on 17th August 2015
A series of LiBixLaxMn2−2xO4 (x = 0, 0.002, 0.005, 0.010, 0.020) samples were synthesized by solution combustion synthesis in combination with calcination. The phase structure and morphology of the products were characterized by X-ray diffraction, scanning electron microscopy, and transition electron microscopy. The results demonstrated that a single-phase LiMn2O4 spinel structure was obtained for the LiBixLaxMn2−2xO4 (x = 0, 0.002, 0.005) samples, whereas impurities were observed for the LiBixLaxMn2−2xO4 (x = 0.010, 0.020) samples as a result of the doping limit. The electrochemical properties were investigated by galvanostatic charge–discharge cycling and cycling voltammetry in a voltage range of 3.2–4.4 V. The substitution of Mn3+ by equimolar Bi3+ and La3+ could significantly improve the structural stability and suppress the Jahn–Teller distortion, thereby resulting in improved electrochemical properties for the Bi and La co-doped samples in contrast with the pristine LiMn2O4 sample. In particular, the LiBi0.005La0.005Mn1.99O4 sample delivered a high initial discharge capacity of 130.2 mA h g−1 at 1C, and following 80 cycles, the capacity retention was as high as 95.0%. Moreover, it also presented the best rate capability among all the samples, in which a high discharge capacity of 98.3 mA h g−1 was still maintained at a high rate of 7C compared with that of 75.8 mA h g−1 for the pristine LiMn2O4 sample.
Up to now, two main strategies, surface modification11,12 and doping technology,13,14 have been developed to solve the aforementioned capacity fading issue. Surface modification can decrease the contact areas between the LiMn2O4 particles and the electrolyte solution, and therefore inhibit the manganese dissolution. However, surface modification technology usually impairs the capacity and scarcely alleviates the Jahn–Teller distortion.15 Recently, the doping of one or more elements at the manganese sites has been proposed as an effective method to alleviate capacity fading by reducing the Jahn–Teller distortion and the dissolution of manganese in the electrolyte solution.14,16 The single element doping of LiMn2O4 has been widely performed using a small amount of trivalent ions, such as Co3+,17 Al3+,18,19 Fe3+,20 Cr3+,21 Ga3+,22,23 Sm3+,24,25 La3+,26,27 resulting in an improved cycling performance during the charge/discharge process. By contrast, LiMn2O4 with the substitution of multiple ions has received more attention because of the occurrence of the synergistic effect, which improves the cycling life.28–31 Mohan et al. demonstrated that La and Sm co-substituted LiSmxLa0.2−xMn1.80O4 (x = 0.05, 0.10, 0.15) cathode materials synthesized by the sol–gel method exhibited enhanced structural stability of the octahedral sites in the spinel structure with the substitution of a small amount of La and Sm. This resulted in improved capacity retentions of 90% and 82% for the LiSm0.10La0.10Mn1.80O4 sample, compared with those of 74% and 60% for the pristine LiMn2O4 after 100 cycles at a current density of 0.5C at temperatures of 30 °C and 50 °C, respectively.32 Iqbal et al. prepared La and Zn co-doped LiMn2O4 spinel materials using a sol–gel method.33 The results revealed that the LiLa0.01Zn0.01Mn1.98O4 sample achieved a higher discharge capacity of 92 mA h g−1 and 78% of the initial discharge capacity at 5C compared to values of 51 mA h g−1 and 41% for the un-doped LiMn2O4 sample. This indicates that the La and Zn co-doping stabilized the structural integrity of the spinel host by suppressing the Jahn–Teller distortion and shortening the diffusion of the Li ions. La, a rare earth metal, can be selected as a possible candidate to function as a substitute for manganese because of its large binding energy, therefore forming a pillar and preventing the collapse of the cubic structure, and increasing the average valence of Mn, thereby reducing the occurrence of the Jahn–Teller distortion.26,33,34 Moreover, the heavy element, bismuth, has been found to partially substitute manganese as a dopant.35,36 From electrochemical investigations in a strong alkaline electrolyte (9 M KOH), Schlörb et al. reported that Bi-doped LiMn2O4 material achieved remarkably improved cyclability, whereas after 10 cycles, a rapid decrease in capacity to 50% of the initial value was observed for the un-doped LiMn2O4 sample.36 Following 100 cycles measured at a constant current of 40 mA g−1, Tan et al. demonstrated that Bi-modified LiMn2O4, synthesized by a sol–gel method, achieved a discharge capacity of 100 mA h g−1 and a capacity retention of 84.7%, compared with a capacity retention of 74.2% for the unmodified sample.37 When the heavy element, bismuth, is introduced to the spinel structure, it can result in the hybridizing of the 6s and 6p orbitals of the bismuth ions with the adjacent 2p orbital of the oxygen in addition to the 3d orbital of the manganese.38 Doped bismuth ions can increase the charge transfer from the oxygen anion to the manganese cation because of the overlapping of the bismuth orbital with the oxygen and manganese orbitals. This probably results in a wider conduction band, increasing the electronic conductivity and lithium diffusivity of the electrodes.38,39 Considering the lack of studies on Bi and La co-doping, Bi and La are introduced to partially substitute Mn in order to improve both the stability of the spinel structure and the electrochemical performance during this study.
In this work, a novel solution combustion synthesis (SCS) method was employed because it can be used to homogeneously dope elements in trace amounts and yield nano-sized particles with high specific areas, thus benefitting the electrochemical properties.40 Bi and La were selected as the doping elements to partially substitute Mn in order to improve the electrochemical properties of the LiMn2O4 material. Considering the above, LiBixLaxMn2−2xO4 (x = 0, 0.002, 0.005, 0.010, 0.020) samples were synthesized by the SCS method in combination with calcination. The effect of the Bi and La doping amounts on the structure, morphology, and electrochemical performance was investigated in detail.
The phase structure was characterized by powder X-ray diffraction (XRD, Cu Kα, Rigaku Miniflex). The morphology, size of the powders, the energy-dispersive spectroscopy (EDS), the electron energy-loss spectroscopy (EELS), and the energy dispersive X-ray spectroscopy (EDX) were determined by scanning electron microscopy (SEM, JEOL, JSM-7001FA) and transmission electron microscopy (TEM, JEOL JEM-2010F).
![]() | ||
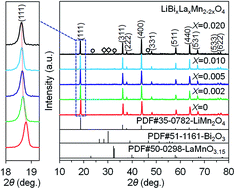
Fig. 1 XRD patterns of LiBixLaxMn2−2xO4 (x = 0, 0.002, 0.005, 0.010, 0.020) samples with the enlarged (111) diffraction peak. |
Fig. 2 displays the lattice parameters of the LiBixLaxMn2−2xO4 (x = 0, 0.002, 0.005, 0.010, 0.020) samples. All the lattice parameters are refined by MDI Jade Software. The enlarged lattice parameters of the LiBixLaxMn2−2xO4 samples can be observed as x increases from 0 to 0.01, indicating that Mn3+ with a smaller ionic radius, 0.72 Å, is substituted by Bi3+ and La3+ with the same ionic radius, 1.03 Å. However, as x increases from 0.01 to 0.02, the lattice parameters of the Bi and La co-doped samples are relatively constant, demonstrating that the amount of Bi and La doping attains a limit which results in the LaMnO3.15 and Bi2O3 impurities shown in Fig. 1. The enlargement of the lattice parameters indicates that Bi and La enter the spinel structure, probably benefiting the improved electrochemical properties of the LiMn2O4 materials as a result of the enlarged Li+ diffusion channel during the intercalation/de-intercalation process.
Fig. 3 shows the SEM images of the LiBixLaxMn2−2xO4 (x = 0, 0.002, 0.005, 0.010, 0.020) samples. All the samples exhibit similar morphologies. There are no obvious changes in the morphologies or particle sizes of the Bi and La co-doped samples, indicating that the trace doping of Bi and La does not have a significant effect on the morphologies or particle sizes of the co-doped samples. The size of the primary particles in the inset is 100–400 nm. Asymmetrical spheres with a size of 3–7 μm can be observed in the secondary particles.
Fig. 4 demonstrates the discharge capacity as a function of the cycle number at a current density of 1C in the voltage range of 3.2–4.4 V for the LiBixLaxMn2−2xO4 (x = 0, 0.002, 0.005, 0.010, 0.020) samples. The pristine LiMn2O4 sample exhibits an initial discharge capacity of 121.3 mA h g−1 and only maintains a capacity retention of 89.0% after 80 cycles. As the x value is increased from 0 to 0.002 and 0.005, the initial discharge capacity of the Bi and La co-doped LiMn2O4 sample improves, exhibiting values of 128.7 and 130.2 mA h g−1 for x = 0.002 and 0.005, respectively. A remarkably improved capacity retention of 95.0% and a discharge capacity of 123.7 mA h g−1 are delivered for the LiBi0.005La0.005Mn2O4 sample after 80 cycles, indicating that a more stable structure is achieved during the Li-ion intercalation/de-intercalation process compared with the pristine LiMn2O4. Both this capacity retention and discharge capacity are higher than the values of 89.1% and 106 mA h g−1 after 50 cycles at the current density of 1C for the LiLa0.05Mn1.95O4 sample by the sol–gel method,26 and the values of 91.6% and 103.7 mA h g−1 after 100 cycles at the current density of 0.2C for the LiLa0.05Mn1.95O4 sample by the solid state reaction.27 In addition, these values are also higher than that of 84.7% and 100 mA h g−1 after 100 cycles at the current density of near 0.3C for the Bi-modified LiMn2O4 sample which a trace doping amount of Bi is verified by the increased lattice parameters calculated from XRD results.37 The detailed dates of the current and reported works are also shown in the Table 1. This result indicates that co-doping is superior to single-doping for improving the electrochemical properties of LiMn2O4 material because of their synergistic effects. These results can be attributed to the factors discussed below. The bond energy of La–O (786.2 kJ mol−1) for the doped sample is greater than that of Mn–O (402 kJ mol−1), which can improve the spinel structure during cycling. What's more, both the dissolution of Mn3+ into the electrolyte and the Jahn–Teller distortion are inhibited because the relatively partial amount of Mn3+ is reduced by the substitution of Bi3+ and La3+, as demonstrated in Fig. 7(d). Moreover, the diffusion of the Li ions for the insertion/extraction is enhanced probably owing to the amplified channels resulting from the enlarged lattice parameters of the Bi and La co-doped LiMn2O4 sample.15,32,39 On the other hand, the improved cycling performance of the LiBi0.005La0.005Mn1.99O4 sample can also be confirmed by the less capacity fade of 0.08 mA h g−1 per cycle than that of 0.19 mA h g−1 per cycle for the pristine LiMn2O4 sample, displaying that the substitution of Mn by the partial amounts of Bi and La is in favor of enhancing the cycling performance. The discharge capacity of the Bi and La co-doped LiMn2O4 with x values of 0.010 and 0.020 is less than that of the LiBi0.005La0.005Mn2O4 sample which can be attributed to the appearance of the second phase. However, following the 80 cycles, a slightly improved capacity retention of 90.8% is achieved for the LiBi0.02La0.02Mn2O4 sample compared with that of the pristine LiMn2O4, which may be ascribed to the coating effect of the Bi2O3 second phase on the surface of the particles.24 The appropriate amounts of Bi and La doping can improve the cycling performance of the spinel LiMn2O4 material.
![]() | ||
Fig. 4 Discharge capacity as a function of the cycle number for LiBixLaxMn2−2xO4 (x = 0, 0.002, 0.005, 0.010, 0.020) samples at 1C between 3.2 and 4.4 V. |
Materials | Synthetic method | Current density | Voltage (V) | Discharge capacity (mA h g−1) | Capacity retention | Ref. |
---|---|---|---|---|---|---|
LiMn2O4 | SCS | 1C | 3.2–4.4 | 116.3 (80 cycles) | 89.0% | This work |
LiBi0.005La0.005Mn1.99O4 | SCS | 1C | 3.2–4.4 | 123.7 (80 cycles) | 95.0% | This work |
LiLa0.05Mn1.95O4 | S–G | 1C | 2.75–4.5 | 106 (50 cycles) | 89.1% | 26 |
LiLa0.05Mn1.95O4 | SSR | 0.2C | 3.0–4.3 | 103.7 (100 cycles) | 91.6% | 27 |
Bi-modified LiMn2O4 | S–G | ∼0.3C | 3.5–4.5 | 100 (100 cycles) | 84.7% | 37 |
The charge–discharge curves of the LiBixLaxMn2−2xO4 (x = 0, 0.002, 0.005, 0.010, 0.020) samples for the 1st and 80th cycles are shown in Fig. 5(a) and (b), respectively, at a current density of 1C between voltages of 3.2 and 4.4 V. Two obvious plateaus can be observed in the voltage range of 3.9 to 4.2 V for all the charge–discharge curves, which can be attributed to the well-defined spinel structure of LiMn2O4.32 These two plateaus correspond to two oxidation/reduction reaction stages during the Li de-insertion/insertion process. The first plateau at approximately 4.0 V results from the removal of Li+ ions from half of the tetrahedral sites in which Li–Li interactions occur. The second plateau at approximately 4.1 V can be attributed to the removal of Li+ ions from the other tetrahedral sites. Among these samples, the LiBi0.005La0.005Mn1.99O4 sample exhibits the highest discharge capacity for both the 1st and 80th cycles.
![]() | ||
Fig. 5 Charge–discharge curves of LiBixLaxMn2−2xO4 (x = 0, 0.002, 0.005, 0.010, 0.020) samples at 1C between 3.2 and 4.4 V. (a) the 1st cycle; (b) the 80th cycle. |
Fig. 6 presents the CV curves of the LiBixLaxMn2−2xO4 (x = 0, 0.005) samples in the voltage range of 3.2–4.4 V at a scan rate of 0.1 mV s−1. For comparison, the CV was only conducted for the pristine LiMn2O4 and LiBi0.005La0.005Mn1.99O4 samples. Two pairs of clearly separated redox peaks were observed in the CV curves of the pristine LiMn2O4 and LiBi0.005La0.005Mn1.99O4 samples. These can be ascribed to two typical reversible processes during the Li+ intercalation/de-intercalation cycling which correspond to the two plateaus in the charge–discharge curves of Fig. 5. The peak parameters of the CV curves during the first cycle of the pristine LiMn2O4 and LiBi0.005La0.005Mn1.99O4 samples are listed in Table 2. A cathodic peak of 3.94/4.06 V and anodic peaks of 4.07/4.20 V can be observed for the pristine LiMn2O4 sample while a cathodic peak of 3.96/4.08 V and anodic peaks of 4.05/4.18 V can be observed for the LiBi0.005La0.005Mn1.99O4 sample. The anodic peaks shift to a lower potential for the doped LiMn2O4 sample compared with the pristine LiMn2O4 sample, indicating that a portion of Li+ ions can migrate under less energy from the distorted spinel structure of Mn3+ substituted by Bi3+ and La3+.32,42 A larger cathodic potential difference, ΔE1 = 0.13 V, and anodic potential difference, ΔE2 = 0.14 V, are exhibited for the pristine LiMn2O4 sample. However, clearly reduced values of ΔE1 = 0.09 V and ΔE2 = 0.10 V are observed for the LiBi0.005La0.005Mn1.99O4 sample. This suggests that there is a reduced polarization of the Bi and La co-doped LiMn2O4 material owing to faster intercalation/de-intercalation of Li+ ions into/from the spinel structure compared with the pristine sample.24,33,43 The substitution of Mn3+ with Bi3+ and La3+ cations can maintain the stability of the spinel structure, therefore improving the cycling performance of the materials during the charge/discharge process.
![]() | ||
Fig. 6 Cyclic voltammetry (CV) curves of LiBixLaxMn2−2xO4 (x = 0, 0.005) samples in the voltage range of 3.2–4.4 V at a scan rate of 0.1 mV s−1. |
Potential value (V) | ||||||
---|---|---|---|---|---|---|
Epa1 | Epa2 | Epc1 | Epc2 | ΔEp1 | ΔEp2 | |
x = 0 | 4.07 | 4.20 | 3.94 | 4.06 | 0.13 | 0.14 |
x = 0.005 | 4.05 | 4.18 | 3.96 | 4.08 | 0.09 | 0.10 |
Fig. 7(a) and (b) display the TEM image with the electron diffraction pattern of the [110] zone axis within the inset, and the EDX analysis for the LiBi0.005La0.005Mn1.99O4 sample, respectively. The TEM image shows primary particles with a size of approximately 300 nm, which corresponds to the SEM image in Fig. 3. As there is no evidence of the surface coating layer exhibited in either the morphology shown in the TEM image or the single phase indexed from the XRD patterns in Fig. 1, it can be confirmed that the co-doped Bi and La ions enter into the structure of the LiBi0.005La0.005Mn1.99O4 sample. The electron diffraction pattern demonstrated in the inset exhibits typical spinel structure diffraction along the [110] direction, correlating with Fig. 1. To analyze the change in the valence states before/after the La and Bi doping, the EELS data was measured for the obtained particles. Fig. 7(c) and (d) show the oxygen (O) K-edge and manganese (Mn) L-edge EELS of the LiBixLaxMn2−2xO4 material with x = 0 and 0.005, respectively. The spectra positions can be calibrated from their zero-loss peaks. The peaks of Mn–L3 and Mn–L2 result from the transition of electrons from 2p3/2 to 3d3/2 and 3d5/2, and from 2p1/2 to 3d3/2, respectively.44 These relative intensities can be determined by the unoccupied bands in the 3d orbitals and therefore the valence state of Mn.45 The L3/L2 intensity ratio is related to the valence state of Mn.46,47 Compared with Fig. 7(c) and (d), following the Bi and La co-doping there is a decrease in the L3/L2 intensity ratio which indicates an increase in the Mn oxidation state. Specifically, following the Bi and La co-doping, a relatively greater amount of Mn4+ appear, arising from the substitution of Bi3+ and La3+ at the Mn3+ sites. In order to identify the existence and distribution of the Bi and La, the EDS of the LiBi0.005La0.005Mn1.99O4 sample is shown in Fig. 8. The peaks relating to Bi and La confirm the existence of these two elements while the element maps demonstrate the uniform distribution of the Bi and La in the LiBi0.005La0.005Mn1.99O4 sample.
Good rate capability, especially the discharge capacity at high current densities, is always required for high power applications of Li-ion batteries. Fig. 9 shows the rate capability of the LiBixLaxMn2−2xO4 (x = 0, 0.002, 0.005, 0.010, 0.020) samples in the voltage range of 3.2–4.3 V. All the samples exhibit decreased capacities as the current densities are increased, which can be attributed to the increased ohmic and electrochemical polarization arising from the limited diffusion of the Li+ ions into/out of the spinel structure.15,48 The pristine LiMn2O4 sample exhibits an initial discharge capacity of 120.3 mA h g−1 at a current density of 1C and a dramatically decreased value of 75.8 mA h g−1 at a high current of 7C. However, among all the samples, the best rate capability was achieved in the LiBi0.005La0.005Mn1.99O4 sample, exhibiting discharge capacities of 127.6 (1C), 120.8 (2C), 115.1 (3C), 111.0 (4C), and 106.8 mA h g−1 (5C). The high value of 98.3 mA h g−1 is still maintained even at a high current of 7C. The superior rate capability can be attributed to the broadened diffusion pathway of the Li+ ions during the intercalation/de-intercalation as a result of the enlarged lattice parameters and improved stable structure via the substitution of Mn3+ with a suitable amount of Bi3+ and La3+ cations.15,32,39
Fig. 10 shows the discharge curves for the LiBi0.005La0.005Mn1.99O4 sample at various current densities. Two obvious plateaus can be observed in the discharge curve at 1C, 2C, and 3C; however, the plateaus gradually disappear to transform into the slope at a high current density, such as 7C. This can be attributed to the ohmic drop and the increase in the cell polarization at high current densities.5 The discharge capacity as a function of the cycle number at current densities of 1C, 3C, and 5C between the voltage of 3.2 and 4.4 V is presented in Fig. 11 for the LiBi0.005La0.005Mn1.99O4 sample. The LiBi0.005La0.005Mn1.99O4 sample exhibits good capacity retention at current densities of 3C and 5C. Even after 500 cycles, it delivers a discharge capacity of 105.9 mA h g−1 at 3C and 101.1 mA h g−1 at 5C, exhibiting the best high-rate capability.
![]() | ||
Fig. 11 Discharge capacity as a function of the cycle number for LiBi0.005La0.005Mn1.99O4 sample at 1C, 3C, and 5C between 3.2 and 4.4 V. |
This journal is © The Royal Society of Chemistry 2015 |