DOI:
10.1039/C5RA12904D
(Paper)
RSC Adv., 2015,
5, 73651-73659
Porcine circovirus type 2 affects the serum profile of amino acids and intestinal expression of amino acid transporters in mice
Received
3rd July 2015
, Accepted 10th August 2015
First published on 14th August 2015
Abstract
PCV2 is highly pathogenic, however, its effect on the serum amino acids profile is unknown. This study was conducted to explore the profile of amino acids in the serum in porcine circovirus type 2 (PCV2) infected mice. The serum levels of amino acids were detected with isotope dilution liquid chromatography-mass spectrometry methods at 3, 7, 10 and 14 days post infection (DPI). Meanwhile, the expression of seven amino acids transporters (SLC6A14, SLC6A20, SLC7A5, SLC7A6, SLC7A7, SLC7A8, SLC7A9) in the jejunum was analyzed by reverse transcription polymerase chain reaction (RT-PCR) at 3 and 7 DPI. Serum PCV2 load was also analyzed by quantitative PCR at 3, 7, 10 and 14 DPI. Serum levels of most amino acids, such as Pro, Orn, and Met, significantly (P < 0.05) increased at 3 DPI. However, most amino acids, including Asp, Sar, Arg, Hyl, Pro, Lys, Val, Ile and Leu, significantly (P < 0.05) decreased at 7 DPI. There was no significant difference for most amino acids at 10 and 14 DPI. PCV2 infection significantly (P < 0.05) decreased expression of SLC7A5 and SLC7A6 at 7 DPI. In conclusion, PCV2 infection affects the profile of amino acids in the serum and the expression of amino acids transporters in the intestine.
Introduction
Porcine circovirus, including types 1 and 2 (PCV1 and PCV2, respectively), belongs to the Circovirus genus.1 PCV1 is nonpathogenic and has not been reported to be associated with naturally occurring diseases, while PCV2 has been suggested as the essential pathogen for the post-weaning multisystemic wasting syndrome (PMWS),1 porcine dermatitis and nephropathy syndrome (PDNS),2 reproductive disorders,3–5 enteritis,6 proliferative and necrotizing pneumonia (PNP) and porcine respiratory disease complex (PRDC),7,8 which are now termed as porcine circovirus-associated diseases or porcine circovirus diseases.
Besides being highly pathogenic, PCV2 infection is found worldwide, however, many treatments are of limited use in PCV2 infection.9–11 Nutritional regulation with functional amino acids to enhance the immune responses in the host might be a prophylactic measure against PCV2 infection.3,12–15 Indeed, previous study has found that dietary arginine supplementation amilorates the reproductive performance, and increases serum superoxide dismutase (SOD) activity and total antioxidant capacity (T-AOC) in PCV2 infected pregnant mice.4 Dietary glutamine supplementation confers a positive effect on the improvement of pregnancy outcomes in PCV2-infected mice through enhancing the immune responses and the ability to clear PCV2.13 Similarly, dietary L-glutamine or L-proline supplementation enhances the immune responses and the clearance against PCV2 in experimentally infected mice.12,16 Notably, dietary arginine and glutamine supplementation confers positive effects in PCV2 infected pigs.15 These studies are indicating that supplementation of some amino acids excises beneficial roles in PCV2 infected mice or pigs. However, before the clinic usage of functional amino acids in treating PCV2 infection, the data about serum profile of amino acids after PCV2 infection are critical.
In this study, serum profile of amino acids was analyzed in PCV2 infected mice at 3, 7, 10 and 14 days post infection (DPI). In this study, mouse was used as animal model for PCV2 infection because previous investigations from our group and other groups have indicated mouse can be used for PCV2 research.3,12–14,17–19 We selected these time points for the analysis of amino acids based on our previous work about the immune responses and the detection of virus load in this model.15,16,20 The expression of some amino acids transporters in the intestine was also studied in PCV2 infected mice at 3 and 7 days post infection by reverse transcription polymerase chain reaction (RT-PCR).
Methods and materials
Preparation of PCV2 stock
A PCV2 infectious clone constructed by self-ligation of the PCV2 genome via a SacII enzyme site was used to generate the virus stock pools required for experimental infections. Briefly, the continuous porcine kidney cell line PK-15,21 free of PCV1 and PCV2, was cultured in RPMI medium 1640 (HyClone) supplemented with 6% (vol/vol) fetal calf serum (FCS, HyClone). The cell monolayer was dispersed using trypsin–EDTA (Thermo Fisher Scientific) and suspended in RPMI medium 1640 supplemented with 6% (vol/vol) FCS. Cells were simultaneously infected with the PCV2 infectious clone. After 72 h of incubation, the infected cells were frozen and thawed three times, and the cell mixture was tested by PCR before being stored at −20 °C. PCV2 stocks were titrated on PK-15 cells.21
Experimental design
The PCV2-infected mouse model was established according to previous studies.3,12 Briefly, 80 female ICR (Institute for Cancer Research) mice (6 week-old) were purchased from SLAC Laboratory Animal Central (Shanghai, China). The mice were assigned into PCV2 infection or control groups at randomly. Mouse in PCV2 infection group was infected by an intraperitoneal injection of PCV2 at the dose of 5 × 10⁵ TCID50 (50% tissue culture infection dose, TCID50) after 3 days of accommodation, while mouse in control group received similar volume of PBS buffer. Ten mice from each group were killed to collect the serum and jejunum at 3, 7, 10 and 14 DPI for further analysis. Meanwhile, the average daily gain in both groups was calculated at 3, 7, 10 and 14 DPI. All animal experiments were performed according to the guidelines of the Laboratory Animal Ethical Commission of the Hunan Agricultural University.
Serum amino acids analysis
For serum amino acids analysis, serum samples were analyzed with isotope dilution liquid chromatography-mass spectrometry in Beijing Amino Medical Research Co., (Beijing, China) based on their previous published methods.22 Briefly, serum samples were thawed at room temperature and 40 μl of serum was transferred into 2 ml centrifuge tubes. Then, 10 μl 10% sulfosalicylic acid (containing 400 μmol L−1 norisoleucine; Applied Biosystem) was added and vortexed for 30 s. The mixture centrifuged at 10
000g for 5 min, after which 10 μl of the supernatant fraction was transferred to a 2 ml centrifuge tube. 40 μl borate saline buffer (0.45 mol L−1, pH 8.5, containing 20 μmol L−1 norvaline; Applied Biosystem) was then added and vortexed, and 10 μl of the supernatant fraction was transferred to a 2 ml centrifuge tube after centrifugation. 5 μl iTRAQ reagent 115 (Applied Biosystem) was added and incubated for 30 min at room temperature, followed by 5 μl 1.2% hydroxylamine solution to stop the reaction. The samples were dried in a vacuum concentrator without heating, and 32 μl iTRAQ reagent 114-labeled amino acids (Applied Biosystem) were added as isotope internal standard. The samples were separated on an AAA-C18 column (50 mm × 4.6 mm I.D., 5 μm, ABSCIEX) using water and acetonitrile (both containing 0.01% heptafluorobutyric acid and 0.1% formic acid) as mobile phase by gradient elution. Detection was carried out by multiple reactions monitoring (MRM) on a 3200QTRAP LC-MS/MS system (Applied Biosystem).
The expression of amino acids transporters analysis
Total RNA was isolated from liquid nitrogen pulverized jejunum with TRIZOL regent (Invitrogen, USA) and then treated with DNase I (Invitrogen, USA) according to the manufacturer's instructions. Primers were designed with Primer 5.0 according to the gene sequence of mice to produce an amplification product or previous reports (Table 1). β-actin was used as a housekeeping gene to normalize target gene transcript levels. Real-time PCR was performed according to our previous study.13
Table 1 The premier used in this study for intestinal amino acid transporters analysis by RT-PCR
Primer name |
Accession no. |
Primer seq (5′–3′) |
Product size |
Reference |
SLC7A7 |
NM011405 |
F: ATCTTCCTGGTGGCTGTTC |
113 |
This study |
R: TGCTCTGGCACTCTGATGA |
SLC7A8 |
NM016972 |
F: AAGAGGACAGAATGGCACTGA |
105 |
This study |
R: CCAGGAGAAGGCAGACACTG |
SLC7A9 |
NM021291 |
F: AGCCTCCTGCTGTGGTAGTG |
115 |
This study |
R: GCTGCCGTGAAGACATTC |
SLC7A5 |
NM011404.3 |
F: TATGATGTGGCTCCGATTCA |
108 |
This study |
R: GACACGGCAATGAGGAAGAG |
SLC6A14 |
NM020049.4 |
F: CCAACAATCTCACCTGCTTGA |
105 |
This study |
R: CCATTCCACTTGACCTCTGAA |
SLC7A6 |
NM_178798.3 |
F: TACATCCTGACCAACGTGGC |
101 |
24 |
R: ATGCCGAATGTCTGGTCAGC |
SLC6A20 |
NC_000075.6 |
F: GTCATCAACAGCTCCACCTC |
401 |
25 |
R: ATGGCCGCTGTATTTCCAAG |
Beta-actin |
NC_000071.6 |
F: GTCCACCTTCCAGCAGATGT |
117 |
55 |
R: GAAAGGGTGTAAAACGCAGC |
Serum DNA extraction and quantitative PCR (qPCR) analysis of PCV2
DNA was extracted from 40 μl serum using serum genomic DNA extraction kits (Betimes Biotechnology Co. Ltd, China) according to the manufacturer's instructions. DNA from the samples was eluted with 80 μl of elution buffer and stored at −20 °C until analysis. DNA extracts were utilized for quantification of PCV2 genomes using the real-time PCR. Prior to the quantification of PCV2 genomes in the samples, a PCR standard for PCV2 was established. Briefly, a PCV2 genome was cloned in the pMD®18-T Vector (TaKaRa) after PCR amplification with the following primers: forward, 5′-CCGCGGGCTGGCTGAACTTTTGAAAG-3′ and reverse, 5′-CCGCGGAAATTTCTGACAAACGTTAC-3′ (GenBank accession number: EU095020), and transformed in TOP10 competent cells (Invitrogen, Grand Island, NY, USA). The plasmid was prepared using a PureLink™ HiPure Plasmid Midiprep kit (Invitrogen). The PCV2 plasmid was mixed with the mouse DNA extracted from a PCV2 PCR-negative blood sample. Ten-fold dilutions of this mixture (from 1011 to 102 PCV2 copy numbers per μl) were used as a standard for PCV2 quantitation. The qPCR was performed to analyze the serum PCV2 load using a SYBR Green detection kit (Takara, China).13
Statistical analysis
Data are expressed as means ± the standard error of the mean (SEM). All statistical analyses were performed using the SPSS 16.0 software (Chicago, IL, USA). Data between PCV2 infected and control group were analyzed by the Student's t-test.23 The data about PCV2 virus load in PCV2 infected group among different time points were analyzed by the One-Way ANOVA method.22 Differences were considered significant at P < 0.05.
Results
Average daily gain
In this study, average daily gain was calculated in PCV2 group and control group at 3, 7, 10 and 14 DPI. No significant difference was observed between PCV2 group and control group at 3, 7, 10 and 14 DPI (data not shown).
Serum levels of amino acids
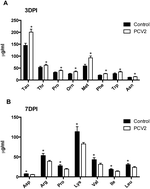
With isotope dilution liquid chromatography-mass spectrometry methods, 39 kinds of amino acids were detected in the serum. At 3 DPI, serum levels of most amino acids significantly increased (Table 2). These amino acids included Tau (P < 0.01), EtN (P < 0.01), Thr (P < 0.05), Sar (P < 0.01), 1MHis (P < 0.05), 3MHis (P < 0.05), Car (P < 0.05), Hcit (P < 0.05), CABA (P < 0.01), bAib (P < 0.01), Hyl (P < 0.01), Pro (P < 0.05), Orn (P < 0.05), Cth (P < 0.05), Met (P < 0.01), Phe (P < 0.05), Trp (P < 0.01) and Asn (P < 0.05) (Table 2, Fig. 1A). However, serum level of Aad significantly (P < 0.01) decreased at 3 DPI (Table 2). At 7 DPI, serum levels of Asp (P < 0.05), Sar (P < 0.05), Arg (P < 0.05), Hyl (P < 0.05), Pro (P < 0.05), Lys (P < 0.05), Val (P < 0.05), Ile (P < 0.01) and Leu (P < 0.05) in PCV2 group were significant lower than those in control group, whereas serum levels of Ans (P < 0.05), Car (P < 0.01) and bAla (P < 0.01) in PCV2 group were significant higher than those in control group (Table 2, Fig. 1B). At 10 DPI, serum levels of bAla (P < 0.05) and CABA (P < 0.01) significantly increased in PCV2 group, while serum level of bAib significantly (P < 0.01) decreased in PCV2 group (Table 2). At 14 DPI, serum levels of bAla (P < 0.01) and 3MHis (P < 0.05) significantly increased in PCV2 group, while serum level of bAib (P < 0.05) and Glu (P < 0.01) significantly decreased in PCV2 group (Table 2). Collectively, serum levels of most amino acids increase at 3 DPI, and decrease at 7 DPI, but have not obvious change at 10 and 14 DPI.
Table 2 Serum amino acid profile in PCV2 group and control groupa
Catalogue |
3DPI |
7DPI |
10DPI |
14DPI |
Serum levels (μg ml−1) of amino acids in PCV2 infection group (1) and control group (2) is measured by isotope dilution liquid chromatography-mass spectrometry methods at 3, 7, 10 and 14 days post infection (DPI) (N = 6). 1 means P < 0.01, 2 means P < 0.05. |
Pser |
1 |
0.06 ± 0.005 |
0.06 ± 0.005 |
0.06 ± 0.005 |
0.05 ± 0.007 |
2 |
0.06 ± 0.006 |
0.05 ± 0.004 |
0.05 ± 0.003 |
0.05 ± 0.008 |
![[thin space (1/6-em)]](https://www.rsc.org/images/entities/char_2009.gif) |
PEtN |
1 |
2.04 ± 0.35 |
2.04 ± 0.35 |
1.62 ± 0.31 |
1.62 ± 0.30 |
2 |
1.58 ± 0.16 |
1.32 ± 0.20 |
1.98 ± 0.13 |
2.10 ± 0.34 |
![[thin space (1/6-em)]](https://www.rsc.org/images/entities/char_2009.gif) |
Tau |
1 |
200.83 ± 12.231 |
145.17 ± 5.46 |
142.02 ± 9.78 |
120.88 ± 8.43 |
2 |
145.12 ± 9.04 |
134.58 ± 3.63 |
137.35 ± 5.21 |
135.67 ± 8.46 |
![[thin space (1/6-em)]](https://www.rsc.org/images/entities/char_2009.gif) |
Ser |
1 |
40.83 ± 2.90 |
30.32 ± 1.24 |
31.41 ± 1.83 |
30.96 ± 1.94 |
2 |
39.55 ± 3.15 |
31.41 ± 2.34 |
31.57 ± 1.73 |
32.03 ± 3.65 |
![[thin space (1/6-em)]](https://www.rsc.org/images/entities/char_2009.gif) |
Hyp |
1 |
5.54 ± 0.37 |
4.40 ± 0.21 |
3.49 ± 0.29 |
3.22 ± 0.20 |
2 |
5.05 ± 0.35 |
4.59 ± 0.38 |
3.42 ± 0.32 |
2.72 ± 0.26 |
![[thin space (1/6-em)]](https://www.rsc.org/images/entities/char_2009.gif) |
Gly |
1 |
37.55 ± 2.15 |
31.65 ± 1.74 |
28.77 ± 1.77 |
26.30 ± 0.97 |
2 |
32.66 ± 1.88 |
33.20 ± 2.63 |
30.37 ± 1.66 |
27.89 ± 2.47 |
![[thin space (1/6-em)]](https://www.rsc.org/images/entities/char_2009.gif) |
Gln |
1 |
70.65 ± 3.74 |
53.89 ± 5.04 |
57.81 ± 5.43 |
53.79 ± 2.56 |
2 |
60.95 ± 4.06 |
41.17 ± 2.27 |
57.12 ± 2.90 |
62.51 ± 6.87 |
![[thin space (1/6-em)]](https://www.rsc.org/images/entities/char_2009.gif) |
Asp |
1 |
5.42 ± 0.65 |
5.72 ± 0.50 |
4.33 ± 0.28 |
4.26 ± 0.53 |
2 |
4.65 ± 0.64 |
7.72 ± 0.402 |
4.86 ± 0.45 |
6.98 ± 0.631 |
![[thin space (1/6-em)]](https://www.rsc.org/images/entities/char_2009.gif) |
EtN |
1 |
4.93 ± 0.351 |
3.90 ± 0.13 |
3.45 ± 0.19 |
3.46 ± 0.15 |
2 |
3.50 ± 0.29 |
4.06 ± 0.24 |
3.17 ± 0.17 |
3.04 ± 0.33 |
![[thin space (1/6-em)]](https://www.rsc.org/images/entities/char_2009.gif) |
His |
1 |
31.01 ± 1.30 |
21.82 ± 1.57 |
28.36 ± 2.18 |
22.72 ± 1.89 |
2 |
26.57 ± 1.33 |
22.81 ± 1.28 |
26.87 ± 1.80 |
23.32 ± 2.28 |
![[thin space (1/6-em)]](https://www.rsc.org/images/entities/char_2009.gif) |
Thr |
1 |
62.52 ± 4.432 |
37.99 ± 1.63 |
51.57 ± 4.81 |
42.36 ± 3.17 |
2 |
53.51 ± 4.03 |
51.67 ± 6.03 |
53.51 ± 3.70 |
44.65 ± 4.59 |
![[thin space (1/6-em)]](https://www.rsc.org/images/entities/char_2009.gif) |
Cit |
1 |
36.50 ± 2.64 |
24.47 ± 2.12 |
27.38 ± 2.32 |
19.09 ± 1.63 |
2 |
32.92 ± 2.44 |
26.77 ± 2.71 |
28.94 ± 1.87 |
21.56 ± 1.43 |
![[thin space (1/6-em)]](https://www.rsc.org/images/entities/char_2009.gif) |
Sar |
1 |
0.67 ± 0.041 |
0.20 ± 0.03 |
0.20 ± 0.03 |
0.11 ± 0.01 |
2 |
0.32 ± 0.03 |
0.30 ± 0.062 |
0.24 ± 0.03 |
0.12 ± 0.03 |
![[thin space (1/6-em)]](https://www.rsc.org/images/entities/char_2009.gif) |
bAla |
1 |
1.14 ± 0.03 |
1.14 ± 0.071 |
0.91 ± 0.042 |
0.92 ± 0.041 |
2 |
1.04 ± 0.04 |
0.89 ± 0.04 |
0.77 ± 0.08 |
0.72 ± 0.02 |
![[thin space (1/6-em)]](https://www.rsc.org/images/entities/char_2009.gif) |
Ala |
1 |
75.12 ± 5.44 |
48.21 ± 2.08 |
54.35 ± 3.36 |
44.35 ± 4.20 |
2 |
66.86 ± 3.21 |
58.14 ± 4.67 |
58.92 ± 4.33 |
50.78 ± 5.85 |
![[thin space (1/6-em)]](https://www.rsc.org/images/entities/char_2009.gif) |
Glu |
1 |
39.52 ± 3.43 |
37.18 ± 3.43 |
32.39 ± 2.41 |
31.93 ± 3.14 |
2 |
36.70 ± 3.63 |
41.32 ± 2.03 |
35.38 ± 2.72 |
43.28 ± 3.561 |
![[thin space (1/6-em)]](https://www.rsc.org/images/entities/char_2009.gif) |
1MHis |
1 |
1.08 ± 0.102 |
1.04 ± 0.05 |
0.86 ± 0.04 |
0.96 ± 0.06 |
2 |
0.87 ± 1.09 |
1.06 ± 0.03 |
1.02 ± 0.07 |
1.14 ± 0.07 |
![[thin space (1/6-em)]](https://www.rsc.org/images/entities/char_2009.gif) |
3MHis |
1 |
0.72 ± 0.042 |
0.59 ± 0.10 |
0.49 ± 0.04 |
0.57 ± 0.022 |
2 |
0.52 ± 0.05 |
0.53 ± 0.04 |
0.47 ± 0.06 |
0.40 ± 0.03 |
![[thin space (1/6-em)]](https://www.rsc.org/images/entities/char_2009.gif) |
Car |
1 |
0.29 ± 0.062 |
0.47 ± 0.031 |
0.27 ± 0.08 |
0.32 ± 0.08 |
2 |
0.18 ± 0.02 |
0.21 ± 0.05 |
0.21 ± 0.02 |
0.37 ± 0.04 |
![[thin space (1/6-em)]](https://www.rsc.org/images/entities/char_2009.gif) |
Ans |
1 |
0.16 ± 0.02 |
0.20 ± 0.022 |
0.14 ± 0.01 |
0.12 ± 0.01 |
2 |
0.19 ± 0.03 |
0.14 ± 0.01 |
0.15 ± 0.02 |
0.09 ± 0.01 |
![[thin space (1/6-em)]](https://www.rsc.org/images/entities/char_2009.gif) |
Hcit |
1 |
0.23 ± 0.012 |
0.18 ± 0.01 |
0.12 ± 0.02 |
0.17 ± 0.01 |
2 |
0.17 ± 0.03 |
0.14 ± 0.02 |
0.14 ± 0.01 |
0.12 ± 0.01 |
![[thin space (1/6-em)]](https://www.rsc.org/images/entities/char_2009.gif) |
Arg |
1 |
61.25 ± 4.30 |
38.99 ± 2.49 |
52.04 ± 3.26 |
44.81 ± 5.58 |
2 |
58.57 ± 7.97 |
53.50 ± 5.442 |
56.75 ± 3.79 |
54.93 ± 3.98 |
![[thin space (1/6-em)]](https://www.rsc.org/images/entities/char_2009.gif) |
Aad |
1 |
0.64 ± 0.04 |
0.57 ± 0.07 |
0.53 ± 0.07 |
0.38 ± 0.03 |
2 |
1.18 ± 0.281 |
0.83 ± 0.13 |
0.60 ± 0.07 |
0.48 ± 0.05 |
![[thin space (1/6-em)]](https://www.rsc.org/images/entities/char_2009.gif) |
CABA |
1 |
0.42 ± 0.051 |
0.44 ± 0.06 |
0.32 ± 0.071 |
0.25 ± 0.05 |
2 |
0.20 ± 0.03 |
0.36 ± 0.06 |
0.10 ± 0.01 |
0.14 ± 0.03 |
![[thin space (1/6-em)]](https://www.rsc.org/images/entities/char_2009.gif) |
bAib |
1 |
0.28 ± 0.021 |
0.29 ± 0.01 |
0.36 ± 0.02 |
0.40 ± 0.01 |
2 |
0.18 ± 0.01 |
0.48 ± 0.02 |
0.48 ± 0.031 |
0.52 ± 0.022 |
![[thin space (1/6-em)]](https://www.rsc.org/images/entities/char_2009.gif) |
Abu |
1 |
0.79 ± 0.08 |
0.66 ± 0.07 |
0.68 ± 0.05 |
0.65 ± 0.06 |
2 |
0.81 ± 0.10 |
0.57 ± 0.03 |
0.67 ± 0.05 |
0.70 ± 0.06 |
![[thin space (1/6-em)]](https://www.rsc.org/images/entities/char_2009.gif) |
Hyl |
1 |
0.72 ± 0.061 |
0.37 ± 0.03 |
0.41 ± 0.02 |
0.32 ± 0.03 |
2 |
0.47 ± 0.04 |
0.50 ± 0.042 |
0.35 ± 0.03 |
0.31 ± 0.04 |
![[thin space (1/6-em)]](https://www.rsc.org/images/entities/char_2009.gif) |
Pro |
1 |
40.55 ± 2.312 |
19.50 ± 1.65 |
22.50 ± 1.33 |
16.78 ± 1.96 |
2 |
32.25 ± 2.15 |
27.64 ± 2.922 |
25.21 ± 1.65 |
19.98 ± 2.05 |
![[thin space (1/6-em)]](https://www.rsc.org/images/entities/char_2009.gif) |
Orn |
1 |
34.93 ± 3.442 |
20.88 ± 1.82 |
23.47 ± 1.32 |
17.82 ± 1.31 |
2 |
26.11 ± 2.18 |
23.78 ± 3.92 |
23.89 ± 2.40 |
18.81 ± 2.25 |
![[thin space (1/6-em)]](https://www.rsc.org/images/entities/char_2009.gif) |
Cth |
1 |
0.86 ± 0.042 |
0.50 ± 0.02 |
0.43 ± 0.09 |
0.50 ± 0.06 |
2 |
0.69 ± 0.06 |
0.45 ± 0.04 |
0.43 ± 0.07 |
0.46 ± 0.03 |
![[thin space (1/6-em)]](https://www.rsc.org/images/entities/char_2009.gif) |
Lys |
1 |
141.70 ± 11.44 |
82.85 ± 3.54 |
103.40 ± 8.13 |
92.57 ± 9.56 |
2 |
125.71 ± 6.39 |
113.64 ± 12.532 |
112.44 ± 10.23 |
94.35 ± 8.88 |
![[thin space (1/6-em)]](https://www.rsc.org/images/entities/char_2009.gif) |
Met |
1 |
92.64 ± 8.531 |
38.99 ± 7.16 |
48.05 ± 9.01 |
27.56 ± 3.62 |
2 |
59.34 ± 6.70 |
46.38 ± 7.08 |
45.19 ± 5.24 |
33.07 ± 6.08 |
![[thin space (1/6-em)]](https://www.rsc.org/images/entities/char_2009.gif) |
Val |
1 |
58.50 ± 4.52 |
31.36 ± 3.01 |
42.25 ± 1.26 |
34.90 ± 2.76 |
2 |
50.12 ± 4.76 |
43.31 ± 4.892 |
44.91 ± 3.57 |
34.24 ± 2.37 |
![[thin space (1/6-em)]](https://www.rsc.org/images/entities/char_2009.gif) |
Tyr |
1 |
28.41 ± 2.05 |
17.19 ± 0.99 |
18.61 ± 1.26 |
21.09 ± 1.66 |
2 |
26.61 ± 1.55 |
20.10 ± 1.97 |
20.01 ± 1.37 |
17.71 ± 1.84 |
![[thin space (1/6-em)]](https://www.rsc.org/images/entities/char_2009.gif) |
Ile |
1 |
22.53 ± 1.91 |
13.92 ± 1.34 |
18.32 ± 0.58 |
14.93 ± 1.16 |
2 |
20.03 ± 2.03 |
18.82 ± 1.771 |
19.14 ± 1.53 |
14.34 ± 0.94 |
![[thin space (1/6-em)]](https://www.rsc.org/images/entities/char_2009.gif) |
Leu |
1 |
39.15 ± 3.06 |
23.84 ± 2.13 |
30.48 ± 0.66 |
24.13 ± 2.15 |
2 |
33.87 ± 3.27 |
30.78 ± 2.582 |
32.14 ± 2.53 |
24.74 ± 1.88 |
![[thin space (1/6-em)]](https://www.rsc.org/images/entities/char_2009.gif) |
Phe |
1 |
26.48 ± 1.592 |
15.18 ± 0.84 |
18.50 ± 1.00 |
15.40 ± 1.04 |
2 |
20.37 ± 1.54 |
18.10 ± 1.17 |
19.24 ± 1.22 |
16.65 ± 1.21 |
![[thin space (1/6-em)]](https://www.rsc.org/images/entities/char_2009.gif) |
Trp |
1 |
33.93 ± 3.291 |
17.97 ± 1.88 |
18.40 ± 0.71 |
21.27 ± 1.46 |
2 |
26.87 ± 2.90 |
19.70 ± 1.33 |
22.45 ± 1.57 |
19.07 ± 1.53 |
![[thin space (1/6-em)]](https://www.rsc.org/images/entities/char_2009.gif) |
Asn |
1 |
14.11 ± 1.152 |
8.70 ± 0.48 |
8.96 ± 0.25 |
9.83 ± 0.91 |
2 |
11.58 ± 0.55 |
11.07 ± 1.48 |
9.41 ± 0.79 |
9.73 ± 0.94 |
 |
| Fig. 1 Serum levels of most changed amino acids. (A) Serum contents of most increased amino acids in porcine circovirus type 2 infected group (PCV2), compared to control group (control) at 3DPI. (B) Serum contents of most decreased amino acids in PCV2 group, compared to control group at 7DPI (n = 6, * means P < 0.05). | |
Amino acids transporters expression
To explain the results about serum levels of amino acids at 3 and 7 DPI, the expression of seven amino acids transporters was studied in the jejunum in PCV2 infected mice according to their functions. L-Type amino-acid transporter 1 (LAT1, SLC7A5) and LAT2 (SLC7A8) are responsive for Met, Leu, Ile, Val, Phe, Tyr and Trp transportation; while y+L amino acid transporter-1 (y+LAT1, SLC7A7) and y+LAT2 (SLC7A6) for Lys, Arg, Gln, His, Met and Leu; b(0,+)-type amino acid transporter 1 (b0,+ AT, SLC7A9) and sodium- and chloride-dependent neutral and basic amino acid transporter B(0+) (ATB0,+, SLC6A14) for Lys, Arg, Ala, Ser, Cys, Thr, Asn, Gln and His; and proline IMINO transporter (SIT1, SLC6A20) for Pro.24,25 As suggested in Fig. 2A, mRNA expression of SLC7A5 significantly (P < 0.05) decreased in PCV2 group at 3 DPI, while there was no significant difference about the expression of other transporters. Also, mRNA expression of SLC7A5 and SLC7A6 in PCV2 group were significant (P < 0.05) lower than those in control group at 7 DPI (Fig. 2B).
 |
| Fig. 2 Intestinal expression of amino acids transporters. The expression of seven intestinal amino acids transporters in the jejunum in porcine circovirus type 2 infected group (PCV2) and control group (control) is analyzed by RT-PCR at 3 DPI (A) and 7 DPI (B) (n = 6, duplicates,* means P < 0.05). | |
Serum PCV2 load
No PCV2 was detected in the serum from control group, whereas it was detected in PCV2 infected group in whole experimental period. The mean PCV2 log
10 genomic copies per ml were 1.11 ± 0.29 and 1.93 ± 0.54 at 3 and 7 DPI, respectively. Meanwhile, the serum load of PCV2 decreased from 7 DPI to 10 DPI (1.27 ± 0.28). At 14 DPI, only 2 out of 5 mice were positive for PCV2 (Table 3).
Table 3 PCV2 load in the serum in PCV2 infected group and control group serum PCV2 load in PCV2 infection group (1) and control group (2) is measured by quantitative PCR at 3, 7, 10 and 14 days post infection (DPI) (N = 6/5). The data means mean PCV2 log
10 genomic copies per ml; whereas N/N are the number of positive mice/the number of tested mice; PCV2: porcine circovirus type 2
Group |
3DPI |
7DPI |
10DPI |
14DPI |
1 |
6/6(1.11 ± 0.29) |
6/6(1.93 ± 0.54) |
6/6(1.27 ± 0.28) |
2/5(0.50 ± 0.00) |
2 |
0/6(0.00 ± 0.00) |
0/6(0.00 ± 0.00) |
0/6(0.00 ± 0.00) |
0/6(0.00 ± 0.00) |
Discussion
PCV2 infection has been found in America, Europe, Australia and Asia, and therefore imposes a significant economic burden on the swine industry.26–30 Thus, prophylactic measures have been taken against PCV2 infection, including antibiotics, the optimisation of housing and management conditions, vaccines, and breeding to increase relative resistance.10,31–35 Unfortunately, antibiotics are restricted to use for concerns about development of antimicrobial resistance and transference of antibiotic resistance genes from animals to human microbiota.9,10 Meanwhile, housing and management conditions frequently cannot be optimised due to economic pressures. Furthermore, vaccine may be associated with some disadvantages, including time, costs, and risk of failure.11 Thus, alternative methods are much needed in the treatment against PCV2 infection. From our previous studies, we have found that the usage of functional amino acids to modulate immune responses and enhance resistance to infectious diseases is frutiful to control PCV2 infection.4,13,15,36 However, the serum profile of amino acids after PCV2 infection is missing. Indeed, so far there is a paucity of data on amino acids profile in the pathogenesis of virus or bacterium infection.
In this study, serum amino acids profile was analyzed at 3, 7, 10 and 14 days of post PCV2 infection in mice. Isotope dilution liquid chromatography-mass spectrometry method was used in our analysis because it can detect nearly 40 kinds of amino acids in the serum.15,22,37 Currently, both liquid chromatography-mass spectrometry and gas chromatography-mass spectrometry are used to characterize amino acids quantification in tissues and plasma.38–40 Compared other methods used for amino acids analysis, liquid chromatography-mass spectrometry has been demonstrated to be the highest measurement precision among the techniques and a better overall sensitivity when compared to other approaches.40 For example, liquid chromatography-mass spectrometry can analyze the levels of arginine, cystine, and ornithine, which are not quantified by gas chromatography-mass spectrometry.40 Also, liquid chromatography-mass spectrometry is well known by its advantage of simplification of sample preparation because the analytes can be injected directly without derivatization.41 From this analysis, PCV2 infection significantly alters serum levels of amino acids. This change mainly comes up at 3 and 7 DPI with higher levels of most amino acids at 3 DPI, and lower levels of most amino acids at 7 DPI, compared to those in control group. The reasons for the altered serum levels of amino acids in PCV2 infection are various, like the change of absorption, transportation and metabolism. Infections commonly cause nonspecific psychological, physiological and behavioral changes. For example, the rate of energy expenditure (and hence the energy requirement) is increased by the fever, which generally accompanies the infectious process.42,43 Carbohydrate, the mainly energy substance, is inadequate to meet the increased energy requirement, while lipid stores are less effectively used in the infected patient, thus, protein metabolism is increased to generate amino acids to be used for gluconeogenesis.44–46 Meanwhile, whole body protein turnover increases after infection because various new proteins will be synthesized for stimulation of immune system or production of acute phase proteins.44 Thus, it is possible serum levels of amino acids increase at beginning of infection, and this could be a possible explanation for the increased levels of serum amino acids at 3 DPI. However, to validate this inference, amino acids profile in muscle, liver, and even in urine should be detected, and some enzymes activity for protein metabolism should be analyzed.
With the progress of infection, most amino acids would have been used for gluconeogenesis and new protein synthesis, which may explain the lower concentrations of amino acid in serum at 7 DPI. Meanwhile, anorexia is a common feature of infection.47 Its extent varies from a small reduction in food intake (5–10%) to complete cessation of eating.48,49 Anorexia may be another reason for the decreased levels of amino acids at 7 DPI. However, to validate this resonation, we need the data about average daily feed consumption from PCV2 infected mice and control mice. Unfortunately, this study could not provide this data for the feed of mice was pulverized. However, our previous investigations have indicated that PCV2 infection decreases the average daily feed consumption.13,15 With the progress of infection, host will be adaptive to infection and try to restore the new balance, which may explain why there is no much difference about the serum levels of amino acid between PCV2 group and control groups at 10 and 14 DPI. Indeed, this hypothesis is supported by the data from serum load of PCV2. PCV2 load gradually decreases from 7 DPI to 14 DPI. These results indicate that serum amino acids profile is markedly influenced by the pathogenesis of PCV2 infection.
The expression of some amino acid transporters in the jejunum was also analyzed because the jejunum is the major site of absorption for most amino acids.24,50 Only the transporters for Thr, His, Pro, Phe, Trp, Arg, Lys, Val, Ile and Leu were studied because the content of these amino acids is higher in the serum than others, such as Car, Ans and Hcit. Tau and Orn were not studied for they are not the basic amino acid.51,52 Accordingly, mRNA expression of SLC7A5, SLC7A6, SLC7A7, SLC7A8, SLC7A9, SLC6A14 and SLC7A20 were detected in the jejunum in PCV2 infected mice. From the data with RT-PCR, PCV2 infection decreases the expression of SLC7A5 and SLC7A6 at 7 DPI. This may also be a partial reason for the lower levels of amino acid at 7 DPI. We also observed that PCV2 infection decreases the expression of SLC7A5 at 3 DPI. We speculate that body protein turnover is increased at the beginning of PCV2 infection, overshadowing the decreased source of amino acids from the jejunum, resulting in a high level of some amino acids in the serum at 3 DPI. In these study, PCV2 infection has little effect on the mRNA expression of most amino acids transporters, including SLC7A7, SLC7A8, SLC7A9, SLC6A14 and SLC7A20. These data are showing that the mRNA expression of these transporters is not sensitive to PCV2 infection. Indeed, in our previous study also found that mycotoxin exposure has little effect on the intestinal expression of SLC7A1, SLC7A7, SLC1A1 and SLC5A1 in pigs.53 Interestingly, among eight critical intestinal amino acid transporters, including excitatory amino acid transporter-3 (EAAT-3), B0,+AT, sodium-glucose transporter-1 (SGLT-1), glucose transporter-2 (GLUT-2), dipeptide transporter-1 (PepT-1), Na+-dependent neutral amino acid exchanger-2 (ASCT-2), cationic amino acid transporter-1 (CAT-1) and LAT-1, we found that mRNA expression of LAT-1 (SLC7A5) significantly decreased after deoxynivalenol treatment, while there is no change about the mRNA expression of B0,+AT.54 These study are indicating SLC7A5 maybe a sensor of intestinal damage.
In conclusion, PCV2 infection increases serum levels of most amino acids at 3 DPI, while decreases serum levels of various amino acids at 7 DPI. Decreased expression of amino acids transporters in the jejunum may be response for the lower levels of amino acids in the serum at 7 DPI. As the progression of infection and recovery, no significant difference is found about serum contents of most amino acids at 10 and 14 DPI. To our knowledge, this is the first study to report the profile of amino acids the serum and expression of amino acid transporters in the jejunum after PCV2 infection. This study not only has vital implications on PCV2 research and treatment, but also is fruitful for the study and control of other virus or bacterium infection, i.e. porcine reproductive and respiratory syndrome (PRRS).
Competing interests
The authors have no conflicts of interest.
Acknowledgements
This study was supported by National Natural Science Foundation of China (No. 31301985), China Postdoctoral Science Foundation funded project (No. 2014M562111 and No. 2015T80871) an (No. 2015RS4035).
References
- B. R. Trible and R. R. Rowland, Virus Res., 2012, 164, 68–77 CrossRef CAS.
- S. Welti, T. Sydler, D. Wiederkehr, A. Pospischil, M. Hassig, E. Burgi and X. Sidler, Schweiz. Arch. Tierheilkd., 2012, 154, 417–427 CrossRef CAS PubMed.
- W. Ren, M. Wu, W. Luo, R. Huang, Y. Yin, Y. Li, T. Li and X. Yu, Br. J. Nutr., 2013, 1–8, DOI:10.1017/S0007114513000652.
- W. Ren, Y. Yin, G. Liu, X. Yu, Y. Li, G. Yang, T. Li and G. Wu, Amino Acids, 2012, 42, 2089–2094 CrossRef CAS.
- W. Ren, L. Zou, Z. Ruan, N. Li, Y. Wang, Y. Peng, G. Liu, Y. Yin, T. Li, Y. Hou and G. Wu, Amino Acids, 2013, 45, 555–561 CrossRef CAS PubMed.
- T. Opriessnig, D. M. Madson, M. Roof, S. M. Layton, S. Ramamoorthy, X. J. Meng and P. G. Halbur, J. Comp. Pathol., 2011, 145, 261–270 CrossRef CAS PubMed.
- L. Szeredi and C. Szentirmai, Acta Vet. Hung., 2008, 56, 101–109 CrossRef PubMed.
- G. Tico, J. Segales and J. Martinez, Vet. Microbiol., 2013, 163, 242–247 CrossRef CAS PubMed.
- S. Monroe and R. Polk, Curr. Opin. Microbiol., 2000, 3, 496–501 CrossRef CAS.
- S. Schwarz, C. Kehrenberg and T. R. Walsh, Int. J. Antimicrob. Agents, 2001, 17, 431–437 CrossRef CAS.
- G. J. Eamens, W. A. Forbes and S. P. Djordjevic, Vet. Microbiol., 2006, 115, 329–338 CrossRef CAS.
- W. Ren, Y. Li, X. Yu, W. Luo, G. Liu, H. Shao and Y. Yin, Br. J. Nutr., 2013, 1–8, DOI:10.1017/S0007114512006101.
- W. Ren, W. Luo, M. Wu, G. Liu, X. Yu, J. Fang, T. Li, Y. Yin and G. Wu, Amino Acids, 2013, 45, 479–488 CrossRef CAS PubMed.
- W. Ren, Y. Yin, G. Liu, X. Yu, Y. Li, G. Yang, T. Li and G. Wu, Amino Acids, 2012, 42, 2089–2094 CrossRef CAS PubMed.
- W. K. Ren, G. Liu, T. J. Li, J. Yin, X. S. Wu, M. M. Geng, W. Luo, R. Zheng and X. L. Yu, J. Food, Agric. Environ., 2012, 10, 485–490 CAS.
- W. Ren, M. Wu, W. Luo, R. Huang, Y. Yin, Y. Li, T. Li and X. Yu, Br. J. Nutr., 2013, 110, 1492–1499 CrossRef CAS PubMed.
- Z. B. Deng, A. W. Yuan, W. Luo, N. D. Wang, Q. L. Gong, X. L. Yu and L. Q. Xue, Acta Vet. Hung., 2013, 61, 234–243 CrossRef CAS PubMed.
- J. Li, X. Yuan, C. Zhang, L. Miao, J. Wu, J. Shi, S. Xu, S. Cui, J. Wang and H. Ai, Virol. J., 2010, 7, 158 CrossRef.
- Y. P. Wang, D. Liu, L. J. Guo, Q. H. Tang, Y. W. Wei, H. L. Wu, J. B. Liu, S. B. Li, L. P. Huang and C. M. Liu, Vaccine, 2013, 31, 833–838 CrossRef CAS.
- W. Ren, Y. Li, X. Yu, W. Luo, G. Liu, H. Shao and Y. Yin, Br. J. Nutr., 2013, 110, 1053–1060 CrossRef CAS.
- L. Wen, K. He, H. Yang, Y. Ni, X. Zhang, R. Guo and Q. Pan, Sci. China, Ser. C: Life Sci., 2008, 51, 453–458 CrossRef CAS PubMed.
- W. Ren, J. Yin, M. Wu, G. Liu, G. Yang, Y. Xion, D. Su, L. Wu, T. Li, S. Chen, J. Duan, Y. Yin and G. Wu, PLoS One, 2014, 9, e88335 Search PubMed.
- W. Ren, S. Chen, J. Yin, J. Duan, T. Li, G. Liu, Z. Feng, B. Tan, Y. Yin and G. Wu, J. Nutr., 2014, 144, 988–995 CrossRef CAS PubMed.
- M. H. Dave, N. Schulz, M. Zecevic, C. A. Wagner and F. Verrey, J. Physiol., 2004, 558, 597–610 CrossRef CAS PubMed.
- H. Takanaga, B. Mackenzie, Y. Suzuki and M. A. Hediger, J. Biol. Chem., 2005, 280, 8974–8984 CrossRef CAS PubMed.
- J. Choi, G. W. Stevenson, M. Kiupel, B. Harrach, L. Anothayanontha, C. L. Kanitz and S. K. Mittal, Can. J. Vet. Res., 2002, 66, 217–224 CAS.
- M. Fenaux, P. G. Halbur, M. Gill, T. E. Toth and X. J. Meng, J. Clin. Microbiol., 2000, 38, 2494–2503 CAS.
- S. Knell, H. Willems, B. Hertrampf and G. Reiner, Vet. Microbiol., 2005, 109, 169–177 CrossRef CAS.
- C. M. Ma, C. C. Hon, T. Y. Lam, V. Y. Li, C. K. Wong, T. de Oliveira and F. C. Leung, J. Gen. Virol., 2007, 88, 1733–1737 CrossRef CAS PubMed.
- J. Muhling, W. S. Raye, J. R. Buddle and G. E. Wilcox, Aust. Vet. J., 2006, 84, 421–425 CrossRef CAS PubMed.
- K. Frydendahl, Vet. Microbiol., 2002, 85, 169–182 CrossRef CAS.
- E. Meijerink, R. Fries, P. Vogeli, J. Masabanda, G. Wigger, C. Stricker, S. Neuenschwander, H. U. Bertschinger and G. Stranzinger, Mamm. Genome, 1997, 8, 736–741 CrossRef CAS.
- P. Vogeli, E. Meijerink, R. Fries, S. Neuenschwander, N. Vorlander, G. Stranzinger and H. U. Bertschinger, Schweiz. Arch. Tierheilkd., 1997, 139, 479–484 CAS.
- A. L. Vincent, J. R. Ciacci-Zanella, A. Lorusso, P. C. Gauger, E. L. Zanella, M. E. Kehrli Jr, B. H. Janke and K. M. Lager, Vaccine, 2010, 28, 2782–2787 CrossRef CAS PubMed.
- P. Kitikoon, A. L. Vincent, B. H. Janke, B. Erickson, E. L. Strait, S. Yu, M. R. Gramer and E. L. Thacker, Vaccine, 2009, 28, 523–531 CrossRef CAS PubMed.
- W. K. Ren, G. Yang, X. W. Tang, Y. H. Li, G. Liu, S. S. Cai, Y. L. Yin, X. L. Yu and G. Y. Wu, Amino Acids, 2011, 41, S51 Search PubMed.
- H. Yang, D. Fu, H. Shao, X. Kong, W. Wang, X. Yang, C. M. Nyachoti and Y. Yin, PLoS One, 2012, 7, e50921 CAS.
- M. J. Paik, S. M. Moon, K. R. Kim, S. Choi, Y. H. Ahn and G. Lee, Biomed. Chromatogr., 2008, 22, 339–342 CrossRef CAS.
- H. Kaspar, K. Dettmer, W. Gronwald and P. J. Oefner, J. Chromatogr. B: Anal. Technol. Biomed. Life Sci., 2008, 870, 222–232 CrossRef CAS PubMed.
- E. A. McGaw, K. W. Phinney and M. S. Lowenthal, J. Chromatogr. A, 2010, 1217, 5822–5831 CrossRef CAS PubMed.
- Y. Chen, Q. Liu, S. Yong and T. K. Lee, Clin. Chim. Acta, 2012, 413, 808–813 CrossRef CAS PubMed.
- V. E. Baracos, W. T. Whitmore and R. Gale, Can. J. Physiol. Pharmacol., 1987, 65, 1248–1254 CrossRef CAS.
- N. Stettler, Y. Schutz, R. Whitehead and E. Jequier, Pediatr. Res., 1992, 31, 102–106 CrossRef CAS PubMed.
- P. Y. Berclaz, C. Benedek, E. Jequier and Y. Schutz, Pediatr. Res., 1996, 39, 401–409 CrossRef CAS.
- C. L. Long, M. Jeevanandam, B. M. Kim and J. M. Kinney, Am. J. Clin. Nutr., 1977, 30, 1340–1344 CAS.
- P. J. Garlick, M. A. McNurlan, E. B. Fern, A. M. Tomkins and J. C. Waterlow, Br. Med. J., 1980, 281, 263–265 CrossRef CAS.
- I. I. Kyriazakis, B. J. Tolkamp and M. R. Hutchings, Anim. Behav., 1998, 56, 265–274 CrossRef.
- I. Kyriazakis, Anim. Feed Sci. Technol., 2010, 156, 1–9 CrossRef PubMed.
- J. G. M. Houdijk, F. M. Campbell, P. D. Fortomaris, P. D. Eckersall and I. Kyriazakis, Livest. Prod. Sci., 2007, 108, 182–185 CrossRef PubMed.
- S. Broer, Physiol. Rev., 2008, 88, 249–286 CrossRef CAS PubMed.
- G. Wu, Amino Acids, 2009, 37, 1–17 CrossRef CAS PubMed.
- G. Wu, F. W. Bazer, T. A. Davis, S. W. Kim, P. Li, J. Marc Rhoads, M. Carey Satterfield, S. B. Smith, T. E. Spencer and Y. Yin, Amino Acids, 2009, 37, 153–168 CrossRef CAS PubMed.
- J. Yin, W. Ren, J. Duan, L. Wu, S. Chen, T. Li, Y. Yin and G. Wu, Amino Acids, 2014, 46, 883–892 CrossRef CAS PubMed.
- L. Wu, P. Liao, L. He, W. Ren, J. Yin, J. Duan and T. Li, BMC Vet. Res., 2015, 11, 144 CrossRef PubMed.
- A. Bergstrom, M. B. Kristensen, M. I. Bahl, S. B. Metzdorff, L. N. Fink, H. Frokiaer and T. R. Licht, BMC Res. Notes, 2012, 5, 402 CrossRef CAS.
Footnotes |
† Dingfu Xiao and Jie Yin contributed equally to this study. |
‡ WR and JH designed the experiment. DX, JY, XH, XY and WL conducted the experiment. DX, GL and JY performed data analysis. DX and WR wrote the manuscript. |
|
This journal is © The Royal Society of Chemistry 2015 |
Click here to see how this site uses Cookies. View our privacy policy here.