Solvent assisted structural diversity: supramolecular sheet and double helix of a short aromatic γ-peptide†
Rajib Sarkar,
Mintu Debnath,
Krishnendu Maji and
Debasish Haldar*
Department of Chemical Sciences, Indian Institute of Science Education and Research Kolkata, Mohanpur, West Bengal 741246, India. E-mail: deba_h76@yahoo.com; deba_h76@iiserkol.ac.in; Fax: +913325873020; Tel: +913325873119
First published on 1st September 2015
Abstract
Solvent interaction has a significant effect on the folding and structural diversity of short aromatic γ-peptides that lead to a change in initial helical conformation. The internal rigidity of building blocks promotes the helical conformations of the γ-peptides containing m-aminobenzoic acid and N, N′-dicyclohexylurea. Various solution state NMR experiments show the existence of intermolecular hydrogen bonded structures of the short aromatic γ-peptides. In a polar protic solvent (MeOH), the helical strand interacts with the solvent molecules and expands to a more open (nearly extended) structure which further self-assembles to form a supramolecular sheet like structure. However, crystals obtained from chloroform show a supramolecular double helix which is stabilized by intermolecular hydrogen bonding and π–π stacking interactions. The report describes how significantly different self-assembled structures are developed from compounds folded in a subtly different manner by interaction with the solvent.
Introduction
Molecular motion and folding of designer molecules and supramolecular architectures held together by intermolecular noncovalent interactions are highly important for understanding the structure-function relationship of biological macromolecules.1 Nature creates a wide range of single and double helical macromolecules from combinations of regular building blocks such as twenty amino acids and four nucleobases.2 Biomacromolecules like proteins and DNA contain constant repetitive units due to enzyme-controlled natural polymerization reactions.3 Chemical synthesis of biopolymer mimic has advantage to vary the main chain as well.4 Like biomacromolecules, most of the reported synthetic foldamers have been constructed with the idea of a constant main chain and variable side chains,4 where side chains have critical role in folding and intermolecular interactions.5 Synthetic double-stranded molecules that held together by non-covalent interactions also have potential applications.6 For example, hydrogen-bonded duplexes obtained from linear oligoamide strands have been used as template for cross-olefin metathesis.7 The abiotic intertwined supramolecular duplexes8 assembled by H-bond donor/acceptor sites are known.9Structural transformation of biopolymers is a natural fact and is responsible for a range of diseases.10 However, few structural transformations are known where structural transformations are mainly associated with solvent.11 Ben-Naim and co-workers have reported the indirect solvent-induced effect specifically the role of the solute–solvent hydrogen bonding on the biopolymers within the framework of classical statistical mechanics.12 Foldamers also exhibit diverse structure in solvent.13 Fülöp et al. have reported the diverse self-assembly of peptidic foldamers.14
We have reported that the interstrand interactions between phenyl rings in the side chains significantly increased the hybridization constant of pyridine derived oligoamide foldamer.15,16 Recently, we have established that the hybridization of pyridine carboxyamide oligomers is dramatically enhanced with increasing oligoamide length and terminal Boc protection.17 Intriguing the information from previous reports we have designed short aromatic γ-peptides 1 and 2 (Fig. 1) from m-aminobenzoic acid and N,N′-dicyclohexylurea. In this report we have explored their remarkable solvent assisted structural transformation and aggregation behaviour. In polar protic solvent, the helical strand interacts with the solvent molecules and expands to a more open (extended) structure, which further self-assembles to form a supramolecular sheet like structure. But in chloroform, the peptide 1 dimerized as a parallel double helix stabilized by intermolecular hydrogen bonding interactions.
Results and discussion
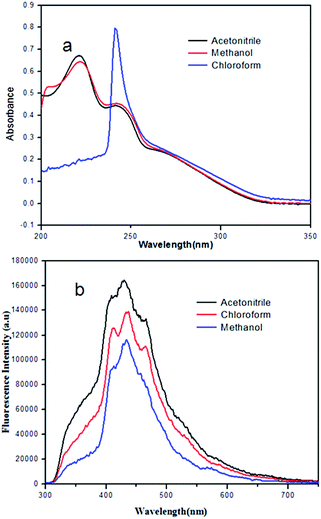
The short aromatic γ-peptides 1 and 2 were synthesized by conventional solution-phase methodologies with excellent yields (ESI Fig. S1†). In addition to 1H and 13C NMR spectroscopy, peptides 1 and 2 were characterized by FT-IR and mass spectrometry. The peptide 1 has been characterized by X-ray crystallography. The peptides containing m-aminobenzoic acid and N,N′-dicyclohexylurea have been designed with the assumption that the consecutive m-aminobenzoic acid should impart a helical nature in peptide backbone.18 The N,N′-dicyclohexylurea was used as a C terminal protecting agent as well as to enhance intermolecular hydrogen bonding interactions.The UV/vis spectroscopic studies of the short aromatic γ-peptides 1 and 2 in different solvents show that the peptides are interacting with the solvents (ESI Fig. S2†). Fig. 2a shows the typical UV-vis absorption spectra of γ-peptide 2 (0.023 mM). In methanol and acetonitrile γ-peptide 2 shows absorption bands at 223 and 245 nm due to the characteristic π–π* transition. But in chloroform the intensity of the band at 245 nm increased significantly and the band at 223 nm almost disappeared. The fluorescence spectra of γ-peptide 1 also exhibits broad band in acetonitrile and methanol but sharp peaks in chloroform (Fig. 2b), which indicates the diverse interaction between solvent molecules and peptides.
 | ||
| Fig. 2 (a) UV-vis spectra of peptide 2. (b) Fluorescence spectra of peptide 1 in different solvents. Excitation at 220 nm. | ||
In order to understand conformational features of the γ-peptides in solution, different NMR spectroscopic studies were performed. The variable concentration 1H NMR study in CDCl3 exhibits significant downfield shift of the amide protons with gradually increasing peptide concentration (ESI Fig. S3†), which suggests that the NH protons are hydrogen bonded. To determine whether the hydrogen bonds are intramolecular or intermolecular, solvent titration experiments have been performed (ESI Fig. S4†). The effects of adding a hydrogen bond accepting solvent like (CD3)2SO to CDCl3 solutions of peptides 1 and 2 are represented in Fig. 3. With the addition of small amounts of (CD3)2SO in CDCl3 solution of peptides, monotonic downfield shifts of exposed NH groups have been observed, though the solvent-shielded NH groups are generally unaffected.17 Fig. 3 shows that all NHs of peptides 1 and 2 are solvent exposed as it is evident from their significant chemical shifts upon addition of (CD3)2SO in CDCl3 solutions at 25 °C. For both the peptides, urea NH exhibits minimum chemical shift (Δδ 0.36 for peptide 1 and 0.12 for peptide 2) even at higher percentages of (CD3)2SO. From the solvent titration experiment, the Boc NH shows maximum chemical shift (Δδ 0.71 for peptide 1 and 0.52 for peptide 2). ESI Table S1† illustrates Δδ values of all NHs for peptides 1 and 2. The Maba(2)NH of peptide 1 is also solvent exposed (Δδ 0.61). For peptide 2 the Maba(2)NH shows large chemical shift (Δδ 0.6) than Maba(3)NH (Δδ 0.48). These results demonstrate that both peptides 1 and 2 cannot form any intramolecular hydrogen bonded structure in solution.19 The diffusion coefficients of peptide 1 in CDCl3 and MeOD are measured by NMR pulsed-gradient spin-echo experiments (ESI Fig. S6†).
 | ||
| Fig. 3 Plot of solvent dependence of NH chemical shift of peptides 1 and 2 at varying concentrations of DMSO-d6 in CDCl3 solutions. | ||
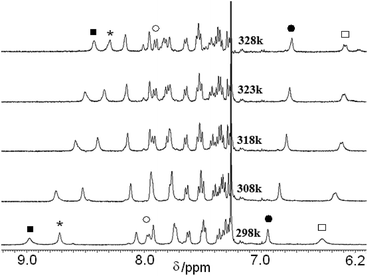
Further we have studied the variable temperature NMR experiments of peptides 1 and 2 in CDCl3. Upon heating of peptide 1 in CDCl3 the amide protons shifted to up-field direction (ESI Fig. S5†). The urea NH exhibits no chemical shift even at 328 K. The Maba(2)NH shows large chemical shift (Δδ 0.33) than Boc NH (Δδ 0.10). Fig. 4 shows the part of variable temperature 1H NMR spectra of peptide 2 in CDCl3. For peptide 2, the urea NH shows minimum chemical shift (Δδ 0.20) than Boc NH (Δδ 0.42). The Maba(3)NH shows large chemical shift (Δδ 0.54) than Maba(2)NH (Δδ 0.48). These results suggest that for both the peptides some hydrogen bonds are broken upon increasing temperature. So, in CDCl3, the peptides 1 and 2 have similar assembly pattern.
 | ||
| Fig. 4 Part of variable temperature 1H NMR spectra of peptide 2 in CDCl3. The fill square for Maba 3 NH, * for Maba 2 NH, fill circle for Maba 1 NH and square for urea NH. | ||
Solid state FT-IR spectroscopy has been used to study the conformational preferences of the γ-peptides. In FT-IR, the region of 3500–3200 cm−1 is important for the N–H stretching vibrations however the range 1800–1500 cm−1 is assigned for the stretching band of amide I and the bending peak of amide II.20 The FT-IR spectra of γ-peptide 1 (ESI Fig. S7†) exhibits N–H stretching frequency at 3297 cm−1 for hydrogen bonded N–H and amide peaks at 1644 and 1539 cm−1 indicating the presence of H-bonded structures.18 The γ-peptide 2 exhibits peak at 3297 cm−1 for N–H stretching frequency. The stretching band of amide I and the bending peak of amide II have appeared at 1655 and 1545 cm−1. These results indicate that the γ-peptides 1 and 2 have similar conformations.
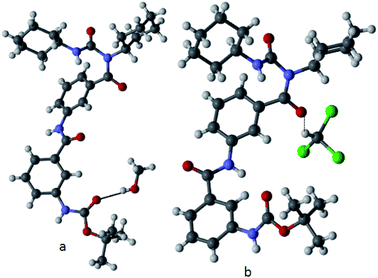
The conformational features of the γ-peptide 1 in solid state has been characterized by X-ray crystallography. Colourless orthorhombic crystals of peptide 1 suitable for X-ray diffraction studies were obtained from their methanol solution and chloroform–hexane solution by slow evaporation.21 From methanol solution, peptide 1 crystallizes with one molecule of methanol in the asymmetric unit (Fig. 5a). The methanol molecule forms a hydrogen bond (O–H⋯O) with Boc C![[double bond, length as m-dash]](https://www.rsc.org/images/entities/char_e001.gif) O of peptide 1. The Boc C
O of peptide 1. The Boc C![[double bond, length as m-dash]](https://www.rsc.org/images/entities/char_e001.gif) O and m-aminobenzoic acids (1) and (2) C
O and m-aminobenzoic acids (1) and (2) C![[double bond, length as m-dash]](https://www.rsc.org/images/entities/char_e001.gif) O are in same side (Fig. 5a). The torsion angle around the m-aminobenzoic acid residues (ϕ1 = 7.55°, ψ1 = 146.06°, ϕ2 = −8.88°, ψ2 = −128.25°) appears to play a critical role in dictating the overall open type extended backbone structures. However, in crystals from chloroform–hexane solutions, one molecule of peptide 1 crystallizes with one molecule of chloroform in the asymmetric unit (Fig. 5b).22 There is a C–H⋯O hydrogen bond between chloroform and peptide 1 m-aminobenzoic acid (2) C
O are in same side (Fig. 5a). The torsion angle around the m-aminobenzoic acid residues (ϕ1 = 7.55°, ψ1 = 146.06°, ϕ2 = −8.88°, ψ2 = −128.25°) appears to play a critical role in dictating the overall open type extended backbone structures. However, in crystals from chloroform–hexane solutions, one molecule of peptide 1 crystallizes with one molecule of chloroform in the asymmetric unit (Fig. 5b).22 There is a C–H⋯O hydrogen bond between chloroform and peptide 1 m-aminobenzoic acid (2) C![[double bond, length as m-dash]](https://www.rsc.org/images/entities/char_e001.gif) O. Interestingly, the Boc C
O. Interestingly, the Boc C![[double bond, length as m-dash]](https://www.rsc.org/images/entities/char_e001.gif) O and m-aminobenzoic acids (2) C
O and m-aminobenzoic acids (2) C![[double bond, length as m-dash]](https://www.rsc.org/images/entities/char_e001.gif) O are in same side but m-aminobenzoic acids (1) C
O are in same side but m-aminobenzoic acids (1) C![[double bond, length as m-dash]](https://www.rsc.org/images/entities/char_e001.gif) O is in opposite side (Fig. 5b). Also the torsion angles around the m-aminobenzoic acid residues (ϕ1 = 29.77°, ψ1 = 28.85°, ϕ2 = 153.93°, ψ2 = −142.08°) appears to play a critical role in dictating the overall helical structural features. From Fig. 5, the solid state conformation of peptide 1 from methanol solution is more open (extended, distance between Boc C
O is in opposite side (Fig. 5b). Also the torsion angles around the m-aminobenzoic acid residues (ϕ1 = 29.77°, ψ1 = 28.85°, ϕ2 = 153.93°, ψ2 = −142.08°) appears to play a critical role in dictating the overall helical structural features. From Fig. 5, the solid state conformation of peptide 1 from methanol solution is more open (extended, distance between Boc C![[double bond, length as m-dash]](https://www.rsc.org/images/entities/char_e001.gif) O and m-aminobenzoic acid (2) C
O and m-aminobenzoic acid (2) C![[double bond, length as m-dash]](https://www.rsc.org/images/entities/char_e001.gif) O is 8.310 Å) than that from chloroform–hexane solution (distance between Boc C
O is 8.310 Å) than that from chloroform–hexane solution (distance between Boc C![[double bond, length as m-dash]](https://www.rsc.org/images/entities/char_e001.gif) O and m-aminobenzoic acid (2) C
O and m-aminobenzoic acid (2) C![[double bond, length as m-dash]](https://www.rsc.org/images/entities/char_e001.gif) O is 6.818 Å).
O is 6.818 Å).
 | ||
| Fig. 5 Solid state conformation of peptide 1 (a) from methanol solution and (b) from chloroform–hexane solution. The hydrogen bonds are shown as dotted lines. | ||
Further, the peptide 1 from methanol solution forms methanol mediated anti parallel sheet like structure along crystallographic c direction. The sheet like structure is stabilizing through intermolecular hydrogen bonding interactions (N28–H28⋯O12, and N19–H19⋯O42) between two strands (Fig. 6). There is also a weak π–π interaction between m-amino benzoic acid residues (shortest C–C distance 4.13 Å) of two different strands. In this case the urea and Boc group have significant contributions on the stabilization of supramolecular anti parallel sheet like structure. The hydrogen bonding parameters are listed in Table 1.
 | ||
| Fig. 6 Methanol mediated anti parallel sheet like structure of peptide 1 along crystallographic c direction. The hydrogen bonds are shown as dotted lines. | ||
| D–H⋯A | H⋯A (Å) | D⋯A (Å) | D–H⋯A (°) | |
|---|---|---|---|---|
| a Symmetry element a = 1 − x, y, 1/2 − z, b = −1/2 + x, 1/2 + y, 1/2 − z, c = 1/2 − x, 1 − y, 1/2 + z. | ||||
| Pep.1 CHCl3 | N1–H1⋯O3a | 2.12(2) | 2.92(2) | 153(2) |
| N3–H3⋯O2a | 2.35(2) | 3.18(2) | 163(2) | |
| N4–H4⋯O5b | 2.01(2) | 2.83(2) | 161(2) | |
| Pep.1 MeOH | N19–H19⋯O42c | 2.09 | 2.92(2) | 162 |
| N28–H28⋯O12c | 2.25 | 3.05(2) | 157 | |
| N10–H10⋯O11c | 1.97 | 2.81(2) | 167 | |
| O42–H42⋯O35 | 2.10 | 2.88(2) | 161 | |
In higher order assembly, the supramolecular anti parallel sheets are further self-assemble by intermolecular hydrogen bonding interactions (N10–H10⋯O11) and hydrophobic interactions to form a corrugated sheet like structure along crystallographic b direction (Fig. 7).
 | ||
| Fig. 7 Corrugated sheet like structure of peptide 1 along crystallographic c direction. The hydrogen bonds are shown as dotted lines. | ||
For peptide 1 from chloroform–hexane solution, in higher order assembly, a parallel double helix has been observed.20 The duplex is stabilized through intermolecular hydrogen bonding interactions (N2–H2⋯O2 and N4–H4⋯O3) between two strands (Fig. 8). The hydrogen bonding parameters are listed in Table 1. There is also a weak π–π interaction between second m-amino benzoic acid residues (shortest C–C distance 4.74 Å) of two different strands.22 We have tried with many solvent compositions but do not obtain good quality crystals of peptide 2.
 | ||
| Fig. 8 Parallel double helix structure of peptide 1 from chloroform–hexane solution. The hydrogen bonds are shown as dotted lines. | ||
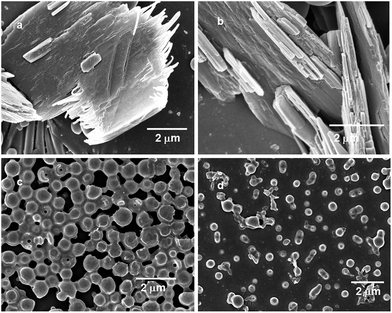
The field emission scanning electron microscopy (FE-SEM) have been used to examine if there is any change in morphology of peptide samples obtained from different solvents. From methanol solution, the short aromatic γ-peptides 1 and 2 exhibit layer by layer stacking of plate-like matrices (Fig. 9a and b respectively). But the morphology of the short aromatic γ-peptides 1 and 2 has completely changed in the samples prepared from chloroform solution. Both peptides 1 and 2 exhibit polydisperse microspheres morphology (Fig. 9c and d respectively). The diameter of the microspheres of peptide 1 is ca. 380 nm and that of peptide 2 is ca. 360 nm.
Conclusions
In summary, from the above solution and solid state studies we propose that in polar protic solvent the single helical γ-peptide strand interacts with the solvent molecules and expand to an open extended structure which further self-assembles to a supramolecular sheet like structure. However in solvent like chloroform the helical structure helps to accommodate the second molecule in the intertwining processes and thus increases the stability of the supramolecular double helix. The solvent has significant effect on molecular motions, folding and self-assembly of short aromatic γ-peptides.Experimental
General
All chemicals were purchased from Sigma chemicals.Synthesis
The γ-peptides were synthesized by conventional solution-phase methods. The C-terminus of amino acids was protected as a methyl ester and N-terminus of amino acids was protected by Boc group. Coupling was mediated by dicyclohexylcarbodiimide/1-hydroxyl benzotriazole (DCC/HOBt). The products were purified by column chromatography using silica (100–200 mesh size) gel as a stationary phase and n-hexane–ethyl acetate mixture as an eluent. The intermediates and final compounds were fully characterized by 500 MHz and 400 MHz 1H NMR spectroscopy, 125 MHz 13C NMR spectroscopy, FTIR spectroscopy and mass spectrometry. The peptide 1 was characterized by X-ray crystallography.NMR experiments
All NMR studies were carried out on a Brüker AVANCE 500 MHz spectrometer. Compound concentrations were in the range 1–10 mm in CDCl3 and (CD3)2SO.FTIR spectroscopy
All reported solid-state FTIR spectra were obtained with a Perkin Elmer Spectrum RX1 spectrophotometer with the KBr disk technique.Mass spectrometry
Mass spectra were recorded on a Q-Tof Micro YA263 high-resolution (Waters Corporation) mass spectrometer by positive-mode electrospray ionization.Single crystal X-ray diffraction study
Intensity data were collected with MoKα radiation using Bruker APEX-2 CCD diffractometer. Data were processed using the Bruker SAINT package and the structure solution and refinement procedures were performed using SHELX97.21 The non-hydrogen atoms were refined with anisotropic thermal parameters.†Field emission scanning electron microscopy
Morphologies of the reported γ-peptides were investigated using field emission-scanning electron microscopy (FE-SEM). A small amount of solution of the peptide was placed on a clean glass slide and then dried by slow evaporation. The material was then allowed to dry under vacuum at 30 °C for two days. The materials were gold-coated, and the micrographs were taken in an FE-SEM apparatus (Jeol Scanning Microscope-JSM-6700F).Acknowledgements
We acknowledge the CSIR, India, for financial assistance (Project No. 01/2507/11-EMR-II). R. Sarkar and M. Debnath acknowledge the CSIR, India for research fellowship. K. Maji thanks IISER-Kolkata for fellowship. We acknowledge Dr Rangeet Bhattacharyya and Ipsita Chakraborty, IISER-Kolkata for DOSY-NMR.Notes and references
- (a) C. Dolain, V. Maurizot and I. Huc, Angew. Chem., Int. Ed., 2003, 42, 2738–2740 CrossRef CAS PubMed; (b) S. Datta and S. Bhattacharya, Chem. Soc. Rev., 2015, 44, 5596–5637 RSC; (c) S. Saraogi and A. D. Hamilton, Chem. Soc. Rev., 2009, 38, 1726–1743 RSC; (d) T. A. Martinek and F. Fülöp, Chem. Soc. Rev., 2012, 41, 687–702 RSC; (e) C. K. McLaughlin, G. D. Hamblin and H. F. Sleiman, Chem. Soc. Rev., 2011, 40, 5647–5656 RSC.
- M. M. Cox and D. L. Nelson, Principles of biochemistry, W.H. Freeman and Company, New York, 2008 Search PubMed.
- A. Bruce. Molecular Biology of the Cell, Garland Science, New York, 2008 Search PubMed.
- (a) D. J. Hill, M. J. Mio, R. B. Prince, T. S. Hughes and J. S. Moore, Chem. Rev., 2001, 101, 3893–4011 CrossRef CAS PubMed; (b) R. P. Cheng, S. H. Gellman and W. F. DeGrado, Chem. Rev., 2001, 101, 3219–3232 CrossRef CAS PubMed.
- (a) Z.-T. Li, J.-L. Hou and C. Li, Acc. Chem. Res., 2008, 41, 1343–1353 CrossRef CAS PubMed; (b) D. Seebach and G. Gardiner, Acc. Chem. Res., 2008, 41, 1366–1375 CrossRef CAS PubMed; (c) B. Gong, Acc. Chem. Res., 2008, 41, 1376–1386 CrossRef CAS PubMed; (d) S. M. Hecht and I. Huc, Foldamers: Structure, Properties and Applications, Wiley-VCH, Weinheim, Germany, 2007 CrossRef; (e) C. M. Goodman, S. Choi, S. Shandler and W. F. DeGrado, Nat. Chem. Biol., 2007, 3, 252–262 CrossRef CAS PubMed; (f) Z.-T. Li, J.-L. Hou, C. Li and H.-P. Yi, Chem.–Asian J., 2006, 1, 766–778 CrossRef CAS PubMed.
- (a) M. Albrecht, Chem. Rev., 2001, 101, 3457–3498 CrossRef CAS PubMed; (b) C. Piguet, G. Bernardinelli and G. Hopfgartner, Chem. Rev., 1997, 97, 2005–2062 CrossRef CAS PubMed.
- X. Yang and B. Gong, Angew. Chem., Int. Ed., 2005, 44, 1352–1356 CrossRef CAS PubMed.
- D. Haldar and C. Schmuck, Chem. Soc. Rev., 2009, 38, 363–371 RSC.
- (a) K. Augustyns, F. Vandendriessche, A. Van Aerschot, R. Busson, C. Urbankel and P. Herdewijn, Nucleic Acids Res., 1992, 20, 4711–4716 CrossRef CAS PubMed; (b) M. Tarköy and C. Leumann, Angew. Chem., Int. Ed. Engl., 1993, 32, 1432–1434 CrossRef.
- (a) P. T. Lansbury, Acc. Chem. Res., 1996, 29, 317–323 CrossRef CAS; (b) G. Taubes, Science, 1996, 271, 1493–1495 CrossRef CAS PubMed; (c) R. Baumeister and S. Eimer, Angew. Chem., Int. Ed., 1998, 37, 2978–2982 CrossRef CAS; (d) S. Chen, F. A. Ferrone and R. Wetzel, Proc. Natl. Acad. Sci. U. S. A., 2002, 99, 11884–11889 CrossRef CAS PubMed; (e) Y. N. Machida, M. Kurosawa, N. Nukina, K. Ito, T. Oda and M. Tanaka, Proc. Natl. Acad. Sci. U. S. A., 2009, 106, 9679–9684 CrossRef PubMed; (f) L. Marzban and C. B. Verchere, Diabetes, 2004, 28, 39–47 Search PubMed; (g) S. B. L. Ng and A. Doig, Chem. Soc. Rev., 1997, 26, 425–432 RSC; (h) S. B. Prusiner, Proc. Natl. Acad. Sci. U. S. A., 1998, 95, 13363–13383 CrossRef CAS PubMed; (i) J. C. Rochet and P. T. Lansbury, Curr. Opin. Struct. Biol., 2000, 10, 60–68 CrossRef CAS PubMed.
- J. A. Schellman, Biopolymers, 1978, 17, 1305–1322 CrossRef CAS.
- A. Ben-Naim, K. L. Ting and R. L. Jernigan, Biopolymers, 1990, 29, 901–919 CrossRef CAS PubMed.
- (a) C. Tomasini and N. Castellucci, Chem. Soc. Rev., 2013, 42, 156–172 RSC; (b) G. Angelici, G. Falini, H. Hofmann, D. Huster, M. Monari and C. Tomasini, Angew. Chem., Int. Ed., 2008, 47, 8075–8078 CrossRef CAS PubMed; (c) F. Rúa, S. Boussert, T. Parella, I. Díez-Pérez, V. Branchadell, E. Giralt and R. M. Ortuño, Org. Lett., 2007, 9, 3643–3645 CrossRef PubMed; (d) G. Angelici, G. Falini, H. J. Hofmann, D. Huster, M. Monari and C. Tomasini, Chem.–Eur. J., 2009, 15, 8037–8048 CrossRef CAS PubMed.
- (a) T. Martinek, A. Hetényi, L. Fülöp, I. M. Mándity, G. K. Tóth, I. Dékány and F. Fülöp, Angew. Chem., Int. Ed., 2006, 45, 2396–2400 CrossRef CAS PubMed; (b) I. M. Mándity, L. Fülöp, E. Vass, G. K. Tóth, T. A. Martinek and F. Fülöp, Org. Lett., 2010, 12, 5584–5587 CrossRef PubMed; (c) A. Hetényi, I. M. Mándity, T. Martinek, G. K. Tóth and F. Fülöp, J. Am. Chem. Soc., 2005, 127, 547–553 CrossRef PubMed; (d) I. M. Mándity, A. Monsignori, L. Fülöp, E. Forró and F. Fülöp, Chem.–Eur. J., 2014, 20, 4591–4597 CrossRef PubMed.
- D. Haldar, H. Jiang, J.-M. Léger and I. Huc, Angew. Chem., Int. Ed., 2006, 45, 5483–5486 CrossRef CAS PubMed.
- D. Haldar, H. Jiang, J.-M. Léger and I. Huc, Tetrahedron, 2007, 63, 6322–6330 CrossRef CAS.
- B. Baptiste, J. Zhu, D. Haldar, B. Kauffmann, J.-M. Léger and I. Huc, Chem.–Asian J., 2010, 5, 1364–1375 CAS.
- (a) M. W. Giuliano, W. S. Horne and S. H. Gellman, J. Am. Chem. Soc., 2009, 131, 9860–9861 CrossRef CAS PubMed; (b) G. Guichard and I. Huc, Chem. Commun., 2011, 47, 5933–5941 RSC.
- (a) S. K. Maji, R. Banerjee, D. Velmurugan, A. Razak, H. K. Fun and A. Banerjee, J. Org. Chem., 2002, 67, 633–639 CrossRef CAS PubMed; (b) A. Bandyopadhyay, S. M. Mali, P. Lunawat, K. M. P. Raja and H. N. Gopi, Org. Lett., 2011, 13, 4482–4485 CrossRef CAS PubMed.
- (a) V. Moretto, M. Crisma, G. M. Bonora, C. Toniolo, H. Balaram and P. Balaram, Macromolecules, 1989, 22, 2939–2944 CrossRef CAS; (b) G. P. Dado and S. H. Gellman, J. Am. Chem. Soc., 1994, 116, 1054–1062 CrossRef CAS.
- Crystallographic data: Peptide 1: C32H42N4O5. CH3OH, Mw = 594.72, orthorhombic, space group P212121, a = 9.37131(17), b = 25.5346(4), c = 13.2574(2) Å, V = 3172.40(9)Å3, Z = 4, dm = 1.243 mg m−3. Peptide 1: C32H42N4O5. CHCl3: see ref. 20. Intensity data were collected with MoKα radiation at room temperature using Bruker APEX-2 CCD diffractometer. Data were processed using the Bruker SAINT package and the structure solution and refinement procedures were performed using SHELX97.23 The non-hydrogen atoms were refined with anisotropic thermal parameters. The hydrogen atoms were included in geometric positions and given thermal parameters equivalent to 1.2 times those of the atom to which they were attached. The final R values were for peptide 1, methanol : R1 0.0383 and wR2 0.1058 for 7198 data with I > 2σ(I).†.
- S. K. Maity, S. Maity, P. Jana and D. Haldar, Chem. Commun., 2012, 48, 711–713 RSC.
- G. M. Sheldrick, Shelx 97, University of Göttingen, Germany, 1997 Search PubMed.
Footnote |
| † Electronic supplementary information (ESI) available: Synthesis and characterization of peptides, 1H NMR, 13C NMR, Fig. S1–S30. CCDC 832274 and 1409895. For ESI and crystallographic data in CIF or other electronic format see DOI: 10.1039/c5ra12831e |
| This journal is © The Royal Society of Chemistry 2015 |


