Insight into the origin of ferromagnetism in Fe-doped ZnO diluted magnetic semiconductor nanocrystals: an EXFAS study of local structure†
Shiv Kumara,
Nidhi Tiwarib,
S. N. Jhab,
S. Chatterjeec,
D. Bhattacharyyab,
N. K. Sahoob and
Anup K. Ghosh*a
aMaterials Research Laboratory, Department of Physics, Banaras Hindu University, Varanasi-221 005, India. E-mail: akghosh@bhu.ac.in; anupkg66@gmail.com
bApplied Spectroscopy Division, Bhabha Atomic Research Centre, Mumbai-400085, India
cDepartment of Physics, Indian Institute of Technology, Banaras Hindu University, Varanasi-221 005, India
First published on 28th October 2015
Abstract
In this paper we have studied the structural, local structural and magnetic properties of sol–gel derived Zn1−xFexO (0 ≤ x ≤ 0.06) nanoparticles. The crystalline structure and crystallite size have been estimated by X-ray diffraction with Rietveld refinement and high-resolution transmission electron microscopy (HRTEM). Other structural and local structural properties have been studied by extended X-ray absorption fine structure (EXAFS)-, X-ray absorption near edge structure (XANES)- and Raman-analysis. Weak ferromagnetism is observed at room temperature and magnetization increases with increasing Fe-concentration. The oxygen vacancy assisted bound magnetic polarons (BMPs) and possibly the grain boundaries are responsible for this room temperature ferromagnetism. Variation of resistivity with temperature has also been studied. Appearance of ferromagnetism in ZnO![[thin space (1/6-em)]](https://www.rsc.org/images/entities/char_2009.gif) :
:![[thin space (1/6-em)]](https://www.rsc.org/images/entities/char_2009.gif) Fe nanoparticles may open the potential in bio-imaging and drug-delivery applications.
Fe nanoparticles may open the potential in bio-imaging and drug-delivery applications.
Introduction
Ferromagnetic ordering at room temperature in diluted magnetic semiconductors (DMSs)1 have recently attracted great interest for their promising applications in the field of spintronics and many other spin-based devices.2,3 Although a few devices based on GMR in ferromagnetic/non-magnetic/ferromagnetic type hetero-structures have been successfully fabricated, the major success of spintronics is still waiting for the development of the DMSs.2,3 Doping of wide band-gap semiconductors with transition metal (TM) elements such as Mn, Fe, Co, etc. gives an effective mean of tuning both the ferromagnetism4–8 and the optical properties.9–12 Hence both the charge and spin of electrons can be utilized for devices such as light emitting devices, spin field-effect transistors and spin based quantum computers etc. Moreover, the ability of tailoring the physical properties of nanocrystals (NCs) by changing their size and surface functionality produces NCs an attractive building block for functional devices. Again, the principal requirement for realization of spintronic devices depends on the development of DMSs with ferromagnetism at room temperature (RTFM) or above ambient temperature.2,3 Therefore, much efforts have been paid to make TM-doped wide band gap DMSs nanostructures those exhibit ferromagnetic ordering above room temperature, high mobility and charge carrier concentration for spin-based applications.13,14Zinc oxide (ZnO) is a wide direct band gap (Eg ∼ 3.37 eV) II–VI semiconductor with hexagonal wurtzite structure of C46v (P63mc) space group. ZnO has been identified as a promising host material after theoretical prediction for potential ferromagnetism above room temperature in several TM doped ZnO-based DMSs.15,16 Thereafter, quite controversial results on TM-doped ZnO have been reported.16–19 For examples, Tamura et al.17 got RTFM in Fe-doped ZnO thin film while not for Mn- and Co-doped ZnO. Singhal et al. reported weak ferromagnetism at room temperature in colloidal Fe-doped ZnO nanocrystals and described that as an intrinsic property.18 Kumar et al. also have shown weak ferromagnetism at room temperature in polycrystalline Fe-doped ZnO nanorods.19 On the other hand, Mishra et al.20 reported the weak ferromagnetism at room temperature in Fe doped ZnO nanocrystals and Zn-vacancy was taken to be responsible behind the ferromagnetic order. In some recent studies,21 magnetic anisotropy of the dopant cation has been proposed to be a signature of intrinsic ferromagnetism in dilute magnetic oxide materials.
Therefore, discrepancies in the experimental results for the same DMS materials prepared by different methods and/or by different researcher groups have created doubts about the origin of ferromagnetism in these materials. Hence, although there is significant progress and exciting experimental data, the origin of ferromagnetic ordering in DMS nanostructures remain poorly understood. The doping concentrations in DMSs are usually well below the percolation limit to explain on the basis of double-exchange or super-exchange interaction which are used for magnetic interactions in oxides.22 Very recently, Straumal et al. showed that the grain boundary (GB) and hence grain boundary specific area (SGB) is one of the controlling factors for the ferromagnetic behavior of undoped and TM-doped ZnO.23,24 Again, Kumar et al.8 observed room temperature weak ferromagnetism in Co doped system in which the joint effects of grain boundaries, oxygen vacancy and bound magnetic polarons (BMPs) were considered for room temperature ferromagnetism (RTFM). Hence, magnetism in Fe-doped ZnO nanoparticles is an interesting and controversial issue to be solved. Moreover, to insight into the origin of ferromagnetic ordering, local structure around Zn atoms in Fe-doped ZnO nanocrystals has been studied by EXAFS and X-ray Absorption Near Edge Structure (XANES) measurements.
On the other hand, magnetic- and DMS-nanoparticles, due to their unique physical (viz. luminescent and magnetic properties) and chemical properties, have many advantages in biomedical applications, such as contrast agents for bio-imaging, as colloidal mediators for magnetic hyperthermia or as active constituents of drug-delivery platform.25–27 These unique properties are based on their similarity in size with bio-molecules, large surface areas, and quantum size effects. ZnO nanoparticles have shown promising potential in biomedical applications such as bio-imaging and drug delivery.27 Appearance of ferromagnetism in ZnO![[thin space (1/6-em)]](https://www.rsc.org/images/entities/char_2009.gif) :
:![[thin space (1/6-em)]](https://www.rsc.org/images/entities/char_2009.gif) Fe nanoparticles opens the potential in bio-imaging applications. In a well-planned in vivo experiment, the nanocomposites of ZnO nanoparticles loaded with drugs or ZnO hollow spheres containing drugs are injected into a mouse27 and nanocomposites were able to penetrate cancer cells. Since the tumor and cancer cells have acidic environments in lysosomes and endosomes, the ZnO nanocomposites were decomposed and released the drugs. This process was detected by magnetic resonance imaging (MRI). Considering their wide range of applications, the impact of ZnO and Fe-doped ZnO nanomaterials on human health and the environment is of great interest.
Fe nanoparticles opens the potential in bio-imaging applications. In a well-planned in vivo experiment, the nanocomposites of ZnO nanoparticles loaded with drugs or ZnO hollow spheres containing drugs are injected into a mouse27 and nanocomposites were able to penetrate cancer cells. Since the tumor and cancer cells have acidic environments in lysosomes and endosomes, the ZnO nanocomposites were decomposed and released the drugs. This process was detected by magnetic resonance imaging (MRI). Considering their wide range of applications, the impact of ZnO and Fe-doped ZnO nanomaterials on human health and the environment is of great interest.
In this paper we have studied on the structural, local-structural, optical, and magnetic properties of Fe-doped ZnO (i.e. Zn1−xFexO) nanocrystals to get a clear understanding of the origin of ferromagnetic ordering for the application in biomedical imaging.
Experimental details
Zn1−xFexO (0 ≤ x ≤ 0.06) samples (named Fe0, Fe0.5, Fe1, Fe1.5, Fe2, Fe4, and Fe6 for Fe-concentration x = 0, 0.005, 0.01, 0.015, 0.02, 0.04, and 0.06 respectively) have been synthesized by the sol–gel method. Appropriate proportions of analytical grade metal nitrates Zn(NO3)2·6H2O (purity ∼ 99.9%) and Fe(NO3)3·9H2O (purity ∼ 99.9%) powders were thoroughly mixed. With stirring the mixture was dissolved in aqueous solution of citric acid [C6H8O7] (purity ∼ 99.6%) to obtain a homogeneous precursor solution. The citric acid acts as a fuel for the reaction. The precursor solution was dried at 80 °C for 3 h to obtain a xerogel and the swelled xerogel was kept at 130 °C for 12 h. The simplified exothermic reaction can be expressed as:| M(NO3)2 + C6H8O7 + 4O2 → MO + 2NO2 + 6CO2 + 4H2O; (M = Zn, Fe). |
After grinding, the xerogel powders were sintered at 600 °C for 10 h in air atmosphere to get Zn1−xFexO nanoparticles.
Structural characterization of Zn1−xFexO samples was performed by X-ray diffractometer (Model: Miniflex-II, Rigaku, Japan) with Cu Kα radiation (λ = 1.5406 Å). The EXAFS measurements have been carried out at the Raja Ramanna Centre for Advanced Technology (RRCAT), Indore, India with the dispersive EXAFS beamline (BL-8) at the INDUS-2 Synchrotron Source (2.5 GeV, 120 mA). Above beam line uses a 460 mm long Si (111) crystal mounted on a mechanical crystal bender that can bend the crystal to the shape of an ellipse. The crystal selects a particular band of energy from white synchrotron radiation depending on the grazing angle of incidence (Bragg angle) and disperses as well as focuses the beam on the sample. The beam line has a resolution of 1 eV at the photon energy of 10 keV. For getting a reasonable edge jump, appropriate weights of the powdered sample have been mixed thoroughly with cellulose powder (to get a total weight of approximately 150 mg so that 2.5 mm thick homogenous pellets of 12.5 mm diameter were made). TEM and HRTEM measurements were done with Technai G2 S-Twin (FEI, Netherlands). Fourier transmission infrared (FT-IR) spectra of the samples (as pellets with KBr) were obtained using FT-IR Spectrometer (Spectrum One, Perkin Elmer Instrument, USA) in the range of 400–4000 cm−1 with a resolution of 1 cm−1. Raman spectra were taken with a Reinshaw micro-Raman spectroscope in the range of 200–1250 cm−1 using 514.5 nm Ar+ laser as excitation source. The powder samples are made into pellets for the Raman measurements.
The D.C. magnetization (M–H) measurements have been carried out by a Physical Properties Measurement System (PPMS) of Cryogenics Inc, USA and by a Vibrating Sample magnetometer (VSM) from Lakeshore (Model no: 7407). The resistivity measurements were carried out by the conventional two-probe method fitted with a Closed Cycle Cryo-cooler.
Results and discussions
Structure and composition
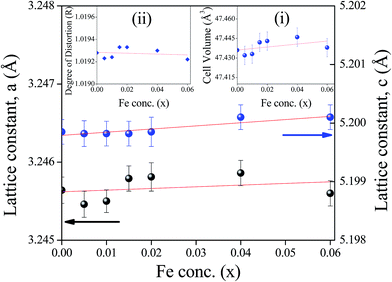
From Rietveld refinement of the X-ray diffraction data, the lattice parameters (‘a’ and ‘c’) have been measured and their variation with Fe-concentration (x) is shown in Fig. 2. The volume of the unit cell for a hexagonal system has been calculated from the equation:28
| V = 0.866 × a2 × c | (1) |
Variation of the unit cell volume with Fe-concentration calculated from eqn (1) is shown in the inset (i) of Fig. 2. The figure reveals that there is small increase in the lattice parameters ‘a’ and ‘c’ and the volume of the unit cell due to increase of Fe-ion doping. This result is similar to the previous observations.29–32 Moreover, FT-IR study9 confirms that Fe-ions does not enter into the octahedral coordination (as discussed latter). To explain small increment of lattice parameters ‘a’ and ‘c’ and unit cell volume (V), we have considered the distortion of Zn tetrahedron33,34 due to Fe-doping. In an ideal wurtzite structure there are two interpenetrating hexagonal-close-packed (hcp) sub-lattices with two lattice parameters, a and c, in the ratio of  . Again, a/c is the measure of the distortion from its ideal tetrahedron and the degree of distortion
  where R = 1 gives the ideal wurtzite structure35 with
  . In a real ZnO crystal, the wurtzite structure deviates from the ideal arrangement, by changing the a/c ratio or the R value. The variation of the degree of distortion R is shown in the inset (ii) of Fig. 2. In wurtzite ZnO, the Zn-tetrahedron has the base in the ab-plane and the apex along the c-direction. Different parameters such as a, c, c/a, bond lengths, bond angles, etc. have been calculated from Rietveld refinement and following Morkoc and Özgür,33,34 (Table 1). Variations of bond angles and bond lengths with Fe-concentration are shown in Fig. 3(a) and (b) respectively. From Fig. 3(a) it has been observed that the average basal bond angles (Ob–Zn–Ob) and average base-apex angles (Ob–Zn–Oa) [where Ob and Oa are oxygen atoms at the base and at the apex of the tetrahedron respectively] are constant with Fe-doping. However, both the bond length of Zn–Oa and Zn–Ob bonds increase slowly [Fig. 3(b)] giving rise to the slow increase of the lattice parameters a and c. The increase in Zn–O bond lengths have also been observed by EXAFS measurements (discussed latter) and have been attributed to the substitution of Zn2+ ions (ionic radius 0.60 Å) by Fe3+ ions of smaller size (ionic radius 0.49 Å), as confirmed by XANES measurement. The degree of distortion R [inset (ii) of Fig. 2] remains constant with Fe-concentration suggests that both the parameters a and c varies with the same manner with Fe-concentration. The linear increase of the unit cell volume (V) has been justified by quadratic increase of ‘a’. Again, linear variation of lattice constants ‘a’ and ‘c’ with increasing Fe-concentration confirms that the doping of Fe-ions does not change the wurtzite structure (space group P63mc) of ZnO and Fe-ion has been substituted into the crystal lattice following the Vegard's law.36 Variations of interplanar spacing (d-value) of (100) plane with increasing Fe-concentration are plotted in the inset of Fig. 3(b) which shows that d-value of (100) plane decreases with increasing Fe-concentration. This observation can be explained with the change of the bond lengths. The variation of bond lengths develops the lattice strain.28 This lattice strain changes the d-spacing (spacing of crystallographic planes). The Bragg angle should either decrease or increase when d-spacing changes. Thus, uniform compressive strain with decreasing the d-spacing shifts a Bragg's peak to higher 2θ value, whereas the uniform tensile strain with increasing the d-spacing shifts a Bragg's peak to lower 2θ value in the spectrum. Since the d-spacing for the (100) plane is decreased with Fe-concentration, [inset of Fig. 3(b)] we say that a uniform compressive strain (hence stress) has been developed in the perpendicular direction of the plane (100). The crystallite size and lattice strain developed in different samples have been estimated from Williamson–Hall (W–H) plot37 (see Table 2). A better estimation of the size and strain parameters has been obtained from ‘size–strain plot’ (SSP)38 by using the following equation:
 | (2) |
![[thin space (1/6-em)]](https://www.rsc.org/images/entities/char_2009.gif) cos
cos![[thin space (1/6-em)]](https://www.rsc.org/images/entities/char_2009.gif) θ/λ)2 vs. (dhkl2β
θ/λ)2 vs. (dhkl2β![[thin space (1/6-em)]](https://www.rsc.org/images/entities/char_2009.gif) cos
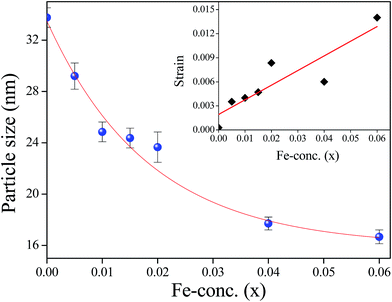
cos![[thin space (1/6-em)]](https://www.rsc.org/images/entities/char_2009.gif) θ/λ2) is shown in Fig. 4. The crystallite size (D) and average strain (ε) have been estimated from the slope and the intercept of the linear fit of the plot respectively (see Table 2). Fig. 5 shows the variation of crystallite size (D) and inset of Fig. 5 shows the variation of average strain (ε) with x estimated from size–strain plot. It has been observed that the average crystallite size decreases with the increase of Fe-concentration. This result is consistent with the observation of Mishra et al.20 However, it reported the qualitative decrement of the crystallite size where as we have observed an exponential decay which is consistent with our earlier report9 calculated from Debye–Scherrer's equation. This is may be because of incorporation of smaller size cation (Fe3+) in ZnO lattice. Thus different trends in particle size and lattice constant may be attributed to the intra and inter nucleating forces forming the nanocrystals.11
θ/λ2) is shown in Fig. 4. The crystallite size (D) and average strain (ε) have been estimated from the slope and the intercept of the linear fit of the plot respectively (see Table 2). Fig. 5 shows the variation of crystallite size (D) and inset of Fig. 5 shows the variation of average strain (ε) with x estimated from size–strain plot. It has been observed that the average crystallite size decreases with the increase of Fe-concentration. This result is consistent with the observation of Mishra et al.20 However, it reported the qualitative decrement of the crystallite size where as we have observed an exponential decay which is consistent with our earlier report9 calculated from Debye–Scherrer's equation. This is may be because of incorporation of smaller size cation (Fe3+) in ZnO lattice. Thus different trends in particle size and lattice constant may be attributed to the intra and inter nucleating forces forming the nanocrystals.11
| Parameters | Fe0 | Fe0.5 | Fe1 | Fe1.5 | Fe2 | Fe4 | Fe6 |
|---|---|---|---|---|---|---|---|
| a (Å) | 3.24564 | 3.24546 | 3.24550 | 3.24579 | 3.24581 | 3.24586 | 3.24560 |
| c (Å) | 5.19985 | 5.19982 | 5.19982 | 5.19982 | 5.19985 | 5.2001 | 5.20010 |
| c/a | 1.60210 | 1.60218 | 1.60217 | 1.60202 | 1.60202 | 1.60207 | 1.60219 |
| U | 0.37986 | 0.37985 | 0.37985 | 0.37988 | 0.37988 | 0.37987 | 0.37985 |
| dZn–Oa (Å) | 1.97521 | 1.97515 | 1.97518 | 1.97530 | 1.97532 | 1.97537 | 1.97526 |
| dZn–Ob (Å) | 1.97526 | 1.97517 | 1.97519 | 1.97531 | 1.97532 | 1.97538 | 1.97527 |
| Oa–Zn–Ob (°) | 108.43732 | 108.43960 | 108.43939 | 108.43356 | 108.43356 | 108.43556 | 108.43980 |
| Ob–Zn–Ob (°) | 110.48503 | 110.48283 | 110.48304 | 110.48874 | 110.48864 | 110.48673 | 110.48271 |
| Sample | Particle Size (nm) | Strain | |||
|---|---|---|---|---|---|
| Scherrer formula | Size–strain plot | W–H plot | Size–strain plot | W–H plot | |
| Fe0 | 32 | 34 | 33 | 2.9 × 10⁻⁴ | 4.9 × 10⁻⁵ |
| Fe0.5 | 25 | 29 | 30 | 3.5 × 10⁻³ | 3.9 × 10⁻⁴ |
| Fe1 | 22 | 25 | 25 | 4.0 × 10⁻³ | 3.8 × 10⁻⁴ |
| Fe1.5 | 21 | 24 | 26 | 4.7 × 10⁻³ | 6.4 × 10⁻⁴ |
| Fe2 | 18 | 23 | 25 | 8.4 × 10⁻³ | 1.3 × 10⁻³ |
| Fe4 | 15 | 17 | 20 | 6.0 × 10⁻³ | 1.2 × 10⁻³ |
| Fe6 | 14 | 16 | 20 | 14.0 × 10⁻³ | 2.7 × 10⁻³ |
 | ||
Fig. 4 (dhklβ![[thin space (1/6-em)]](https://www.rsc.org/images/entities/char_2009.gif) cos cos![[thin space (1/6-em)]](https://www.rsc.org/images/entities/char_2009.gif) θ/λ)2 vs. (dhkl2β θ/λ)2 vs. (dhkl2β![[thin space (1/6-em)]](https://www.rsc.org/images/entities/char_2009.gif) cos cos![[thin space (1/6-em)]](https://www.rsc.org/images/entities/char_2009.gif) θ/λ2) plot of the ZnO θ/λ2) plot of the ZnO![[thin space (1/6-em)]](https://www.rsc.org/images/entities/char_2009.gif) : :![[thin space (1/6-em)]](https://www.rsc.org/images/entities/char_2009.gif) Fe samples to estimate crystallite size (D) and average strain (ε). Fe samples to estimate crystallite size (D) and average strain (ε). | ||
![[thin space (1/6-em)]](https://www.rsc.org/images/entities/char_2009.gif) 367 eV. Fig. 7 represents the experimental EXAFS (μ(E) versus E) spectra of Fe doped ZnO NCs at Zn K-edge.
367 eV. Fig. 7 represents the experimental EXAFS (μ(E) versus E) spectra of Fe doped ZnO NCs at Zn K-edge.
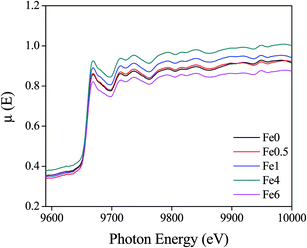 | ||
| Fig. 7 Normalized experimental EXAFS (μ(E) vs. E) for undoped and Fe doped ZnO nanocrystals at Zn K-edge. | ||
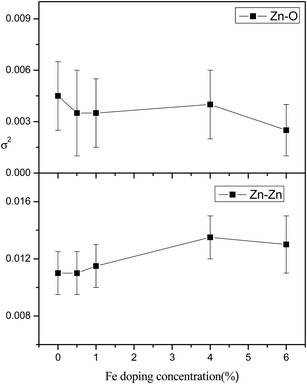
The radial distribution function or the χ(R) vs. R (or FT-EXAFS) spectra in terms of the real distances from the center of the absorbing atom have been generated from the μ(E) versus E spectra following the standard procedures.42 A set of EXAFS data analysis program (available within the IFEFFIT software package) have been used for reduction and fitting of the experimental EXAFS data.43 This includes data reduction and Fourier transform to derive the χ(R) vs. R spectra from the absorption spectra (using ATHENA software), generation of the theoretical EXAFS spectra starting from an assumed crystallographic structure and finally fitting of the experimental data with the theoretical spectra using the FEFF 6.0 code (using ARTEMIS software). The bond distances, co-ordination numbers (including scattering amplitudes) and disorder (Debye–Waller) factors (σ2) which give the mean square fluctuations in the distances, have been used as fitting parameters. It should be mentioned here that the passive electron reduction factor (S02 value) obtained by fitting the FT-EXAFS spectrum of the undoped ZnO sample has been used in case of fitting the spectra of the Fe doped samples.
Fig. 8 shows the FT-EXAFS [χ(R) vs. R] spectra of undoped and Fe doped ZnO samples at the Zn K edge with the best fit theoretical spectra. The theoretical FT-EXAFS spectra have been generated assuming the model described by Kisi et al.44 namely the first oxygen shell (Zn–O1) at 1.98 Å with coordination number (CN) of 3, second oxygen shell (Zn–O2) at 1.99 Å having CN of 1 and a Zn shell (Zn–Zn) at 3.21 Å with a CN of 12 in order to fit the first few peaks (in the k range of 3–10 Å−1 and upto 3.5 Å in R space) obtained in the χ(R) versus R spectra of the samples. The variation in average bond lengths of the first two Zn–O shells and the bond length of the Zn–Zn shell along with the uncertainties involved in the estimation is shown in Fig. 9, while total coordination numbers of the two Zn–O shells and coordination number of the Zn–Zn shell is shown in Fig. 10. Average Debye–Waller factors (σ2) of the first two Zn–O shells and that of the Zn–Zn shell is shown in Fig. 11 as a function of Fe doping concentration. From Fig. 9 it is observed that up to 1% Fe doping, Zn–O bond lengths increase with increase in Fe doping concentration. This corroborates with the Fe K edge XANES results (given below) which shows that Fe3+ substitutes Zn2+ in ZnO lattice and since ionic radius of Fe3+ (0.49 Å) is less than Zn2+ (0.60 Å), Fe atoms substituted in Zn sites attract oxygen atoms closer resulting in elongation of Zn–O bond lengths. Similar changes in bond lengths due to doping have been observed in many cases, for example in case Mn doped ZnO by Basu et al.45 and in Zr doped TiO2 samples observed by Lippens et al.46 which were explained on the basis of difference in ionic radius. Also substitution of Fe atoms in Fe3+ states increases oxygen coordination in the neighborhood of Fe atoms to establish charge balance. This leads to reduction of oxygen coordination in the neighborhood of Zn atoms manifesting the presence of oxygen vacancies in the sample which increases with increase in Fe doping concentration as shown in Fig. 10. It is corroborated with our earlier result that for dopant with lower ionic radius, oxygen vacancies are created near the host site i.e. in the neighborhood of Zn. However, Zn–Zn bonds remain almost unaltered due to low values of doping. It should also be noted that for more than 1% Fe doping, Zn sites get distorted significantly as manifested by the steep increase in Debye–Waller factor at Zn sites as shown in Fig. 11. It also corroborates by the fact that for more than 1% Fe doping, Zn–Zn bond length decreases significantly.
 | ||
| Fig. 9 Variation of bond lengths of Zn–O shells and Zn–Zn shells with change in doping concentration. | ||
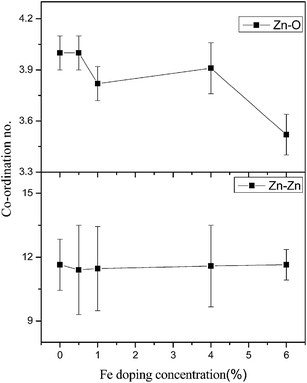 | ||
| Fig. 10 Variation of total coordination number of Zn–O shells and Zn–Zn shells with change in doping concentration. | ||
| Vibration frequency (cm−1) | Assignments | Process | ||||||
|---|---|---|---|---|---|---|---|---|
| Fe0 | Fe0.5 | Fe1 | Fe1.5 | Fe2 | Fe4 | Fe6 | ||
| 329 | 328 | 327 | 327 | 327 | 328 | 329 | E2H–E2L | Second order |
| 378 | 379 | 378 | 380 | 380 | 398 | 398 | A1(TO) | First order |
| 408 | — | — | — | — | — | — | E1(TO) | First order |
| 434 | 435 | 435 | 435 | 434 | 434 | 434 | E2H | First order |
| 575 | 576 | 579 | 577 | 575 | 574 | 574 | A1(LO) | First order |
| 585 | — | — | — | — | — | — | E1(LO) | First order |
| 658 | 658 | 659 | 659 | 659 | 680 | 680 | 2(E2H–E2L) | Second order of (E2H–E2L) |
| 1142 | 1124 | 1150 | 1144 | 1147 | 1120 | 1120 | 2[A1(LO)] | Second order of A1(LO) |
 | ||
| Fig. 14 Room temperature M–H curves of the Zn1−xFexO (0 ≤ x ≤ 0.06) samples. Inset figure shows the enlarged view of Fe0 (ZnO) and Fe2 samples. | ||
To investigate the origin of RT-ferromagnetism (FM) in Fe-doped ZnO, several mechanisms proposed in the literature have been considered viz. (i) the possibility of spurious ferromagnetism due to magnetic impurities as the intrinsic property of the doped NPs, (ii) extended defects in the NPs, (iii) formation of some Fe-related nanoscale secondary phase, (iv) metallic iron precipitation, and (v) formation of FeO/Fe2O3. However, contributions of FeO/Fe2O3 phases can be ruled out because presence of separate FeO/Fe2O3 phase was not found in the samples with XRD, EXAFS, and TEM measurements. Secondly, metallic Fe clusters and Fe-related secondary phases are also unlike source of this FM because of XRD, EXAFS, and HRTEM results. Since in the present case, undoped ZnO prepared under identical conditions as those of Fe-doped ZnO samples, does not exhibit any measurable ferromagnetism but shows diamagnetism, impurities cannot contribute to the observed magnetic moment in the Fe-doped ZnO NPs. Thus, TMs essentially plays the key role to the observed FM. Again, recently Straumal et al. showed that the grain boundary specific area (the ratio of the grain boundary area to the volume) SGB, is the controlling factor for the ferromagnetic behavior of undoped and TM-doped ZnO.23,24 For Fe-doped ZnO nanocrystals Straumal et al.61 argued that the samples are FM only if SGB exceeds a certain threshold value Sth = 3 × 10⁴ m2 m−3. For our system SGB value is well above the threshold value viz. SGB = 41 × 106 m2 m−3 giving the FM. Hence, FM is expected to arise due to the joint effect of the intrinsic exchange interaction of magnetic moments of TM ions and effects of the grain boundary in doped NPs.
However, the exact mechanism of intrinsic FM in TM-doped oxides is still controversial.11,21 Number of diverse theories have been proposed, such as (I) the localized magnetic moments are assumed to interact with each other via carrier (free electron)-mediated Ruderman–Kittel–Kasuya–Yosida (RKKY)-type interactions, (II) the mean-field Zener Model,15 (III) the double exchange (direct interaction) mechanism16 or superexchange mechanism (indirect interaction). In double exchange mechanism magnetic ions in different charge states (d states of TM ions) couple with each other by virtual hopping of the extra electron from one ion to the other through interaction with p-orbitals. Superexchange mechanism is an indirect exchange interaction between non-neighboring magnetic ions which is mediated by a non-magnetic ion which is placed in between the magnetic ions. (IV) the donor impurity band exchange model, where the FM in DMSs is accounted for by an indirect exchange via shallow donor electrons that form bound magnetic polarons (BMP).62–64
Since the RKKY interaction is based on free electrons and ZnO is not transformed into a metal with such a low doping (confirmed by electrical resistivity measurements discussed in the next Sec.), RKKY interaction is not valid here. Double-exchange or superexchange are not responsible for the FM because the magnetic cations are dilute (of low concentration) in the present samples. However, according to donor impurity band exchange model the combination of magnetic cations, carriers, and defects can result in bound magnetic polarons (BMPs) which may also lead to the RTFM.62–64 From the XANES and EXAFS results described above it has been found that oxygen vacancies are present in the samples which increases with increase in Fe doping concentration. Thus, we think that oxygen vacancy assisted BMPs contribute to the RTFM in this system.62–65 Similar results have also been observed in case of Co doped ZnO samples.8 Therefore, we suggest that the joint effects of the intrinsic exchange interactions arising from the oxygen vacancy assisted bound magnetic polarons (BMPs) and the (extrinsic) grain boundary are responsible for the room temperature FM in this system.
Electronic transport properties
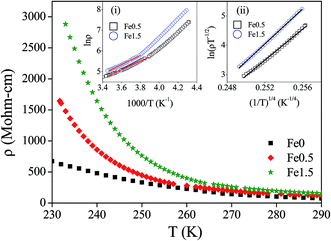
Temperature variation of electrical resistivity (ρ) of Fe-doped ZnO samples has been measured to see the effect Fe-doping on the electrical conduction. The results have been shown in Fig. 15. The exponential decrease in resistivity with increasing temperature tells that Fe-doped ZnO samples maintain the semiconducting nature for all Fe-concentrations as that of undoped ZnO. This observation rules out the possibility of Zn1−xFexO to become metallic due to Fe-doping. This result corroborates the result of XANES study. The plot of ln![[thin space (1/6-em)]](https://www.rsc.org/images/entities/char_2009.gif) ρ vs. 1000/T (inset (i) of Fig. 15) shows two different slopes in the low and high temperature regions which is the signature of two different conduction mechanisms being active in these two temperature regions. The liner fit shows that thermally activated band conduction is the dominant mechanism at high-temperature region. The thermally activated resistivity at high temperature region follows the Arrhenius law:
ρ vs. 1000/T (inset (i) of Fig. 15) shows two different slopes in the low and high temperature regions which is the signature of two different conduction mechanisms being active in these two temperature regions. The liner fit shows that thermally activated band conduction is the dominant mechanism at high-temperature region. The thermally activated resistivity at high temperature region follows the Arrhenius law:
ρ(T) = ρ0![[thin space (1/6-em)]](https://www.rsc.org/images/entities/char_2009.gif) exp[Ea/kBT] exp[Ea/kBT]
| (3) |
| Sample | Activation energy Ea (eV) |
|---|---|
| Fe0 | 0.233 ± 0.019 |
| Fe0.5 | 0.347 ± 0.007 |
| Fe1.5 | 0.394 ± 0.007 |
| Fe4 | 0.376 ± 0.011 |
The deviation from the linear fit of ln![[thin space (1/6-em)]](https://www.rsc.org/images/entities/char_2009.gif) ρ vs. 1000/T plot (inset (i) of Fig. 15) indicates that thermal activation mechanism is not valid at low temperature region. The variable-range-hopping (VRH) conduction of polarons has been found to dominate in this low temperature region. The conduction mechanism due to the variable range hopping of polaron at low temperature can be described by the Mott's equation:8,66,67
ρ vs. 1000/T plot (inset (i) of Fig. 15) indicates that thermal activation mechanism is not valid at low temperature region. The variable-range-hopping (VRH) conduction of polarons has been found to dominate in this low temperature region. The conduction mechanism due to the variable range hopping of polaron at low temperature can be described by the Mott's equation:8,66,67
ρ(T) = ρ0![[thin space (1/6-em)]](https://www.rsc.org/images/entities/char_2009.gif) exp[T0/T]1/4 exp[T0/T]1/4
| (4) |
| ρ0 = {[8παkBT/N(EF)]1/2}/(3e2νph) | (5) |
and,
| T0 = 18α3/[kBN(EF)] | (6) |
Summary and conclusions
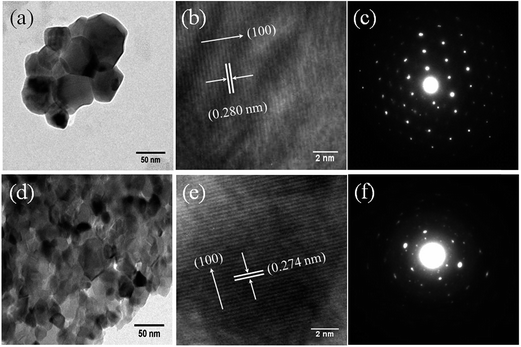
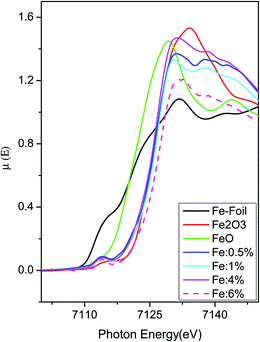
Here we have presented the results of the extensive studies on sol–gel derived Fe-doped ZnO diluted magnetic semiconductors (DMSs) nanoparticles. The X-ray diffraction data with Rietveld refinement, HRTEM, and micro-Raman analysis show that Fe-doped ZnO nanoparticles have wurtzite structure as that of pure ZnO. Furthermore, these results indicate that Fe-ions have entered in Zn-sites by substituting the Zn ions. Crystallite structure, morphology, and size have been estimated by XRD and HRTEM. The estimated size of the crystallites decreases exponentially with the increase of Fe-concentration which is due to the difference of the ionic radii between Zn and Fe atoms. The EXAFS results show that the reduction in oxygen coordination has taken place which manifests generation of oxygen vacancies in the samples due to Fe doping. The oxygen coordination remains lower and DW factor remains higher compared to their respective values in undoped ZnO suggests that doping takes place properly throughout the whole composition range. The DW factor for the next near Zn shell shows that Fe-doping affects the O site more than the Zn/Fe site. The substitution of Zn ions by Fe ions does not cause any significant change in the host lattice as manifested in the values of the bond distances. XANES study clearly rules out the presence of metallic Fe clusters, FeO and Fe2O3 phases in the samples. However it indicates that Fe gets incorporated in the ZnO lattice as Fe3+ causing creation of oxygen vacancies. These observations corroborate to those of EXAFS study. Raman study reveals that the local symmetry in the Fe-doped nanocrystals gradually differ from that of undoped sample, but the crystal structure remains the same as that of the wurtzite structure of pure ZnO; which further supports the incorporation of Fe-ions in the ZnO lattice. Room temperature (weak) ferromagnetism (RTFM) is observed from M–H measurements and magnetization increases with increasing Fe-concentration. The joint effects of the intrinsic exchange interactions arising from oxygen vacancy assisted bound magnetic polarons (BMPs) and the extrinsic grain boundary are responsible for the room temperature FM in this system. Temperature variation of resistivity measurements show two types of conduction mechanism viz. thermally activated conduction (Arrhenius) mechanism is valid in the high temperature region and Mott's variable-range hopping (VRH) mechanism is valid in low temperature region for low Fe-concentrations (0 ≤ x ≤ 0.02) where only thermally activated conduction (Arrhenius) mechanism is observed for high Fe-concentrations (x ≥ 0.04).Acknowledgements
AKG is thankful to CSIR, India, DAE-BRNS, India and UGC, India for financial support (Grant no.: 03(1302)/13/EMR-II, 2011/37P/11/BRNS/1038 and 42-787/2013(SR) respectively), to Prof. Ranjan Kr. Singh and to Prof. A. Barman for Raman Spectroscopy and VSM facility respectively.References
- Diluted Magnetic Semiconductors, Semiconductors and Semimetals, ed. J. K. Furdyna and J. Kossut, Academic Press, New York, 1988, vol. 25 Search PubMed.
- S. A. Wolf, D. D. Awschalom, R. A. Buhrman, J. M. Daughton, S. von Molnar, M. L. Roukes, A. Y. Chtchelkanova and D. M. Treger, Science, 2001, 294, 1488–1495 CrossRef CAS PubMed.
- Y. Ohno, D. K. Young, B. Beschoten, F. Matsukura, H. Ohno and D. D. Awschalom, Nature, 1999, 402, 790–792 CrossRef CAS.
- I. Djerdj, G. Garnweitner, D. Arcon, M. Pregelj, Z. Jaglicic and M. Niederberger, J. Mater. Chem., 2008, 18, 5208–5217 RSC.
- J. Chaboy, R. Boada, C. Piquer, M. A. Laguna-Marco, M. García-Hernández, N. Carmona, J. Llopis, M. L. Ruíz-González, J. González-Calbet, J. F. Fernández and M. A. García, Phys. Rev. B: Condens. Matter Mater. Phys., 2010, 82, 064411 CrossRef.
- I. Balti, A. Mezni, A. Dakhlaoui-Omrani, P. Leone, B. Viana, O. Brinza, L. S. Smiri and N. Jouini, J. Phys. Chem. C, 2011, 115, 15758–15766 CAS.
- I. Bilecka, L. Luo, I. Djerdj, M. D. Rossell, M. Jagodic, Z. Jaglicic, Y. Masubuchi, S. Kikkawa and M. Niederberger, J. Phys. Chem. C, 2011, 115, 1484–1495 CAS.
- S. Kumar, S. Basu, B. Rana, A. Barman, S. Chatterjee, S. N. Jha, D. Bhattacharyya, N. K. Sahoo and A. K. Ghosh, J. Mater. Chem. C, 2014, 2, 481–495 RSC.
- S. Kumar, S. Mukherjee, R. K. Singh, S. Chatterjee and A. K. Ghosh, J. Appl. Phys., 2011, 110, 103508 CrossRef.
- B. Panigrahy, M. Aslam and D. Bahadur, Nanotechnology, 2012, 23, 115601 CrossRef PubMed.
- J. A. Sans, J. F. Sánchez-Royo, A. Segura, G. Tobias and E. Canadell, Phys. Rev. B: Condens. Matter Mater. Phys., 2009, 79, 195105 CrossRef.
- S. Kumar, S. Chatterjee, K. K. Chattopadhyay and A. K. Ghosh, J. Phys. Chem. C, 2012, 116, 16700–16708 CAS.
- S. J. Pearton, C. R. Abernathy, M. E. Overberg, G. T. Thaler, D. P. Norton, N. Theodoropoulou, A. F. Hebard, Y. D. Park, F. Ren, J. Kim and L. A. Boatner, J. Appl. Phys., 2003, 93, 1 CrossRef CAS.
- K. C. Sebastian, M. Chawda, L. Jonny and D. Bodas, Mater. Lett., 2010, 64, 2269–2272 CrossRef CAS.
- T. Dietl, H. Ohno, F. Matsukura, J. Cibert and D. Ferrand, Science, 2000, 287, 1019–1022 CrossRef CAS PubMed.
- K. Sato and H. K. Yoshida, Jpn. J. Appl. Phys., 2000, 39, L555–L558 CrossRef CAS.
- T. Tamura and H. Ozaki, J. Phys.: Condens. Matter, 2009, 21, 026009 CrossRef CAS PubMed.
- A. Singhal, S. N. Achary, A. K. Tyagi, P. K. Manna and S. M. Yusuf, Mater. Sci. Eng., B, 2008, 47, 153 Search PubMed.
- S. Kumar, Y. J. Kim, B. H. Koo, S. K. Sharma, J. M. Vargas, M. Knobel, S. Gautam, K. H. Chae, D. K. Kim, Y. K. Kim and C. G. Lee, J. Appl. Phys., 2009, 105, 07C520 Search PubMed.
- A. K. Mishra and D. Das, Mater. Sci. Eng., B, 2010, 171, 5–10 CrossRef CAS.
- M. Venkatesan, C. B. Fitzgerald, J. G. Lunney and J. M. D. Coey, Phys. Rev. Lett., 2004, 93, 177206 CrossRef CAS PubMed.
- J. B. Goodenough, Magnetism and the Chemical Bonds, Inter Science Publishers, New York, 1963 Search PubMed.
- B. B. Straumal, A. A. Mazilkin, S. G. Protasova, P. B. Straumal, A. A. Myatiev, G. Schütz, E. J. Goering, T. Tietze and B. Baretzky, Philos. Mag., 2013, 93, 1371–1383 CrossRef CAS.
- B. B. Straumal, S. G. Protasova, A. A. Mazilkin, G. Schütz, E. Goering, B. Baretzky and P. B. Straumal, JETP Lett., 2013, 97, 367–377 CrossRef CAS.
- X. Gao, Y. Cui, R. M. Levenson, L. W. K. Chung and S. Nie, Nat. Biotechnol., 2004, 22, 969–976 CrossRef CAS PubMed.
- T. L. Doane and C. Burda, Chem. Soc. Rev., 2012, 41, 2885–2911 RSC.
- H. M. Xiong, Adv. Mater., 2013, 25, 5329–5335 CrossRef CAS PubMed.
- A. K. Zak, W. H. A. Majid, M. E. Abrishami and R. Yousefi, Solid State Sci., 2011, 13, 251–256 CrossRef.
- S. J. Han, J. W. Song, C. H. Yang, S. H. Park, J. H. Park, Y. H. Jeong and K. W. Rhie, Appl. Phys. Lett., 2002, 81, 4212–4214 CrossRef CAS.
- D. Karmakar, S. K. Mandal, R. M. Kadam, P. L. Paulose, A. K. Rajarajan, T. K. Nath, A. K. Das, I. Dasgupta and G. P. Das, Phys. Rev. B: Condens. Matter Mater. Phys., 2007, 75, 144404 CrossRef.
- J. Anghel, A. Thurber, D. A. Tenne, C. B. Hanna and A. Punnoose, J. Appl. Phys., 2010, 107, 09E314 CrossRef.
- R. Saleh, S. P. Prakoso and A. Fishli, J. Magn. Magn. Mater., 2012, 324, 665–670 CrossRef CAS.
- H. Morkoç and Ü. Özgür, Zinc Oxide-Fundamentals, Materials and Device Technology, WILEY-VCH Verlag GmbH, Germany, 2009 Search PubMed.
- Ü. Özgür, Y. I. Alivov, C. Liu, A. Teke, M. A. Reshchikov, S. Doğan, V. Avrutin, S.-J. Cho and H. Morkoç, J. Appl. Phys., 2005, 98, 041301 CrossRef.
- M. Gaudon, O. Toulemonde and A. Demourgues, Inorg. Chem., 2007, 46, 10996–11002 CrossRef CAS PubMed.
- J. Luo, J. K. Liang, Q. L. Liu, F. S. Liu, Y. Zhang, B. J. Sun and G. H. Rao, J. Appl. Phys., 2005, 97, 086106 CrossRef.
- G. K. Williamson and W. H. Hall, Acta Metall., 1953, 1, 22–31 CrossRef CAS.
- E. Prince and J. K. Stalick, Accuracy in Powder Diffraction II, NIST Special Publication, 1992, vol. 597 Search PubMed.
- S. Basu, S. Varma, A. N. Shirsat, B. N. Wani, S. R. Bharadwaj, A. Chakrabarti, S. N. Jha and D. Bhattacharrya, J. Appl. Phys., 2013, 113, 043508 CrossRef.
- S. Basu, D. K. Patel, J. Nuwad, V. Sudarsan, S. N. Jha, D. Bhattacharyya, R. K. Vatsa and S. K. Kulshreshtha, Chem. Phys. Lett., 2013, 561–562, 82–86 CrossRef CAS.
- M. Walter, J. Somers, A. Fernandez, E. D. Specht, J. D. Hunn, P. Boulet, M. A. Denecke and C. Gobel, J. Mater. Sci., 2007, 42, 4650–4658 CrossRef CAS.
- D. C. Konigsberger and R. Prince, X-Ray Absorption: Principles, Applications, Techniques of EXAFS, SEXAFS and XANES, Wiley, New York, 1988 Search PubMed.
- M. Newville, B. Ravel, D. Haskel, J. J. Rehr, E. A. Stern and Y. Yacoby, Phys. B, 1995, 208–209, 154–156 CrossRef.
- E. H. Kisi and M. M. Elcombe, Acta Crystallogr., Sect. C: Cryst. Struct. Commun., 1989, 45, 1867–1870 CrossRef.
- S. Basu, D. Y. Inamdar, S. Mahamuni, A. Chakrabarti, C. Kamal, G. R. Kumar, S. N. Jha and D. Bhattacharyya, J. Phys. Chem. C, 2014, 118(17), 9154–9164 CAS.
- P. E. Lippens, A. V. Chadwick, A. Weibel, R. Bouchet and P. Knauth, J. Phys. Chem. C, 2008, 112, 43–47 CAS.
- J. B. Wang, G. J. Huang, X. L. Zhong, L. Z. Sun, Y. C. Zhou and E. H. Liu, Appl. Phys. Lett., 2006, 88, 252502 CrossRef.
- L. W. Yang, X. L. Wu, G. S. Huang, T. Qiu and Y. M. Yang, J. Appl. Phys., 2005, 97, 014308 CrossRef.
- D. G. Mead and G. R. Wilkinson, J. Raman Spectrosc., 1977, 6, 123–129 CrossRef CAS.
- S. Singh and M. S. Ramachandra Rao, Phys. Rev. B: Condens. Matter Mater. Phys., 2009, 80, 045210 CrossRef.
- J. M. Calleja and M. Cardona, Phys. Rev. B: Condens. Matter Mater. Phys., 1977, 16, 3753 CrossRef CAS.
- X. Wang, J. Xu, X. Yu, K. Xue, J. Yu and X. Zhao, Appl. Phys. Lett., 2007, 91, 031908 CrossRef.
- T. C. Damen, S. P. S. Porto and B. Tell, Phys. Rev., 1966, 142, 570–574 CrossRef CAS.
- J. Serrano, A. H. Romero, F. J. Manjo'n, R. Lauck, M. Cardona and A. Rubio, Phys. Rev. B: Condens. Matter Mater. Phys., 2004, 69, 094306 CrossRef.
- R. Cuscó, E. A. Lladó, J. Ibáñez, L. Artús, J. Jiménez, B. Wang and M. J. Callahan, Phys. Rev. B: Condens. Matter Mater. Phys., 2007, 75, 165202 CrossRef.
- S. Chen, Y. Liu, C. Shao, R. Mu, Y. Lu, J. Zhang, D. Shen and X. Fan, Adv. Mater., 2005, 17, 586–590 CrossRef CAS.
- Y. J. Xing, Z. H. Xi, Z. Q. Xue, X. D. Zhang, J. H. Song, R. M. Wang, J. Xu, Y. Song, S. L. Zhang and D. P. Yu, Appl. Phys. Lett., 2003, 83, 1689–1691 CrossRef CAS.
- J. D. Ye, S. L. Gu, S. M. Zhu, S. M. Liu, Y. D. Zheng, R. Zhang, Y. Shi, Q. Chen, H. Q. Yu and Y. D. Ye, Appl. Phys. Lett., 2006, 88, 101905 CrossRef.
- B. Martínez, F. Sandiumenge, Ll. Balcells, J. Arbiol, F. Sibieude and C. Monty, Phys. Rev. B: Condens. Matter Mater. Phys., 2003, 72, 165202 CrossRef.
- O. D. Jayakumar, H. G. Salunke, R. M. Kadam, M. Mahapatra, G. Yashwant and S. K. Kulshreshtha, Nanotechnology, 2006, 17, 1278–1285 CrossRef CAS.
- B. B. Straumal, A. A. Mazilkin, S. G. Protasova, A. A. Myatiev, P. B. Straumal, G. Schütz, P. A. V. Aken, E. Goering and B. Baretzky, Phys. Rev. B: Condens. Matter Mater. Phys., 2009, 79, 205206 CrossRef.
- A. Kaminski and S. D. Sarma, Phys. Rev. Lett., 2002, 88, 247202 CrossRef CAS PubMed.
- J. M. D. Coey, M. Venkatesan and C. B. Fitzgerald, Nat. Mater., 2005, 4, 173–179 CrossRef CAS PubMed.
- S. D. Sarma, E. H. Hwang and A. Kaminski, Phys. Rev. B: Condens. Matter Mater. Phys., 2003, 67, 155201 CrossRef.
- B. Pal and P. K. Giri, J. Appl. Phys., 2010, 108, 084322 CrossRef.
- N. F. Mott and E. A. Davis, Electronics Process in Non-Crystalline materials, Clarendon, Oxford, 1979 Search PubMed.
- N. Sharma, S. Granville, S. C. Kashyap and J.-P. Ansermet, Phys. Rev. B: Condens. Matter Mater. Phys., 2010, 82, 125211 CrossRef.
Footnote |
| † Electronic supplementary information (ESI) available. See DOI: 10.1039/c5ra12828e |
| This journal is © The Royal Society of Chemistry 2015 |


