Anti-microbial efficiency of nano silver–silica modified geopolymer mortar for eco-friendly green construction technology
Dibyendu Adaka,
Manas Sarkarb,
Moumita Maitib,
Abiral Tamangb,
Saroj Mandal*a and
Brajadulal Chattopadhyayb
aDepartment of Civil Engineering, Jadavpur University, Kolkata-700032, India. E-mail: mailtosarojmandal@rediffmail.com; smandal@civil.jdvu.ac.in; Tel: +91-9432236510
bDepartment of Physics, Jadavpur University, Kolkata-700032, India
First published on 21st July 2015
Abstract
A silver–silica nano composite based geopolymer mortar has been developed by simple adsorption of silver in a suitable amount of a colloidal silica suspension for anti-bacterial property development. The silver nanoparticles (3–7 nm) were attached on the surface of 20–50 nm sized silica nanoparticles. The silver–silica nano-composite was characterized by Transmission Electron Microscopy (TEM), X-Ray Diffraction (XRD) and energy dispersive X-ray spectral analysis. Mechanical strength, durability and mechanistic anti-bacterial activity of the silver–silica nano composite modified geopolymer mortar (GMAg–Si) were investigated and compared to nano silica modified geopolymer mortar (GMSi) and control cement mortar (CM). To accesses the anti-microbial efficacy of the samples, 99% mortality for Gram positive and Gram negative bacteria was calculated. Minimum Inhibitory Concentration (MIC) and Minimum Bactericidal Concentration (MBC) values were determined from batch cultures. The addition of 6% (w/w) of the silver–silica nano composite in the geopolymer mortar cured at ambient temperature shows substantial improvement in mechanical strength, durability and anti-bacterial property. Reactive Oxygen Species (ROS) generation and cell wall rupture as observed from fluorescence microscopy and Field Emission Scanning Electron Microscopy (FESEM) may be possible reasons behind the anti-bacterial efficacy of silver–silica nano composite modified geopolymer mortar.
1. Introduction
The sustainability of the cement and concrete industries is imperative to the wellbeing of our planet and human development. The production of Portland cement, an essential constituent of concrete, releases greenhouse gas emissions both directly and indirectly. It is well accepted that about one tone of carbon dioxide (CO2) is emitted into the atmosphere during the production of one tone of cement.1 Coal based thermal power stations produce a huge amount of fly ash which is annually estimated to be around 780 million tons throughout the world.2 The utilization of fly ash is about 35% in the construction of landfills, embankments, production blended cement etc. and remains as an industrial hazard. Alkali activated geopolymer concrete/mortar have been introduced to reduce the rapid utilization of Portland cement concrete throughout the world. In the last few decades the application of geopolymer concrete using mainly fly ash (without cement) has becomes an important area of research.3–6Geo-polymeric reaction generally depends on the activation with alkali solutions and temperature curing at 40–75 °C to obtain similar strength and durability to normal concrete.7–11 Thus the use of geopolymer concrete is limited to the precast member due to requirement of heat activation after casting. Several researchers have proposed to improve the strength development of fly ash based geopolymer cured at ambient temperature.12–14 Geopolymer mortar, with the addition of 6% nano silica shows appreciable improvement in mechanical strength and durability at 28 days under ambient temperature curing.15 However, it is necessary to explore the role of geopolymer composite different aspects like structural behavior and in the application of antimicrobial field.
Usually fresh concrete/mortar has a pH of 10 to 12 depending upon the mixture. Consequently with this high alkalinity it does not allow the growth of any microbes. However, this high pH is slowly reduced over the time due to presence of carbon dioxide (CO2) and hydrogen sulfide (H2S) in the atmosphere producing week acids (carbonic acid, thio-sulphuric acid etc.) in presence of water. When pH of the concrete/mortar is reduce to below 9.0, bacterial attack or deposition on concrete surface begins.16 The microbial colonies on the concrete surface, capillaries and micro/macro fissures cause concrete damage through bio-deterioration.17 Bio-deterioration of conventional concrete structure such as sewage pipes, maritime structures, bridges, tanks, pipelines and cooling towers occurs due to the presence of harmful bacteria.18,19 Various studies suggest that use of silver NPs in minimum concentration shows promising anti-bacterial property.20,21 With this background, use of silver–silica nano composite modified low calcium based fly-ash geopolymer mortar cured at ambient temperature, may be a favorable contender to Portland cement concrete. In this study, mechanical strength, durability and mechanistic anti-bacterial activity of fly ash based silver–silica nano composite modified geopolymer mortar (GMAg–Si) has been investigated and compared with silica modified geopolymer mortar (GMSi) and control cement mortar (CM).
2. Materials and method
2.1. Ingredients
Low calcium class F dry fly ash, locally available sand (specific gravity 2.52, water absorption 0.50%, and fineness modulus of 2.38), alkali activator fluid (mixture of sodium hydroxide, sodium silicate and deionized water) have been used as basic ingredients of geopolymer mortar.22,23 For control cement mortar, Ordinary Portland Cement (OPC) and deionized water has been used.Nutrient Broth (NB) media ingredients like peptone, beaf extract, yeast extract, NaCl, agar (Hi-media Pvt. Ltd, India), silver nitrate (Merck Germany), deionized water, carbonic acid, E. coli (MTCC 1652 strain), S. aureus (MTCC 96 strain) bacteria have been used. All reagents were prepared with milli-Q ultra-pure water. The basic properties of colloidal nano silica, as provided by the manufacturer, are mentioned in Table 1.
| Colloidal nano silica type | Average particle size (nm) | Solid content (wt%) | Viscosity (Pa S) | pH | Solid density (g cm−3) |
|---|---|---|---|---|---|
| CemSynXTX | 20 to 50 nm | 31% | 8.5 | 9.0–9.6 | 2.16 |
2.2. Preparation of silver silica nano composite
For preparation of silver nanoparticles (Ag NPs) on the surface of colloidal silica nanoparticles (SiO2 NPs), 100 mM colloidal silica NPs water solution was taken and the 5 mM silver nitrate (AgNO3) were added drop-wise under vigorous stirring at ambient temperature for 6 h.242.3. Confirmative test for silver–silica nano composite
The silver–silica nano solution was lyophilized (EYELA FDU-1200, Japan) and crushed to make a uniform fine powder. The surface morphology of the synthesized nano structured samples were evaluated using High Resolution Transmission Electron Microscopy (HRTEM; JEOL, JEM 2100). The surface charges and size distribution of silica NPs and silver–silica nano composite were determined by using Zeta Potential Analyzer (Brookhaven Instruments Corp. Holtsville, USA). XRD analysis was performed (Bruker AXS, Inc., Model D8, WI, USA) with mono-chromatised Cu-Kα radiation of wavelength 1.5406 Å at 55 kV and 40 mA. The sample was examined at 2θ from 10° to 80° and identified by referring to data of Joint Committee on Powder Diffraction Standards (JCPDS) files.2.4. Preparation of mortar mixtures (GMSi, GMAg–Si and CM)
Two different fly-ash based geopolymer mortars (GMSi, GMAg–Si) and a conventional control mortar (CM) were prepared for the present study. The activator fluid to fly ash ratio was taken at 0.40. The activator fluid was made by mixing 12 M NaOH with Na2SiO3 at weight ratio of 1![[thin space (1/6-em)]](https://www.rsc.org/images/entities/char_2009.gif) :
:![[thin space (1/6-em)]](https://www.rsc.org/images/entities/char_2009.gif) 1.75. This solution was mixed with colloidal nano silica solution (activator 1) for the preparation of GMSi geopolymer specimens. For preparation of GMAg–Si geopolymer mortar, activator 2 was prepared by 12 M NaOH and Na2SiO3 at same weight ratio with nano silver–silica solution. The amount of nano silica and silver–silica nano composite in the respective activator 1 and activator 2 solutions was 6% (w/w) of fly ash used. For the preparation of control mortar sample (CM), OPC of 43 grade sand and distilled water were used.25 Details of all mixes are shown in Table 2. For determination of mechanical strength (compressive strength, flexural and split tensile strength) and durability (RCPT), the samples of mix GMSi and GMAg–Si were removed from the mould after 24 h and kept in ambient temperature and tested after 3, 7 and 28 days of air curing. Conventional water curing was made for the CM specimens until the test.
1.75. This solution was mixed with colloidal nano silica solution (activator 1) for the preparation of GMSi geopolymer specimens. For preparation of GMAg–Si geopolymer mortar, activator 2 was prepared by 12 M NaOH and Na2SiO3 at same weight ratio with nano silver–silica solution. The amount of nano silica and silver–silica nano composite in the respective activator 1 and activator 2 solutions was 6% (w/w) of fly ash used. For the preparation of control mortar sample (CM), OPC of 43 grade sand and distilled water were used.25 Details of all mixes are shown in Table 2. For determination of mechanical strength (compressive strength, flexural and split tensile strength) and durability (RCPT), the samples of mix GMSi and GMAg–Si were removed from the mould after 24 h and kept in ambient temperature and tested after 3, 7 and 28 days of air curing. Conventional water curing was made for the CM specimens until the test.
| Sample mark | Fly ash sand | Activator solutions | % of SiO2 NPs | % of Ag–SiO2 NPs | Curing condition |
|---|---|---|---|---|---|
| a Activator-1 – NaOH + Na2SiO3 + nano silica.b Activator-2 – NaOH + Na2SiO3 + nano silver–silica. | |||||
| GMSi | 1![[thin space (1/6-em)]](https://www.rsc.org/images/entities/char_2009.gif) : :![[thin space (1/6-em)]](https://www.rsc.org/images/entities/char_2009.gif) 3 3 |
Activator-1 | 6.0 | Nil | Air curing at room temp. |
| GMAg–Si | 1![[thin space (1/6-em)]](https://www.rsc.org/images/entities/char_2009.gif) : :![[thin space (1/6-em)]](https://www.rsc.org/images/entities/char_2009.gif) 3 3 |
Activator-2 | Nil | 6.0 | Air curing at room temp. |
CM (cement![[thin space (1/6-em)]](https://www.rsc.org/images/entities/char_2009.gif) : :![[thin space (1/6-em)]](https://www.rsc.org/images/entities/char_2009.gif) sand) sand) |
1![[thin space (1/6-em)]](https://www.rsc.org/images/entities/char_2009.gif) : :![[thin space (1/6-em)]](https://www.rsc.org/images/entities/char_2009.gif) 3 3 |
Water | Nil | Nil | Water curing |
2.5. Sample preparation and testing of mechanical strength
The standard mortar cube specimens of dimension 70.6 mm × 70.6 mm × 70.6 mm were prepared for different mixes to determine the compressive strength of mortars. All the specimens were tested at 3 days, 7 days, and 28 days after casting to determine the compressive strength. Flexural strength testing was carried out on mortar bars (50 mm × 50 mm × 200 mm) for all (GMSi, GMAg–Si, CM) samples. The center point loading method was adopted for the determination of flexural strength (ASTM C293).26 Cylinder specimens (100 mm diameter × 200 mm height) were tested for split tensile strength test for each category after 28 days from the date of casting.2.6. Durability test
Rapid Chloride ion Penetration Test (RCPT) was adopted for the durability assessment of different mortar mixes. Test cylinder specimens (100 mm diameter × 200 mm height) were sliced into core specimens of thickness 50 mm and subjected to RCPT by impressing 60 V.27 All the specimens were tested after 28 days of casting.2.7. Anti-bacterial study
Mortar samples (GMSi and GMAg–Si & CM) were immersed in 0.5 N carbonic acid solutions until the pH value of all samples become less than 9.0. After getting the pH < 9.0, the samples were crushed by hand mortar and sieved in uniform sized powder for the anti-bacterial study purpose.Minimum bactericidal concentration (MBC) is defined as the lowest concentration of silver nanoparticles present in GMAg–Si samples that kills 99.9% of the bacteria. The presences of viable microorganisms were examined and lowest concentrations causing bactericidal effect were reported as MBC for the growth inhibitory concentrations.31 The experiment was performed by plating (nutrient agar plate 15%) the bacterial cultures with upper amounts above the MIC. The agar plates were inoculated at 37 °C for 24 h. All the experiments were carried out in triplicate.
![[thin space (1/6-em)]](https://www.rsc.org/images/entities/char_2009.gif) :
:![[thin space (1/6-em)]](https://www.rsc.org/images/entities/char_2009.gif) 100 v/v) and PI water solution (1 mg ml−1) were taken in to 1 ml of each treated GMSi & GMAg–Si and CM samples. After incubation at 37 °C for 30 min, each sample was mounted immediately over slides and pictures were captured by the fluorescence microscope for this experiment.34
100 v/v) and PI water solution (1 mg ml−1) were taken in to 1 ml of each treated GMSi & GMAg–Si and CM samples. After incubation at 37 °C for 30 min, each sample was mounted immediately over slides and pictures were captured by the fluorescence microscope for this experiment.343. Results
3.1. Characterization of nano silver–silica composite
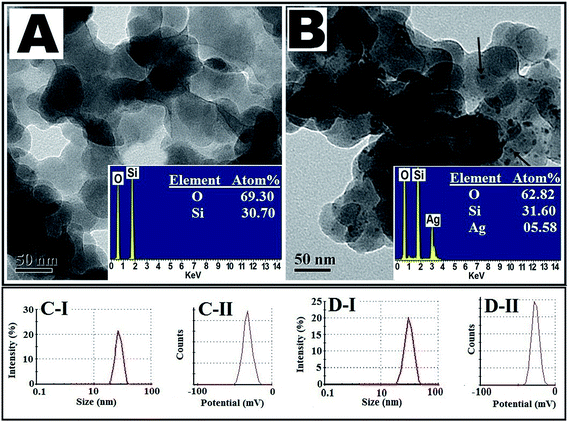
Transmission electron microscopy analysis of silica NPs and silver–silica nano composite shows their very regular spherical shape (Fig. 1A and B). Fig. 1B shows the silver NPs (mean ± SD: 4 ± 1 nm) are formed on the surface of silica NPs (30 ± 10 nm). Elemental analysis of newly synthesized silica NPs and silver–silica nano composites are shown in Fig. 1A and B (inset). The presence of the elements O and Si were observed at 0.562 keV (O), 1.75 keV (Si) respectively. The Si, O and Ag peaks are clearly shown in Fig. 1B (inset), which indicates that the presence of silver nano particles on to the silica surface. It was confirmed from TEM images that nano-particles are pure in colloidal form but the particles are of hybrid-type in silver–silica nano composites. Also the average size of the silica NPs 20–40 nm was analyzed by using zeta size distribution graph (Fig. 1C-I). The silver NPs (4 ± 1 nm) were attached on the surface of silica NPs which was showed in Fig. 1D-I. Also in Fig. 1D-I, comparatively broad peak is revealed that the greater size distribution of silver–silica nano composite, which is also much correlated with TEM result (Fig. 1B). The overall surface charge of the pure silica NPs (Fig. 1C-II) was negative (−50 mV) whereas silver silica nano-composite (Fig. 1D-II) showed some greater positive charges (>−50 mV) which was confirmed by zeta potential analysis.The X-ray diffraction profiles of newly synthesized silica NPs and silver–silica nano-composite were matched up with JCPDs data file (Fig. 2A). The XRD pattern of silver–silica NPs showed the presence of sharp peaks which are absent in silica NPs. The sharp peaks indicate that the newly synthesized nano particles are either very small crystallite size or semi-crystalline in nature. The average crystallite size of silver nano particles were estimated by Scherrer's equation for the (122), (220), and (222) diffraction peaks at 2θ = 38.118, 45.593, 57.937 and 71.101 respectively. Therefore, it is clearly confirmed that silver–silica nano composite particles were successfully synthesized.
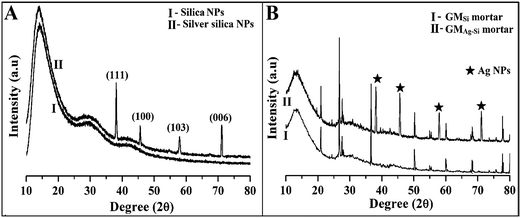 | ||
| Fig. 2 (A) XRD spectra of (I) SiO2 NPs & (II) Ag–SiO2 NPs. (B) XRD spectra of (I) GMSi and (II) GMAg–Si. | ||
3.2. Presence of silver NPs in GMAg–Si mortar
The XRD spectra of nano silica modified geopolymer mortar (GMSi) and nano silver–silica nano composite modified geopolymer (GMAg–Si) mortar were represented in Fig. 2B. In case of geopolymer mortar with nano silver–silica composite, some additional peak positions were observed at same specific positions (2θ) that confirmed the presence of silver nano particles in GMAg–Si mortar.3.3. Strength and durability of different mortars
Fig. 3A represents the compressive strength of fly ash based nano silica modified geopolymer (GMSi) mortar and nano silver–silica modified geopolymer mortar (GMAg–Si) samples cured at ambient temperature. The strength of control sample made from OPC cement was also compared. It was observed that both the geopolymer mortar samples (GMSi and GMAg–Si) show better compressive strength than CM samples at all ages. However, addition of silica NPs and silver–silica nano composite (6% of fly ash by weight) in geopolymer mortar seems to provide similar compressive strength cured at ambient temperature. It is noted that the presence of silver NPs attached on the surface of silica NPs do not affect the strength of modified geopolymer mortar.15 Similar behavior was also observed on flexural strength and split tensile strength of geopolymer mortars and control mortar samples (Fig. 3B). A comparison of RCPT value for GMSi, GMAg–Si and CM samples were presented in Fig. 3C. It is observed that less amount of ions passed through geopolymer (GMAg–Si and GMSi) matrices than CM matrices. This indicates that the diffusion coefficient will be less due to presence of crystalline compound in GMSi and GMAg–Si modified geopolymer mortars thereby improving the durability.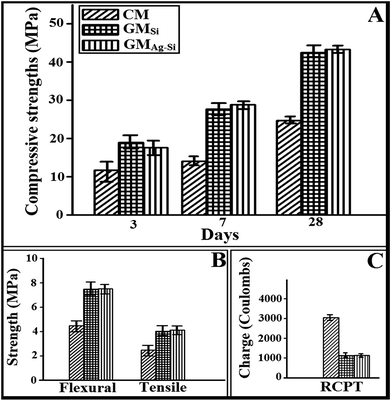 | ||
| Fig. 3 (A) Compressive strengths, (B) flexural & tensile strengths, (C) RCPT of different mortar samples (CM, GMSi & GMAg–Si). | ||
3.4. Anti-bacterial study
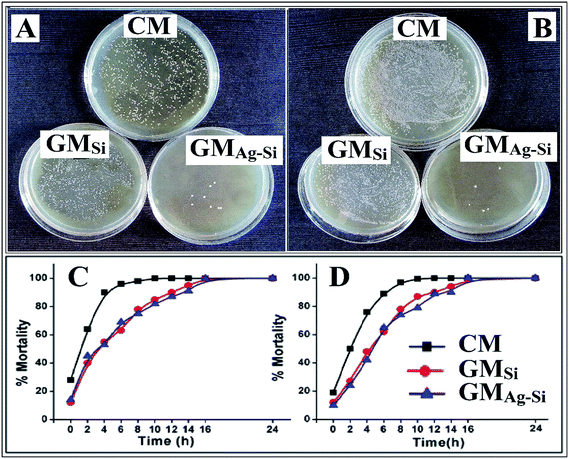
The bactericidal kinetics of exponentially growing Gram negative E. coli and Gram positive S. aureus bacteria were observed against GMSi, GMAg–Si, and CM samples by time killing assay. The result revealed that the populations of E. coli and S. aureus bacteria were reduced by 99% after 8 h and 6 h (Fig. 4C and D) for GMAg–Si respectively. The anti-bacterial effect was shown by plate culture of bacteria after 8 h treatment (Fig. 4A and B). A large number of colonies were found in GMSi and control specimens whereas none was seen in case of GMAg–Si sample.The MIC and MBC values of GMAg–Si sample against Gram +ve and Gram −ve microorganisms are represented in Tables 3 and 4. Table 3 indicates that considerably low amount of GMAg–Si (0.15 mg ml−1) was able to eradicate the Gram (−ve) bacterial cells (>99%). Gram −ve organisms were more resistant to the growth inhibiting effect of the sample (0.10 mg ml−1) compared to Gram +ve bacterial cell. The anti-bacterial activities of GMAg–Si geopolymer mortar samples are significantly higher than the other specimens (GMSi & control sample). The MBC for silver–silica nano composite treated cells are not more than 4 times their respective MIC values indicating that the nano composites are bactericidal rather than bacteriostatic. The MBC value (Table 4) indicates that considerably lower amount of silver (0.43 μg ml−1) was able to eradicate the Gram positive bacterial (S. aureus) cells. The Gram negative organisms (E. coli) were more resistant to the growth inhibiting effect of silver NPs (0.32 μg ml−1).
| Bacteria | Control (mg ml−1) | GMSi (mg ml−1) | GMAg–Si (mg ml−1) |
|---|---|---|---|
| E. coli | — | — | 0.10 |
| S. aureus | — | — | 0.15 |
| Bacteria | Control (mg ml−1) | GMSi (mg ml−1) | GMAg–Si (mg ml−1) |
|---|---|---|---|
| E. coli | — | — | 0.32 |
| S. aureus | — | — | 0.43 |
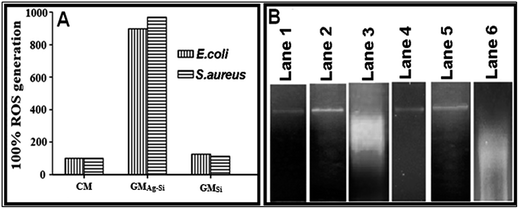
The ROS level of the cells (E. coli & S. aureus) treated with GMSi and GMAg–Si were compared to CM treated cells. The level of ROS for the CM treated cells was considered as 100%. For GMAg–Si treated cells the intensity was about 5 times higher with respect to the control for both E. coli and S. aureus (Fig. 5A). As observed, the oxidative stress in the GMAg–Si treated cells was much higher as compared to the CM and GMSi treated micro-organisms.
The purified bacterial genomic DNA of E. coli and S. aureus are shown (Fig. 5B) in gel electrophoresis (lane-1 and lane-4) whereas the GMSi treated DNA was observed in lane-2 and lane-5. The GMAg–Si treated DNA was fragmented in lane-3, lane-6.
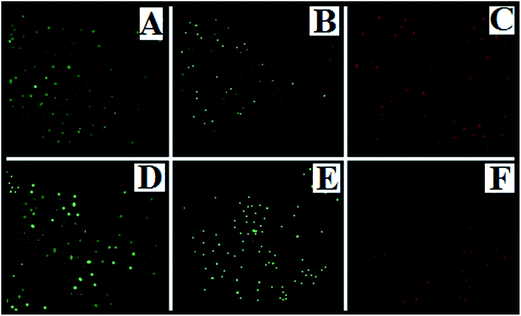
The SYBR Green is a bacterial cell membrane permeant dye which stains both live and dead cells. The fluorescence microscopic images show that control cells and GMSi treated cells (E. coli and S. aureus) are intensely stained with SYBR Green whereas GMAg–Si treated cells are found to be PI positive (Fig. 6). The PI is an impermeant dye that stains only dead and membrane compromised cells due to loss of the plasma membrane integrity. The result of morphological analysis of GMAg–Si treated cells represents extensive membrane destruction and disruption of cells after 8 h of incubation (Fig. 7C) in respect to control and GMSi treated E. coli cells (Fig. 7A and B) respectively. Control and GMSi treated cells shows distinct spherical morphology of coccus shaped S. aureus (Fig. 7D and E respectively), whereas membrane deformation and pore formation can be seen along with cell debris in case of GMAg–Si treated cells (Fig. 7F).
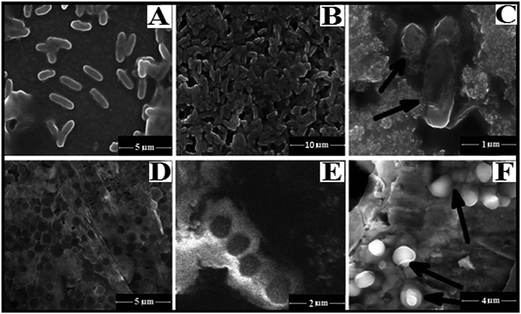 | ||
| Fig. 7 FESEM images of (A) CM treated E. coli, (B) GMSi treated E. coli, (C) GMAg–Si treated E. coli, (D) CM treated S. aureus, (E) GMSi treated S. aureus and (F) GMAg–Si treated S. aureus. | ||
4. Discussion
In this present study, the silver NPs (2–5 nm) has been attached on the surface of silica NPs of 30–50 nm (Fig. 1B) to develop the antimicrobial activity of the geopolymer mortar. In presence of positively charged silver NPs on the surface of the negatively charged silica NPs, the overall charges of silver–silica nanocomposite (Fig. 1C-II) is reduced. The incorporation of this newly formed silver NPs in the low calcium fly-ash based geopolymer mortar has improved its anti-bacterial property. However, the strength and durability do not affected due to the presence of such silver NPs in geopolymer mortar cured at ambient temperature. The strength and durability of geopolymer mortar (GMAg–Si) is not affected by the presence of silver NPs (Fig. 3). The silver has the potential to kill bacteria in minimum time period.29,35 The different bacterial cell wall disruptions (Fig. 7) indicate that the anti-bacterial property has been developed in desired geopolymer mortar. Silver–silica nano composite having 6% by weight of fly ash in geopolymer mortar was sufficient to resist the bacterial growth. The growth for both types of bacteria (Gram −ve/Gram +ve) was stopped within 6–8 h only in presence of silver NPs modified GMAg–Si geopolymer mortar. Bacterial growth population in general depends on numerous external factors like pH, temperature, concentration of nano-particles.36,37 In various studies, it is reported that due to the high alkali property of fresh concrete/mortar at early age, it will not allow any bacterial growth. However, the pH of concrete/mortar is slowly reduced over time by the effect of carbon dioxide and hydrogen sulfide gas and growth of bacteria starts.Silver silica nano composite modified geopolymer mortar shows better resistance to bacterial attack than nano silica modified geopolymer and control samples. Silver nano particles incapacitate enzymes through binding of sulfhydryl (thiol) groups in amino acids of bacterial cell and promote the release of ions/NPs with subsequent hydroxyl radical formation.38,39 Gram-negative bacteria possess an outer membrane outside the peptidoglycan layer which is absent in Gram-positive organisms.40 The outer membrane protects bacteria from harmful agents, such as detergents, drugs, toxins and degradative enzymes by functioning as selective permeability barrier. The cell wall disruption by the lower amount of silver NPs in geopolymer particle (∼MIC) may be the main reason of bactericidal kinetics. Farther, the unfavorable intracellular ROS generation also facilitates to destroy these bacteria by biological targeting of DNA, RNA, proteins and lipids. Initiation of lipid peroxidation via damage of membrane poly unsaturated fatty acids was caused by free radical generation.
The effect of silver NPs on bacteria is observed by the structural and morphological changes (Fig. 7). It is suggested that in undisturbed state, the replication of DNA can be effectively conducted and loses its replication ability in that form. The DNA molecule turns into condensed form and loses its replication ability when the presence of silver ions/NPs within the bacterial cell, leading to cell death.41 The DNA damage images (Fig. 5B) are also correlated with the previously reported discussion.
The influence of lipid peroxidation process shrinks the membrane fluidity through alteration membrane properties and can disrupt membrane-bound proteins significantly.42 In contact of silver NPs, DNA was completely destroyed and fragmented (Fig. 5B). The activity of the silver NPs was extremely detrimental for DNA molecules by breaking its double helical structure. DNA loses its replication ability and cellular proteins become inactivated on silver NPs treatment.41
5. Conclusion
It may be concluded that low calcium fly ash based silica modified geopolymer mortar cured at room temperature shows almost similar strength and durability but better anti-bacterial property. Silver–silica modified geopolymer mortar demonstrates better anti-bacterial property than conventional cement mortar and silica modified geopolymer mortar. Due to positive charge, silver NPs in the liquid growth medium are attracted electrostatically to the negatively charged cell wall of bacteria. A few oxidized silver ions/NPs also get attached electrostatically to the bacterial membrane and thus decreases the osmotic stability of the cell, trailed by consequent leakage of intracellular constituents. The anti-bacterial activity of GMAg–Si was developed by introducing silver NPs on the surface of silica NPs which is the main ingredients for anti-bacterial activity of geopolymer mortar. It is an ecofriendly, non-hazard, cost effective and more durable building materials which can show the new hope for better green construction technology.Reference
- P. K. Mehta, Concr. Int., 2001, 23(10), 61–66 Search PubMed
.
- C. Heidrich, F. H. Joachim and W. Anne, World of Coal Ash (WOCA) Conference, Lexington, 2013 Search PubMed.
- J. Davidovits, J. Therm. Anal., 1991, 37, 1633–1656 CrossRef CAS
.
- D. Hardjito, S. E. Wallah, V. Rangan and B. V. Rangan, Aust. J. Struct. Eng., 2005, 6, 1–9 Search PubMed
.
- J. A. Fernandez, M. Monzo, M. V. Cabedo, A. Barba and A. Palamo, Microporous Mesoporous Mater., 2008, 108, 41–49 CrossRef PubMed
.
- Z. Xie and Y. Xi, Cem. Concr. Res., 2001, 31, 1245–1249 CrossRef CAS
.
- P. Chindaprasirt, T. Chareerat and V. Sirivivatnanon, Cem. Concr. Compos., 2007, 29, 224–229 CrossRef CAS PubMed
.
- S. Pangdaeng, T. Phoo-ngernkham, V. Sata and P. Chindaprasirt, Mater. Des., 2014, 53, 269–274 CrossRef CAS PubMed
.
- M. S. Villarreal, A. M. Ramíreza, S. S. Bulbarelaa, J. R. Gasca-Tirado, J. L. Reyes-Araiza and J. C. Rubio-Avalos, Mater. Lett., 2011, 65, 995–998 CrossRef PubMed
.
- G. Gorhan and G. Kurklu, Composites, Part B, 2014, 58, 371–377 CrossRef CAS PubMed
.
- F. F. V. Barbosa, J. D. K. Mackenzie and C. Thaumaturgo, Int. J. Inorg. Mater., 2000, 309–317 CrossRef
.
- J. Temuujin, R. P. Williams and A. van Riessen, J. Mater. Process. Technol., 2009, 209, 5276–5280 CrossRef CAS PubMed
.
- P. S. Deb, P. Nath and P. K. Sarkar, Adv. Mater. Res., 2013, 05, 168–173 Search PubMed
.
- H. M. Giasuddin, G. Sanjayan and P. G. Ranjith, Fuel, 2013, 07, 34–39 CrossRef PubMed
.
- D. Adak, M. Sarkar and S. Mandal, Construct. Build. Mater., 2014, 70, 453–459 CrossRef PubMed
.
- Con Shield: Technical presentation, Florida, Orlando, 1998.
- H. Viitanen, J. Vinha and K. Salminen, J. Build. Phys., 2010, 33, 201–224 CrossRef PubMed
.
- A. K. Parande, P. L. Ramsamy, S. Ethirajan, C. R. K. Rao and N. Palanisamy, Proc. Inst. Civ. Eng. Municip. Eng., 2006, 159, 11–20 Search PubMed
.
- M. Sanchez-Silva and D. Rosowsky, J. Mater. Civ. Eng., 2008, 20, 352–365 CrossRef CAS
.
- A. Panáček, L. Kvítek, R. Prucek, M. Kolář, R. Večeřová, N. Pizúrová, V. K. Sharma, T. Nevěčná and R. Zbořil, J. Phys. Chem. B, 2006, 110, 16248–16253 CrossRef PubMed
.
- J. R. Morones, J. L. Elechiguerra, A. Camacho, K. Holt, J. B. Kouri, J. T. Ramírez and M. J. Yacaman, Nanotechnology, 2005, 16, 2346–2353 CrossRef CAS PubMed
.
- ASTM C618–12a, Standard Specification for Coal Fly Ash and Raw or Calcined Natural Pozzolan for Use in Concrete, ASTM International, West Conshohocken, PA, 2012 Search PubMed
.
- D. Adak and S. Mandal, Indian Concr. J., 2015, 89, 31–40 Search PubMed
.
- V. Pol, D. N. Srivastava, O. Palchik, V. Palchik, M. A. Slifkin and A. M. Weiss, Langmuir, 2002, 18, 3352–3357 CrossRef CAS
.
- M. Sarkar, T. Chowdhury, B. Chattopadhyay, R. Gachhui and S. Mandal, J. Mater. Sci., 2014, 49, 4461–4468 CrossRef CAS
.
- ASTM C293–10, Standard Test Method for Flexural Strength of Concrete (Using Simple Beam with Center-Point Loading), ASTM International, West Conshohocken, PA, 2010 Search PubMed
.
- ASTM C1202–12, Standard Test Method for Electrical Indication of Concrete's Ability to Resist Chloride Ion Penetration, ASTM International, West Conshohocken, PA, 2012 Search PubMed
.
- L. Qi, Z. Xu, X. Jiang, C. Hu and X. Zou, Carbohydr. Res., 2004, 339, 2693–2700 CrossRef CAS PubMed
.
- J. Ruparelia, A. Chatterjee, S. P. Duttagupta and S. Mukherji, Acta Biomater., 2008, 4, 707–716 CrossRef CAS PubMed
.
- G. Ren, D. Hu, C. Cheng, M. A. Vargas-Reus, P. Reip and R. P. Allaker, Int. J. Antimicrob. Agents, 2009, 33, 587–590 CrossRef CAS PubMed
.
- M. R. Avadia, A. M. M. Sadeghib, A. Tahzibic, Kh. Bayati, M. Pouladzadeh, Z. Mehr and M. R. Thehrani, Eur. Polym. J., 2004, 40, 1355–1361 CrossRef PubMed
.
- H. L. Su, C. C. Chou, D. J. Hung, S. H. Lin, I. C. Pao, J. H. Lin, F. L. Huang, R. X. Dong and J. J. Lin, Biomaterials, 2009, 30, 5979–5987 CrossRef CAS PubMed
.
- S. A. Shoichet, A. T. Bäumer, D. Stamenkovic, H. Sauer, A. F. Pfeiffer, C. R. Kahn, D. M. Wieland, C. Richter and M. Ristow, Hum. Mol. Genet., 2002, 11, 815–821 CrossRef CAS PubMed
.
- S. Barbesti, S. Citterio, M. Labra, M. D. Baroni, M. G. Neri and S. Sgorbati, Cytometry, 2000, 40, 214–218 CrossRef CAS
.
- S. Agnihotri, S. Mukherji and S. Mukherji, RSC Adv., 2014, 4, 3974–3983 RSC
.
- J. S. Kim, E. Kuk and K. N. Yu, Nanomedicine, 2007, 3, 95–101 CrossRef CAS PubMed
.
- F. Rispoli, A. Angelov, D. Badia, A. Kumar, S. Seal and V. Shah, J. Hazard. Mater., 2010, 180, 212–216 CrossRef CAS PubMed
.
- M. R. Yeaman and N. Y. Yount, Pharmacol. Rev., 2003, 55, 27–55 CrossRef CAS PubMed
.
- N. A. Amro, L. P. Kotra, K. W. Mesthrige, A. Bulychev, S. Mobashery and G. Liu, Langmuir, 2000, 16, 2789–2796 CrossRef CAS
.
- H. Nikaido, Microbiol. Mol. Biol. Rev., 2003, 67, 593–656 CrossRef CAS
.
- Q. L. Feng, J. Wu, G. Q. Chen, F. Z. Cui, T. N. Kim and J. O. Kim, J. Biomed. Mater. Res., 2000, 52, 662–668 CrossRef CAS
.
- E. Cabiscol, J. Tamarit and J. Ros, Int. Microbiol., 2000, 3(l), 3–8 CAS
.
| This journal is © The Royal Society of Chemistry 2015 |

