DOI:
10.1039/C5RA12621E
(Paper)
RSC Adv., 2015,
5, 72423-72432
Preparation of copper doped magnetic porous carbon for removal of methylene blue by a heterogeneous Fenton-like reaction†
Received
30th June 2015
, Accepted 17th August 2015
First published on 17th August 2015
Abstract
High-specific-surface-area copper doped magnetic porous carbon (CuFe2O4/Cu@C) was fabricated by annealing iron, copper and 1,3,5-benzenetricarboxylic ([Cu/Fe]-BTC) metal–organic coordination polymers, which were prepared via a one-pot solvothermal method. The novel CuFe2O4/Cu@C catalyst consists of Cu (3.80%), CuFe2O4 (64.84%), and C (31.36%). Scanning electron microscopy, X-ray diffraction, X-ray photoelectron spectroscopy, elemental analysis, inductively coupled plasma, Brunauer–Emmett–Teller surface area measurement, and vibrating sample magnetometer analysis were used to characterize the materials. The as-prepared materials were employed as a heterogeneous Fenton’s reagent with the addition of H2O2 for degradation of methylene blue (MB). The results showed that the materials effectively catalyzed H2O2 to generate hydroxyl radicals (˙OH). And due to their magnetism, the materials can be easily separated from wastewater to achieve repeatability. It also turned out that CuFe2O4/Cu@C had a higher catalytic activity than Fe3O4@C, which proved the importance of copper doped into the catalyst. This work indicated that porous carbon composites provide good support for the development of a highly efficient heterogeneous Fenton catalyst, which is useful for environmental pollution cleanup.
1. Introduction
Treatment and control of organic pollutants have become priority tasks in the drinking water industry. However, the removal of the most organic pollutants from drinking water is a difficult task, because their odor threshold is extremely low. Only a few water treatment technologies have been successfully applied to remove organic pollutants from water, including the use of physical methods,1,2 biotechnology,3 and chemical technology.4 However, physical methods, such as liquid–liquid extraction, ion-exchange, adsorption, and air or steam stripping, are ineffective on pollutants that are not readily adsorbed or volatile; these approaches have disadvantages because they simply transfer the pollutants to another phase rather than destroying them.5 The adsorption process of activated carbon to remove organic pollutants is a recognized practice; however, the treatment may be costly.6 Ozone and hypochlorite oxidations are efficient decolorizing methods, but they are undesirable because of the high cost of equipment, operating costs, and secondary pollution.7
Recently, chemical treatment methods based on the generation of hydroxyl radicals, known as advanced oxidation processes (AOPs), have been recently applied for pollutant degradation because of the high oxidative power of the OH radical. These techniques generate a free hydroxyl radical (˙OH) that degrades most of the organic pollutants rapidly and non-selectively. The Fenton reaction is a well-studied AOP that uses hydrogen peroxide as an oxidant in the presence of a catalyst.8–10 The nonselective attack of organic compounds by the hydroxyl radicals results in mineral end-products. The classical Fenton reagent consists of a homogeneous solution of iron ions and hydrogen peroxide. Catalysis is effective only within a low and narrow pH range. This process also produces iron sludge as a treatment byproduct, which is an additional environmental contaminant. Therefore, heterogeneous catalysts have been developed to overcome these problems.11–14 The Fe2+ ion in Fe3O4 makes this compound a very efficient catalyst for the degradation of organic pollutants and allows it to be easily separated from the reaction medium using an external magnetic field. Therefore, magnetite is suitable as a heterogeneous Fenton catalyst. However, the aggregation of Fe3O4 nanoparticles, which is the major challenge in using catalytic nanoparticles in practical application, substantially reduces catalytic efficiency.15 Hence, significant efforts have been made to overcome these disadvantages.10,16,17 Iron oxides can be immobilized in organic or inorganic supports to form the novel heterogeneous Fenton catalysts. Among the porous solids used as supports for iron phases, carbon materials, such as graphene18 and activated carbon,19 gained popularity because of their excellent chemical stability, mechanical strength, and large surface area. Porous carbon possesses high specific surface area that can improve the activity of iron oxide by preventing the aggregation and improving the dispersibility of the catalyst.
Metal–organic frameworks (MOFs) are crystalline materials composed of metal ions and organic ligands. The pore size and functional groups of MOFs can be adjusted given the variety of metal ions and organic ligands.20 These distinct characteristics make MOFs excellent candidates for various applications, such as gas storage,21,22 chemical separation,23 drug delivery,24 and catalysis.25 In recent years, the utilization of MOFs as heterogeneous catalysts has received significant attention. However, the application of MOFs in special environments, such as acidic, alkali, and high-temperature environments, is limited because of their low stability. Moreover, the recycling of MOFs is a complicated task after the reaction. The utilization of MOFs as templates or precursor materials to produce porous carbonaceous materials has been demonstrated because MOFs have a large surface area and possess a significant amount of carbon.26,27
In this work, we present a facile method to synthesize CuFe2O4/Cu@C composite materials derived from iron, copper, and 1,3,5-benzenetricarboxylic ([Cu/Fe]-BTC) metal–organic coordination polymers prepared by using a one-pot solvothermal method. Scanning electron microscopy (SEM), X-ray diffraction (XRD), Fourier transform infrared (FT-IR) spectroscopy, X-ray photoelectron spectroscopy (XPS) spectra, vibrating sample magnetometry (VSM), inductively coupled plasma atomic emission spectroscopy (ICP-AES), and Brunauer–Emmett–Teller (BET) analyses were used to characterize the magnetic porous composite material. The ability of the particles to facilitate the Fenton oxidation of methylene blue (MB) was tested under varying conditions of initial pH, H2O2 concentration, NH2OH, catalyst dosage concentration, MB concentration, and temperature. The stability and reusability of the magnetic porous carbon spheres were also tested. Moreover, the catalytic activity of CuFe2O4/Cu@C and Fe3O4@C were compared.
2. Experimental
2.1 Materials
Cu(NO3)2 and FeCl3 were purchased from Sinopharm Chemical Reagent Co. (Shanghai, China). Benzene-1,3,5-tricarboxylicacid (H3BTC) and hydroxylamine hydrochloride (HONH3Cl) were purchased from Aldrich. Sodium hydroxide and hydrogen peroxide were purchased from Shanghai Chemical Reagents Company. MB was supplied by Tianjin Tiantai Fine Chemicals Co., Ltd. All the chemicals were of analytical grade.
2.2 Synthesis of CuFe2O4/Cu@C composite
CuFe2O4/Cu@C composites were prepared by a solvothermal method under autogenous pressure. In a typical experiment, 0.3244 g FeCl3 (2 mmol), 0.3624 g Cu(NO3)2 (1.5 mmol) and 0.6305 g H3BTC (3 mmol) were firstly dissolved in 20 mL ethanol under vigorous stirring for 30 min. Then the mixture was sealed in a 60 mL Teflon-lined stainless-steel autoclave and heated at 78 °C for 8 h. After that, the autoclave was carefully removed and allowed to cool to room temperature. The as-synthesized polymer was washed with ethanol several times and centrifuged and then dried at 60 °C in vacuum for 12 h. The dried polymer powder was obtained. Finally, the resulting powder was annealed at 500 °C in nitrogen atmosphere for 3 h. After cooling to room temperature, the as-prepared CuFe2O4/Cu@C composite were collected for use as follows.
2.3 Synthesis of Fe3O4@C composite
For comparison, Fe3O4@C composites were also prepared by a solvothermal method. In a typical experiment, 1.6220 g FeCl3 and 1.4010 g H3BTC were dissolved in 30 mL ethanol under vigorous stirring for 30 min. The following process was just the same as the synthesis of the CuFe2O4/Cu@C composite.
2.4 Dye decoloration through a heterogeneous Fenton reaction
The catalytic property of CuFe2O4/Cu@C materials were explored by studying the change of the absorbance intensity at the maximum absorbance wavelength of the MB dye. Typically, 5 mg resulting catalysts were added to 10 mL of a 20 mg L−1 MB solution in the presence of H2O2 and NH2OH, and the suspension was shaken in a thermostated shaker at 130 rpm at 30 °C. After the reaction, the composites were separated using an external magnetic field, then the concentration of MB was determined using a UV-Vis spectrometer, with a maximum absorbance wavelength for MB at 664 nm. Total organic carbon (TOC) was determined by a TOC analyzer after filtration through a 0.45 μm membrane filter.
2.5 Characterization
The morphology of the sample was examined by scanning electron microscope (SEM, JSM-6701F, JEOL, Japan). FT-IR spectras were obtained in transmission mode on a FT-IR spectrometer (American Nicolet Corp., Model 170-SX) using the KBr pellet technique. XRD (Rigaku D/MAX-2400 X-ray diffractometer with Ni-filtered Cu Kα radiation (λ = 1.54056)) was used to investigate the crystal structure of the nanoparticles. The Fe and Cu content of the prepared nanocatalysts were obtained by inductively coupled plasma atomic emission spectroscopy (ICP-AES). Magnetization measurements at room temperature were obtained using a vibrating sample magnetometer (LAKESHORE-7304, USA) at room temperature. The X-ray photoelectron spectroscopy (XPS) spectra were obtained with an ESCALab220i-XL electron spectrometer (VG Scientific) using 300 W Al-Kα radiation. The N2 adsorption–desorption isotherm was measured at liquid nitrogen temperature (77 K) using a Micromeritics ASAP 2020 analyzer. The specific surface area was calculated by the BET method. The pore size distribution was obtained using the Barret–Joyner–Halenda (BJH) method. UV-Vis detection was carried out on a TU-1810PC UV-Vis spectrophotometer (Purkinje General, China). TOC was determined using a TOC analyzer (Elementar vario TOC cube, Hanau, Germany).
3. Results and discussion
3.1 Morphology and structure characterization
A solvothermal method was used to prepare CuFe2O4/Cu@C and Fe3O4@C composite materials under autogenous pressure. Fig. 1 shows representative SEM images of CuFe2O4/Cu@C and Fe3O4@C composites. The SEM image (Fig. 1a) shows that the Fe3O4@C composite is in an amorphous state and the Fe3O4 crystal disperses well in the substrate (Fig. 1b and c). Based on Fig. 1d–f, the CuFe2O4/Cu@C composites have the same amorphous states.
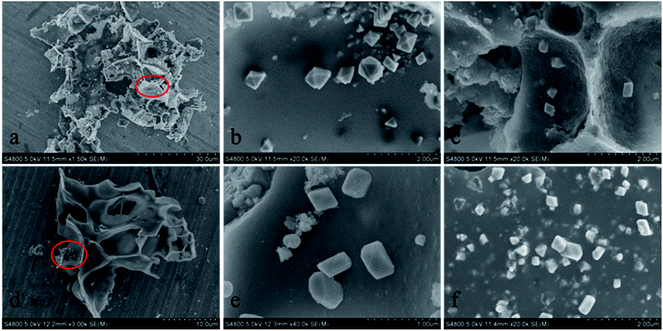 |
| | Fig. 1 SEM images of Fe3O4@C (a–c) and CuFe2O4/Cu@C (d–f). | |
PXRD analysis also provided information on the composition of the as-synthesized samples. To verify the formation of CuFe2O4/Cu@C and Fe3O4@C composites, we obtained XRD patterns of [Cu/Fe]-BTC and Fe-BTC samples, as shown in Fig. 2. The position of the two groups of diffraction peaks is consistent with the standard XRD data for the MIL-100 (Fe) in Fig. 2a and b. The results are also consistent with other findings in the literature.28,29 The finding demonstrates the formation of [Cu/Fe]-BTC and Fe-BTC composites. After the carbonization process, some diffraction peaks disappeared. As shown in Fig. 2c, the diffraction peaks of Fe3O4@C at 2θ = 30.26°, 35.66°, 43.22°, 53.62°, 57.21°, and 62.74° are ascribed to the (220), (311), (400), (422), (511), and (440) planes, which agree well with the standard XRD data for the cubic phase Fe3O4 (JCPDS card, file no. 89-4319), with a face-centered cubic structure.30 This result indicates the formation of the crystal Fe3O4. Meanwhile, the diffraction peaks of CuFe2O4/Cu@C at 2θ = 30.17°, 35.58°, 43.36°, 53.52°, 57.21°, 62.67°, and 74.22° were ascribed to the (220), (311), (400), (422), (511), (440), and (533) planes, which agree with the standard XRD data for CuFe2O4 (JCPDS card, file no. 77-0010). However, the diffraction peaks at 2θ = 43.36° and 74.22° were particularly strong, and an additional diffraction peak appeared at 2θ = 50.54°. As stated in a previous report,31 the diffraction peaks at 2θ = 43.36°, 74.22°, and 50.54° belong to (111), (200), and (220) planes, which agree well with Cu0 (JCPDS card, file no. 70-3039). This result indicates that the CuFe2O4/Cu@C composite was formed.
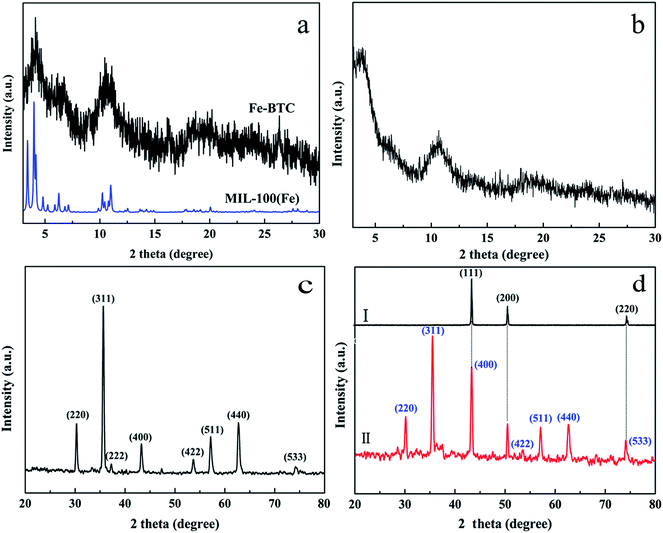 |
| | Fig. 2 XRD patterns of (a) Fe-BTC, (b) [Cu/Fe]-BTC, (c) Fe3O4@C and (d) CuFe2O4/Cu@C. | |
EA and ICP-AES analyses determined the chemical composition of the composite. Fe3O4@C consists of Fe (30.61%) and C (37.37%), and CuFe2O4/Cu@C consists of Cu (19.31%), Fe (21.84%), and C (31.36%). The relative molar ratio of Cu to Fe was 0.88 based on the quantitative analyses. This result is consistent with that of XRD and confirms the existence of Cu0.
XPS was employed to investigate the chemical state of the surface of the obtained Fe3O4@C and CuFe2O4/Cu@C. Fig. S1a† exhibits the overall survey of the as-synthesized Fe3O4@C composite and clearly shows the signals of elemental C, O, and Fe. Fig. S1a† clearly illustrates that the signal of C is significantly stronger than those of other elements (i.e., O and Fe) on the catalyst surface. This phenomenon results from the carbonization process. In addition, Fig. S1b† shows the XPS spectra of the Fe 2p spectrum. The Fe 2p spectrum can be deconvoluted into two peaks centered at 725.2 and 711.1 eV, which correspond to the peaks of Fe 2p1/2 and Fe 2p3/2. Meanwhile, the Fe 2p3/2 spectrum was resolved into three peaks at 710.0, 711.1, and 712.4 eV, which compared well with Fe2+ octahedral species, Fe3+ octahedral species, and Fe3+ tetrahedral species. In addition, the Fe 2p1/2 spectrum has the same regulation. The position of the Fe 2p peaks corresponds to that of Fe3O4.32 Fig. S1c† shows the XPS spectra of O 1s, which can be deconvoluted into three peaks centered at 529.9, 531.6, and 533.1 eV that correspond to C–O, C![[double bond, length as m-dash]](https://www.rsc.org/images/entities/char_e001.gif) O, and O–C
O, and O–C![[double bond, length as m-dash]](https://www.rsc.org/images/entities/char_e001.gif) O species. Fig. S1d† shows the XPS spectra of C 1s, which also proves the existence of the C–O, C
O species. Fig. S1d† shows the XPS spectra of C 1s, which also proves the existence of the C–O, C![[double bond, length as m-dash]](https://www.rsc.org/images/entities/char_e001.gif) O, and O–C
O, and O–C![[double bond, length as m-dash]](https://www.rsc.org/images/entities/char_e001.gif) O species. Fig. S2† shows the overall survey of the CuFe2O4/Cu@C composite, which clearly indicates the signals of elemental C, O, Cu, and Fe. Fig. S2b and S2c† show the XPS spectra of C 1s and O 1s that verify the existence of C–O, C
O species. Fig. S2† shows the overall survey of the CuFe2O4/Cu@C composite, which clearly indicates the signals of elemental C, O, Cu, and Fe. Fig. S2b and S2c† show the XPS spectra of C 1s and O 1s that verify the existence of C–O, C![[double bond, length as m-dash]](https://www.rsc.org/images/entities/char_e001.gif) O, and O–C
O, and O–C![[double bond, length as m-dash]](https://www.rsc.org/images/entities/char_e001.gif) O species. The Fe 2p spectrum (Fig. S2d†) can be deconvoluted into two peaks centered at 725 and 710 eV, which correspond to the peaks of Fe 2p1/2 and Fe 2p3/2. Meanwhile, the Fe 2p3/2 (Fe 2p1/2) spectrum was resolved into two peaks at 710.9 and 712.9 eV (724.5 and 727.4 eV), which compared well with the Fe3+ octahedral species and the Fe3+ tetrahedral species. Fig. S1e† shows the XPS spectra of the Cu 2p spectrum. The Cu 2p3/2 (Cu 2p1/2) can be deconvoluted into three peaks centered at 933.9, 935.2, and 931.9 eV (953.6, 955.1, and 951.6 eV), which compared well with the Cu2+ octahedral species, the Cu2+ tetrahedral species, and Cu0, respectively.33,34 This result also confirms the existence of Cu0.
O species. The Fe 2p spectrum (Fig. S2d†) can be deconvoluted into two peaks centered at 725 and 710 eV, which correspond to the peaks of Fe 2p1/2 and Fe 2p3/2. Meanwhile, the Fe 2p3/2 (Fe 2p1/2) spectrum was resolved into two peaks at 710.9 and 712.9 eV (724.5 and 727.4 eV), which compared well with the Fe3+ octahedral species and the Fe3+ tetrahedral species. Fig. S1e† shows the XPS spectra of the Cu 2p spectrum. The Cu 2p3/2 (Cu 2p1/2) can be deconvoluted into three peaks centered at 933.9, 935.2, and 931.9 eV (953.6, 955.1, and 951.6 eV), which compared well with the Cu2+ octahedral species, the Cu2+ tetrahedral species, and Cu0, respectively.33,34 This result also confirms the existence of Cu0.
The BET surface area was measured using the N2 adsorption/desorption isotherms at −197.2 °C. Prior to measurements, the samples were evacuated at 100 °C for 10 h. The BET surface areas (Fig. 3) of Fe3O4@C and CuFe2O4/Cu@C were 168.95 and 160.74 m2 g−1, respectively. The high BET surface areas of the catalyst supports should be useful in pollutant removal by increasing the contact frequency between the pollutants and catalyst. The inset figures show the pore size distribution curve of Fe3O4@C and CuFe2O4/Cu@C. The adsorption average pore widths were 4.31 and 2.11 nm, respectively. The two composites exhibited a significant difference in the pore size distribution because of the Cu0 block part of the channel pore.
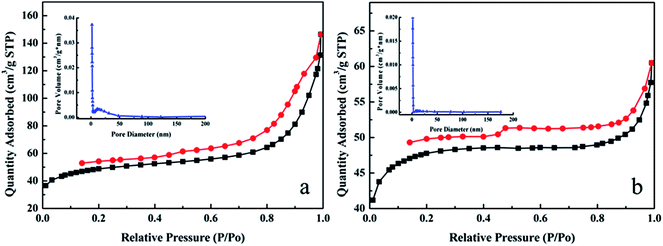 |
| | Fig. 3 N2 adsorption–desorption isotherms of (a) Fe3O4@C and (b) CuFe2O4/Cu@C. The pore-size-distribution curve of (inset a) Fe3O4@C and (inset b) CuFe2O4/Cu@C obtained from the desorption data through the BJH method. | |
The magnetic properties of the resultant core–shell microspheres were investigated at room temperature with vibrating sample magnetometry in the field range −10 kOe to 10 kOe (Fig. 4). The magnetization saturation values of Fe3O4@C and CuFe2O4/Cu@C were 41.84 and 33.36 emu g−1, respectively. The measured values indicated the strong magnetic properties of the prepared catalysts. All of the curves present a magnetic hysteresis loop that confirms the strong magnetic response to a varying magnetic field. Furthermore, Fe3O4@C and CuFe2O4/Cu@C indicated ferromagnetic-type curves that show a hysteresis loop. The values of coercivity and remanence are summarized in Table 1. The rapid aggregation of the catalysts can be observed from their homogeneous dispersion in the presence of an external magnetic field applied for 20 s. This observation directly demonstrates the convenient separation of catalysts through an external magnetic field, which is important in practical manipulation.
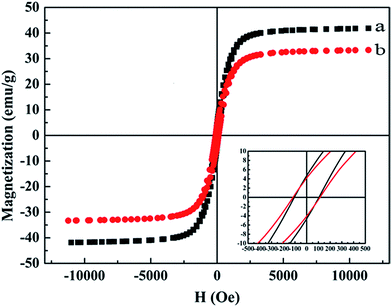 |
| | Fig. 4 Magnetic hysteresis loops of Fe3O4@C (a), and CuFe2O4/Cu@C (b). The inset is a magnified view of the magnetization versus field curves. | |
Table 1 Magnetic properties of Fe3O4@C and CuFe2O4/Cu@C
| Samples |
Magnetic properties |
| MS (emu g−1) |
HC (Oe) |
MR (emu g−1) |
| Fe3O4@C |
41.84 |
103 |
4.77 |
| CuFe2O4/Cu@C |
33.36 |
117 |
3.69 |
3.2 Catalytic properties of magnetic porous carbon composite
To prove that doping with copper can improve catalytic activity, we subsequently selected CuFe2O4/Cu@C for further analysis as a catalyst for MB degradation. The ability of CuFe2O4/Cu@C to remove MB was tested in different systems (Fig. 5). Adding the CuFe2O4/Cu@C composite to a MB solution resulted in almost 18.2% MB removal, which was likely due to adsorption only. Using the CuFe2O4/Cu@C composite in the presence of both NH2OH and H2O2 led to the removal of nearly all of the MB within 30 min. The degradation of MB was compared using pristine Fe3O4,35 prepared by traditional coprecipitation. The CuFe2O4/Cu@C composite performed more efficiently than the unmodified Fe3O4 using similar dosages of the catalyst. Conversely, when NH2OH and H2O2 were added into the MB solution without the CuFe2O4/Cu@C composite, only 2% of the MB was removed because of the free radicals formed by H2O2 in the presence of the reducing reagent NH2OH.36 This result suggests that the CuFe2O4/Cu@C composite helped degrade MB through adsorption, thus improving the reaction rate.
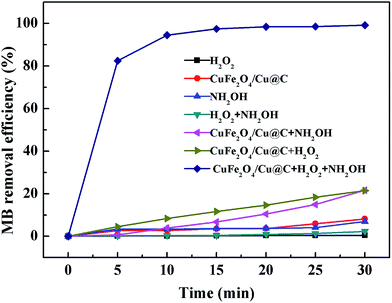 |
| | Fig. 5 Removal efficiency of MB under different conditions within 30 min. Reaction conditions: initial MB concentration, 20 mg L−1; initial H2O2 concentration, 16 mmol L−1; NH2OH concentration, 4 mmol L−1; catalyst load, 0.5 g L−1; initial solution pH, 7.0; T = 303 K. | |
The progress of MB degradation can be easily followed by the decrease in absorbance at λmax (664 nm) of MB with time. Fig. 6 shows the successive UV-Vis spectra of MB in the presence of the CuFe2O4/Cu@C composite, H2O2, and NH2OH in aqueous solution. The adsorption bead decreased rapidly and disappeared in 30 min without the appearance of new adsorption bands in the visible or ultraviolet regions. This observation indicates that the benzene ring and heteropolyaromatic linkages of MB were likely destroyed and MB was almost completely degraded. Therefore, pseudo-first order kinetics on the degradation of MB, described as ln(C/C0) = −kt, can be applied to better understand the MB degradation reaction kinetics. C is the concentration of MB at time t, C0 is the initial concentration of MB, and k is the rate constant that can be calculated from the slope of the straight line. The inset in Fig. 6 reveals the linear relationship between ln(C/C0) and the reaction time t, which matches well with the first-order reaction kinetics. The rate constant k of MB degradation was calculated to be 0.1094 min−1 at 30 °C with CuFe2O4/Cu@C composite. The calculated value is significantly higher than the literature reported value of 2.35 × 10⁻³ min−1 using titanomagnetite as the heterogeneous catalyst37 and 5.73 × 10⁻² min−1 using FeS as the heterogeneous catalyst.38
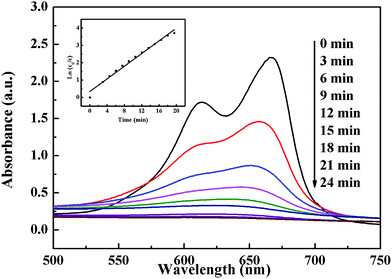 |
| | Fig. 6 UV-Vis spectral changes of the 20 mg L−1 MB solution in the degradation process as a function of the reaction time in the presence of 0.5 g L−1 CuFe2O4/Cu@C, 6.67 mmol L−1 NH2OH, and 5.33 mmol L−1 H2O2 at T = 303 K and pH 5.0. The inset figure is a first-order linear relationship. | |
The as-synthesized CuFe2O4/Cu@C composite showed excellent degradation compared with Fe3O4@C (Fig. 7). The dynamic degradation curve shows that the removal efficiency reached 100% within 15 min in the presence of the CuFe2O4/Cu@C composite. However, when Fe3O4@C worked as a catalyst, MB degradation was only 56% after 15 min. To Fe3O4, the value was only 2%. Fig. 7b shows that the homogeneous solution generated more ˙OH in the presence of the CuFe2O4/Cu@C composite. The result indicates the synergistic effect of Cu0 in the generation of ˙OH.
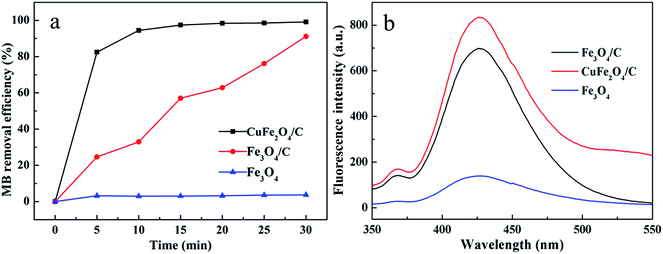 |
| | Fig. 7 Removal efficiency of MB under different catalysts (a), the dosage of HO˙ generated under different catalysts (b). Conditions: (a) MB, 20 mg L−1; H2O2, 5.33 mmol L−1; NH2OH, 6.67 mmol L−1; catalysts, 0.5 g L−1; T = 303 K; pH 5. | |
3.3 Exploration of the degradation conditions
3.3.1 Effect of pH. An assessment of the effects of pH was initially investigated in the presence of H2O2 and NH2OH (Fig. 8a). Tests were conducted at pH 3.02, 5.12, 8.14, and 10.11. MB degradation was nearly 100% within 15 min at pH 3.02, 5.12, and 8.14. However, the removal efficiency of the composite decreased to 80% at pH 10.11. Generally, pH 3.0 is optimal for organic pollutant degradation by Fenton systems.39 The best pH value for the degradation of MB in this Fenton-like system was approximately 3, as seen in Fig. 8a. This observation is consistent with the classical Fenton reaction. The classical Fenton reagent is effective only within a low and narrow pH range, but the CuFe2O4/Cu@C composite resulted in a broader range for the Fenton reaction. The degradation of MB is less efficient at a higher pH because of the instability of H2O2 in an alkaline solution; the production of ˙OH on the surface of CuFe2O4/Cu@C composite was gradually restricted with increasing pH, which also resulted in a slower degradation rate of MB.40 The process of H2O2 activation by CuFe2O4/Cu@C composite is speculated to involve the following steps:41–43| | |
Cu2+ + NH2OH → Cu+ + ˙ONH2 + H+
| (2) |
| | |
5Fe3+ + ˙ONH2 + 2H2O → 5Fe2+ + NO3− + 6H+
| (3) |
| | |
Fe3+ + Cu+ → Fe2+ + Cu2+
| (4) |
| | |
Fe2+·H2O + H2O2 → Fe2+·H2O2
| (5) |
| | |
Fe2+·H2O2 → Fe3+ + ˙OH + OH
| (6) |
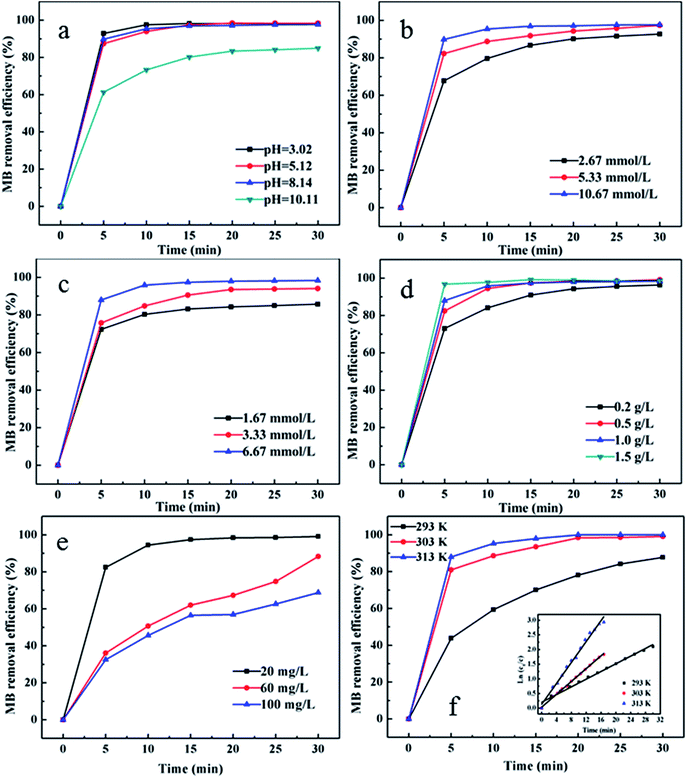 |
| | Fig. 8 Effect of the (a) pH, (b) H2O2 concentration, (c) NH2OH concentration, (d) dosage of the catalyst, (e) MB concentration, and (f) temperature conditions: (a) MB, 20 mg L−1; H2O2, 5.33 mmol L−1; NH2OH, 6.67 mmol L−1; CuFe2O4/Cu@C, 0.5 g L−1; T = 303 K; (b) MB, 20 mg L−1; pH, 5.0; NH2OH, 6.67 mmol L−1; CuFe2O4/Cu@C, 0.5 g L−1; T = 303 K; (c) MB, 20 mg L−1; H2O2, 5.33 mmol L−1; pH, 5.0; CuFe2O4/Cu@C, 0.5 g L−1; T = 303 K; (d) MB, 20 mg L−1; H2O2, 5.33 mmol L−1; NH2OH, 6.67 mmol L−1; pH, 5.0; T = 303 K; (e) pH, 5.0; H2O2, 5.33 mmol L−1; NH2OH, 6.67 mmol L−1; CuFe2O4/Cu@C, 0.5 g L−1; T = 303 K; (f) MB, 20 mg L−1; H2O2, 5.33 mmol L−1; NH2OH, 6.67 mmol L−1; CuFe2O4/Cu@C, 0.5 g L−1; pH, 5.0. | |
3.3.2 Effect of H2O2 concentration. Another important parameter in removing MB is the concentration of H2O2. The added amount of H2O2 varied from 2.67 mmol to 10.67 mmol (Fig. 8b). The removal efficiency of MB improved as the H2O2 concentration increased from 2.67 mmol L−1 to 5.33 mmol L−1, but the removal efficiency did not change significantly from 5.33 mmol L−1 to 10.67 mmol L−1. This observation may have occurred because H2O2 could not generate a sufficient number of ˙OH radicals, which slowed the oxidation rate and reduced the removal efficiency at low concentrations. Higher concentrations of H2O2 could generate enough ˙OH radicals. However, the use of excess H2O2 is wasteful and costly, and this process can also reduce the efficiency because of the hydroxyl radical scavenging effect44 (eqn (8) and (9)). Hence, 5.33 mmol L−1 is optimal for MB degradation by the Fenton-like system.| | |
H2O2 + ˙OH → H2O + ˙OOH
| (8) |
| | |
˙OOH + ˙OH → H2O + O2
| (9) |
3.3.3 Effect of NH2OH concentration. NH2OH is a common reducing agent that is used to eliminate problems associated with the traditional homogenous Fenton system, such as the accumulation of Fe3+ and the narrow pH range limits.45 Research indicates that adding NH2OH to a Fenton-like system could accelerate the redox cycles of Fe3+ to Fe2+. Hence, compared with no NH2OH, the new system notably alleviated the Fe3+ accumulation, enhanced the reaction rates, and expanded the effective pH range. The generation of ˙OH was significantly faster because of the participation of NH2OH. In addition, the NO3− and N2O were proposed as the dominant end-products of NH2OH. Considering the excellent effects of NH2OH in a homogenous Fenton system, we added it into a heterogeneous Fenton-like system to evaluate its synergistic effect. The added amount of NH2OH varied from 1.67 to 6.67 mmol L−1 (Fig. 8c). The degradation percentage of MB increased with NH2OH concentration. When the NH2OH concentration reached 6.67 mmol L−1, the removal efficiency was above 100%. These results indicate that NH2OH also produced a positive effect in the heterogeneous Fenton-like system. NH2OH accelerated the redox cycles of Fe3+ to Fe2+ involving the following steps:| | |
Fe3+ + NH2OH → Fe2+ + ˙ONH2 + H+
| (10) |
| | |
Fe3+ + ˙ONH2 → Fe2+ + NHO + H+
| (11) |
3.3.4 Effect of catalyst dosage. The use of excessive catalyst is wasteful and costly; hence, the dosage of the catalyst was also evaluated using the CuFe2O4/Cu@C composite of 0.2, 0.5, 1.0, and 1.5 g L−1 in degradation reactions. The initial rates increased with the amount of CuFe2O4/Cu@C composite. The improved efficiency caused by increased catalyst loading introduced more active sites, which generated more free-radical species that promote the degradation reaction. In Fig. 8d, the removal efficiency reached 100% within 20 min when the catalyst concentration was 0.5 g L−1.
3.3.5 Effect of MB dosage. The influence of MB dosage was investigated using the MB at 20, 60, and 100 mg L−1 (Fig. 8e). The efficiency decreased because of the increased concentration of MB within 30 min. This result indicated that the extension of the reaction time is necessary when dealing with a large amount of organic pollutants.
3.3.6 Effect of the temperature. Determining the reaction rates under different temperatures is often very useful in providing insights on reaction mechanisms. Increasing temperature usually causes a significant increase in the reaction rate depending on the reaction processes. Experiments on the effect of temperature were conducted to evaluate the activation energy (Fig. 8f). An Arrhenius equation describing the relationship between rate constants and temperature was applied:
where k is the measured first-order rate constant, A0 is a frequency factor, Ea is the activation energy, R is the ideal gas constant, and T is the temperature. The activation energy for the degradation of MB was measured in a closed batch system, and the temperature varied from 293 K to 313 K. The value of the activation energy was 38.16 kJ mol−1, which indicates that the reaction is a surface-controlled reaction.46 The rate constants at different temperatures are summarized in Table 2.
Table 2 The measured rate constants of MB degradation at different temperatures
| T (K) |
CuFe2O4/Cu@C |
| k (min−1) |
R2 |
| 293 |
0.06562 |
0.987 |
| 303 |
0.10942 |
0.998 |
| 313 |
0.17850 |
0.989 |
3.4 Stability and reuse of the catalyst
The stability of the CuFe2O4/Cu@C composite is a critical factor for its practical applications. To evaluate the catalyst stability of the catalysts, we carried out recycling reactions for the degradation of MB. The solid catalyst was magnetically separated from the reactant mixture, washed with ethanol, and vacuum-dried at 60 °C after each catalytic cycle. The MB concentrations were detected to evaluate the catalytic activity in the repeated process, and the initial MB concentration was 20 mg L−1. As shown in Fig. 9, the catalyst retained its original activity after 10 repeated reuses. Both the MB and TOC concentrations were detected to evaluate the catalytic activity in the repeated process. This result indicates that the efficiency of TOC removal was lower than the MB removal efficiency with each repetition; the maximum efficiency of TOC removal was 70%, whereas it was nearly 100% in MB removal. The eventual decrease of the catalytic activity may have been caused by the incomplete removal of byproducts during washing. The stability of the CuFe2O4/Cu@C composite was better compared with other heterogeneous Fenton catalysts.47,48 To investigate the structure of the catalyst after the Fenton reaction, XPS was used after 10 repeated reuses (Fig. 10). The details of the Fe 2p peaks and Cu 2p peaks of the CuFe2O4/Cu@C composite before and after use during MB degradation are presented in Table 3. This result indicates the presence of one oxidation state for the surface iron species before being used. The Fe 2p3/2 (Fe 2p1/2) spectrum was resolved into two peaks at 710.9 and 712.9 eV (724.5 and 727.4 eV), which compared well with the Fe3+ octahedral species and Fe3+ tetrahedral species. For the sample after MB degradation, Fe3+ was 68.6% and Fe2+ was 31.4%. These values indicate that part of Fe3+ in the outermost layer of the catalyst was deoxidized into Fe2+ during the Fenton reaction. For the copper species, Cu 2p3/2 (Cu 2p1/2) can be deconvoluted into three peaks centered at 933.9, 935.2, and 931.9 eV (953.6, 955.1, and 951.6 eV), which compared well with Cu2+ octahedral species, Cu2+ tetrahedral species, and Cu0, respectively. However, the percentage of Cu2+ decreased from 80.3% to 60.6% after MB degradation. Copper was involved in the heterogeneous Fenton-like reaction. All of these results further indicate that the catalyst exhibited excellent durability because of the protective effects of the porous carbon support and the presence of NH2OH.
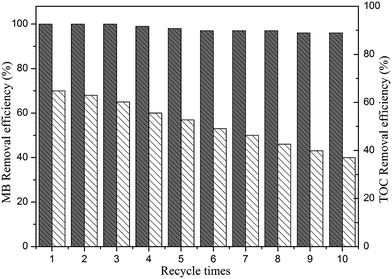 |
| | Fig. 9 Reuse of the catalyst. Reaction conditions: MB, 20 mg L−1; H2O2, 5.33 mmol L−1; NH2OH, 6.67 mmol L−1; CuFe2O4/Cu@C, 0.5 g L−1; T = 303 K; pH, 5. | |
 |
| | Fig. 10 XPS spectrum of iron before (a) and after (c) and copper before (b) and after (d) degradation of MB. | |
Table 3 XPS analysis of iron and copper on CuFe2O4/Cu@C before and after degradation of MB
| |
Fe2+ |
Fe3+ |
Cu |
Cu+ |
Cu2+ |
| Binding energy (eV) |
Fresh |
— |
711.4 |
931.9 |
— |
934.1 |
| Used |
710.3 |
711.9 |
931.9 |
934.3 |
| The ratio of element valence state (%) |
Fresh |
0 |
100 |
19.7 |
— |
80.3 |
| Used |
31.4 |
68.6 |
39.4 |
60.6 |
4. Conclusion
In conclusion, the CuFe2O4/Cu@C composite was fabricated by annealing [Cu/Fe]-BTC at 500 °C in an inert atmosphere. The resultant composite material showed excellent catalytic performance in MB degradation and superparamagnetic behavior that enabled magnetic separation and convenient recovery from the reaction mixture. Moreover, the composite was stable and reusable, indicating that it could overcome the drawbacks of homogeneous catalysts. For comparison, the Fe3O4@C composite was fabricated using the same strategy. Results showed that CuFe2O4/Cu@C had a higher catalytic activity than Fe3O4@C, which proved the importance of copper doped into the catalyst. Therefore, the composite catalysts show great potential for industrial applications.
Acknowledgements
The authors would like to express their appreciation for research funding provided by the National Natural Science Foundation of China (No. 21374045, 21074049) and the National Science Foundation for Fostering Talents in Basic Research of the National Natural Science Foundation of China (Grant No. J1103307).
References
- J. H. Mo, Y. H. Lee, J. Kim, J. Y. Jeong and J. Jegal, Dyes Pigm., 2008, 76, 429–434 CrossRef CAS PubMed.
- M. Rafatullah, O. Sulaiman, R. Hashim and A. Ahmad, J. Hazard. Mater., 2010, 177, 70–80 CrossRef CAS PubMed.
- C. Meehan, A. J. Bjourson and G. McMullan, Int. J. Syst. Evol. Microbiol., 2001, 51, 1681–1685 CrossRef CAS.
- L. Shen, P. Yan, X. Guo, H. Wei and X. Zheng, Arabian J. Sci. Eng., 2014, 39, 6659–6664 CrossRef CAS.
- K. Dutta, S. Mukhopadhyay, S. Bhattacharjee and B. Chaudhuri, J. Hazard. Mater., 2001, 84, 57–71 CrossRef CAS.
- A. Georgi and F.-D. Kopinke, Appl. Catal., B, 2005, 58, 9–18 CrossRef CAS PubMed.
- Y. Yoshida, S. Ogata, S. Nakamatsu, T. Shimamune, K. Kikawa, H. Inoue and C. Iwakura, Electrochim. Acta, 1999, 45, 409–414 CrossRef CAS.
- M. Neamţu, C. Catrinescu and A. Kettrup, Appl. Catal., B, 2004, 51, 149–157 CrossRef PubMed.
- M. Pérez, F. Torrades, X. Domènech and J. Peral, Water Res., 2002, 36, 2703–2710 CrossRef.
- I. A. Salem, Appl. Catal., B, 2000, 28, 153–162 CrossRef CAS.
- A. H. Gemeay, I. A. Mansour, R. G. El-Sharkawy and A. B. Zaki, J. Mol. Catal. A: Chem., 2003, 193, 109–120 CrossRef CAS.
- V. V. Ishtchenko, K. D. Huddersman and R. F. Vitkovskaya, Appl. Catal., A, 2003, 242, 123–137 CrossRef CAS.
- S. Letaïef, B. Casal, P. Aranda, M. A. Martín-Luengo and E. Ruiz-Hitzky, Appl. Clay Sci., 2003, 22, 263–277 CrossRef.
- G. Tachiev, J. A. Roth and A. R. Bowers, Int. J. Chem. Kinet., 2000, 32, 24–35 CrossRef CAS.
- S. Zhang, X. Zhao, H. Niu, Y. Shi, Y. Cai and G. Jiang, J. Hazard. Mater., 2009, 167, 560–566 CrossRef CAS PubMed.
- J. Chun, H. Lee, S.-H. Lee, S.-W. Hong, J. Lee, C. Lee and J. Lee, Chemosphere, 2012, 89, 1230–1237 CrossRef CAS PubMed.
- L. Kong, X. Lu, X. Bian, W. Zhang and C. Wang, ACS Appl. Mater. Interfaces, 2011, 3, 35–42 CAS.
- W. Liu, J. Qian, K. Wang, H. Xu, D. Jiang, Q. Liu, X. Yang and H. Li, J. Inorg. Organomet. Polym., 2013, 23, 907–916 CrossRef CAS.
- H. Zhao, Y. Wang, Y. Wang, T. Cao and G. Zhao, Appl. Catal., B, 2012, 125, 120–127 CrossRef CAS PubMed.
- D. Bradshaw, J. B. Claridge, E. J. Cussen, T. J. Prior and M. J. Rosseinsky, Acc. Chem. Res., 2005, 38, 273–282 CrossRef CAS PubMed.
- M. O’Keeffe, M. A. Peskov, S. J. Ramsden and O. M. Yaghi, Acc. Chem. Res., 2008, 41, 1782–1789 CrossRef PubMed.
- N. L. Rosi, J. Eckert, M. Eddaoudi, D. T. Vodak, J. Kim, M. O’Keeffe and O. M. Yaghi, Science, 2003, 300, 1127–1129 CrossRef CAS PubMed.
- C.-X. Yang, H.-B. Ren and X.-P. Yan, Anal. Chem., 2013, 85, 7441–7446 CrossRef CAS PubMed.
- P. Horcajada, T. Chalati, C. Serre, B. Gillet, C. Sebrie, T. Baati, J. F. Eubank, D. Heurtaux, P. Clayette, C. Kreuz, J.-S. Chang, Y. K. Hwang, V. Marsaud, P.-N. Bories, L. Cynober, S. Gil, G. Ferey, P. Couvreur and R. Gref, Nat. Mater., 2010, 9, 172–178 CrossRef CAS PubMed.
- B. Li, Y. Zhang, D. Ma, L. Li, G. Li, G. Li, Z. Shi and S. Feng, Chem. Commun., 2012, 48, 6151–6153 RSC.
- W. Cho, S. Park and M. Oh, Chem. Commun., 2011, 47, 4138–4140 RSC.
- X. Yan, X. Li, Z. Yan and S. Komarneni, Appl. Surf. Sci., 2014, 308, 306–310 CrossRef CAS PubMed.
- T. D. Bennett and A. K. Cheetham, Acc. Chem. Res., 2014, 47, 1555–1562 CrossRef CAS PubMed.
- S. Shahid and K. Nijmeijer, J. Membr. Sci., 2014, 459, 33–44 CrossRef CAS PubMed.
- B. Li, H. Cao, J. Shao, M. Qu and J. H. Warner, J. Mater. Chem., 2011, 21, 5069–5075 RSC.
- L. Chen, Y. Shen, J. Bai and C. Wang, J. Solid State Chem., 2009, 182, 2298–2306 CrossRef CAS PubMed.
- D. Wilson and M. A. Langell, Appl. Surf. Sci., 2014, 303, 6–13 CrossRef CAS PubMed.
- C. Reitz, C. Suchomski, J. Haetge, T. Leichtweiss, Z. Jaglicic, I. Djerdj and T. Brezesinski, Chem. Commun., 2012, 48, 4471–4473 RSC.
- Y. Wang, H. Zhao, M. Li, J. Fan and G. Zhao, Appl. Catal., B, 2014, 147, 534–545 CrossRef CAS PubMed.
- Z. L. Liu, Y. J. Liu, K. L. Yao, Z. H. Ding, J. Tao and X. Wang, J. Mater. Synth. Process., 2002, 10, 83–87 CrossRef CAS.
- S. Y. Wang and H. Jiao, J. Agric. Food Chem., 2000, 48, 5677–5684 CrossRef CAS PubMed.
- S. Yang, H. He, D. Wu, D. Chen, Y. Ma, X. Li, J. Zhu and P. Yuan, Ind. Eng. Chem. Res., 2009, 48, 9915–9921 CrossRef CAS.
- A. K. Dutta, S. K. Maji, D. N. Srivastava, A. Mondal, P. Biswas, P. Paul and B. Adhikary, ACS Appl. Mater. Interfaces, 2012, 4, 1919–1927 CAS.
- S. M. Arnold, W. J. Hickey and R. F. Harris, Environ. Sci. Technol., 1995, 29, 2083–2089 CrossRef CAS PubMed.
- F. Ji, C. Li, J. Zhang and L. Deng, Desalination, 2011, 269, 284–290 CrossRef CAS.
- L. Chen, J. Ma, X. Li, J. Zhang, J. Fang, Y. Guan and P. Xie, Environ. Sci. Technol., 2011, 45, 3925–3930 CrossRef CAS PubMed.
- J. Lind and G. Merényi, J. Phys. Chem. A, 2006, 110, 192–197 CrossRef CAS PubMed.
- X. Zhang, Y. Ding, H. Tang, X. Han, L. Zhu and N. Wang, Chem. Eng. J., 2014, 236, 251–262 CrossRef CAS PubMed.
- C. Walling, Acc. Chem. Res., 1975, 8, 125–131 CrossRef CAS.
- L. Chen, J. Ma, X. Li, J. Zhang, J. Fang, Y. Guan and P. Xie, Environ. Sci. Technol., 2011, 45, 3925–3930 CrossRef CAS PubMed.
- H.-L. Lien and W.-X. Zhang, Appl. Catal., B, 2007, 77, 110–116 CrossRef CAS.
- T. D. Nguyen, N. H. Phan, M. H. Do and K. T. Ngo, J. Hazard. Mater., 2011, 185, 653–661 CrossRef CAS PubMed.
- M. Zhu and G. Diao, J. Phys. Chem. C, 2011, 115, 18923–18934 CAS.
Footnotes |
| † Electronic supplementary information (ESI) available. See DOI: 10.1039/c5ra12621e |
| ‡ These authors contributed equally to this work. |
|
| This journal is © The Royal Society of Chemistry 2015 |
Click here to see how this site uses Cookies. View our privacy policy here. ![[double bond, length as m-dash]](https://www.rsc.org/images/entities/char_e001.gif) O, and O–C
O, and O–C![[double bond, length as m-dash]](https://www.rsc.org/images/entities/char_e001.gif) O species. Fig. S1d† shows the XPS spectra of C 1s, which also proves the existence of the C–O, C
O species. Fig. S1d† shows the XPS spectra of C 1s, which also proves the existence of the C–O, C![[double bond, length as m-dash]](https://www.rsc.org/images/entities/char_e001.gif) O, and O–C
O, and O–C![[double bond, length as m-dash]](https://www.rsc.org/images/entities/char_e001.gif) O species. Fig. S2† shows the overall survey of the CuFe2O4/Cu@C composite, which clearly indicates the signals of elemental C, O, Cu, and Fe. Fig. S2b and S2c† show the XPS spectra of C 1s and O 1s that verify the existence of C–O, C
O species. Fig. S2† shows the overall survey of the CuFe2O4/Cu@C composite, which clearly indicates the signals of elemental C, O, Cu, and Fe. Fig. S2b and S2c† show the XPS spectra of C 1s and O 1s that verify the existence of C–O, C![[double bond, length as m-dash]](https://www.rsc.org/images/entities/char_e001.gif) O, and O–C
O, and O–C![[double bond, length as m-dash]](https://www.rsc.org/images/entities/char_e001.gif) O species. The Fe 2p spectrum (Fig. S2d†) can be deconvoluted into two peaks centered at 725 and 710 eV, which correspond to the peaks of Fe 2p1/2 and Fe 2p3/2. Meanwhile, the Fe 2p3/2 (Fe 2p1/2) spectrum was resolved into two peaks at 710.9 and 712.9 eV (724.5 and 727.4 eV), which compared well with the Fe3+ octahedral species and the Fe3+ tetrahedral species. Fig. S1e† shows the XPS spectra of the Cu 2p spectrum. The Cu 2p3/2 (Cu 2p1/2) can be deconvoluted into three peaks centered at 933.9, 935.2, and 931.9 eV (953.6, 955.1, and 951.6 eV), which compared well with the Cu2+ octahedral species, the Cu2+ tetrahedral species, and Cu0, respectively.33,34 This result also confirms the existence of Cu0.
O species. The Fe 2p spectrum (Fig. S2d†) can be deconvoluted into two peaks centered at 725 and 710 eV, which correspond to the peaks of Fe 2p1/2 and Fe 2p3/2. Meanwhile, the Fe 2p3/2 (Fe 2p1/2) spectrum was resolved into two peaks at 710.9 and 712.9 eV (724.5 and 727.4 eV), which compared well with the Fe3+ octahedral species and the Fe3+ tetrahedral species. Fig. S1e† shows the XPS spectra of the Cu 2p spectrum. The Cu 2p3/2 (Cu 2p1/2) can be deconvoluted into three peaks centered at 933.9, 935.2, and 931.9 eV (953.6, 955.1, and 951.6 eV), which compared well with the Cu2+ octahedral species, the Cu2+ tetrahedral species, and Cu0, respectively.33,34 This result also confirms the existence of Cu0.


