Adrian Mermer,
Tadeusz Lis and
Przemysław Starynowicz*
Wydział Chemii, Uniwersytet Wrocławski, ul. F. Joliot-Curie 14, 50-383 Wrocław, Poland. E-mail: przemyslaw.starynowicz@chem.uni.wroc.pl
First published on 5th November 2015
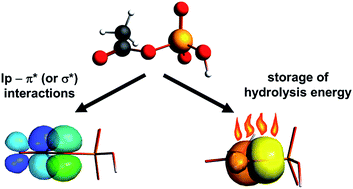
Charge density analysis has been performed for crystals of ammonium dihydrogen phosphoenolpyruvate (I) and diammonium hydrogen phosphoglycolate (II). The former compound is a high-energy phosphate ester that stores and provides energy for various biochemical processes, whereas the latter is a low energy one. The main difference between both molecules is mainly manifested by topological parameters of the P–O and C–O bonds within the ester C–O–P bridge. The charge density at the bond critical point in I is larger for C–O and smaller for P–O than in II. Theoretical DFT and NBO calculations show that the ester O atom has an approximate sp2 hybridization with two lone pairs: the spx (x = 1.2–1.6) and the p one. The latter, which is perpendicular to the C–O–P plane, interacts with the π*(C–C) orbital of the enolpyruvate fragment in I. Extended DFT calculations, performed for 15 model organic phosphates showed that the interaction of the p lone pair (called tlp hereinafter) with the organic part determines predominantly the geometry of the C–O–P fragment as well as the energy of hydrolysis. The interaction of tlp with a neighboring π* or a low-lying σ* orbital from the organic part creates an additional bonding effect along C–O, while the interaction of tlp with the σ* orbitals of the terminal P–O bonds strengthens the ester P–O bond. These two interactions are negatively correlated and the former is determinant. The P–O and C–O distances are additionally modified by interactions of the ester σ(P–O) and the sp2 pair with the organic part. On the other hand the hydrolysis energy is proportional to the interaction of tlp with the organic part. Regression analysis of the DFT results shows that the hydrolysis energy may be interpreted as being released mainly from the spx pair and the σ(P–O) orbital. It has been also shown that this energy may be in principle deduced from the topological parameters retrieved from the experimental charge density distribution.
One of the most widely recognized examples of energy storing phosphates is adenosine triphosphate or ATP. Its hydrolysis to adenosine mono- or diphosphate (AMP or ADP) provides the energy for numerous biological processes e.g. muscle tension, cellular motion, proton gradient generation and the synthesis of various biological molecules and components. Regeneration of ATP requires, however, energy that must be provided by hydrolysis of another high-energy molecule, e.g. phosphoenolpyruvic acid (H2O3POC(CH2)COOH, abbreviated as H3PEP). Table 1 shows some of the metabolic organic phosphates with their corresponding standard ΔGohydr.1,2 Conventionally, ATP delimits the high-energy phosphates from the low-energy ones.
Compound | ΔGohydr | ||
---|---|---|---|
kJ mol−1 | kcal mol−1 | Ref. | |
Glycerol-3-phosphate | −9.2 | −2.2 | 2 |
Methyl monophosphate | −9.2 | −2.2 | 2 |
Glucose-3-phosphate | −9.2 | −2.2 | 1 |
Glucose-6-phosphate | −13.8 | −3.3 | 1 and 2 |
Glucose-1-phosphate | −20.9 | −5.0 | 1 and 2 |
Adenosine triphosphate | −30.5 | −7.3 | 1 |
Acetyl phosphate | −43.1 | −10.3 | 2 |
1,3-Bisphosphoglycerate | −49.4 | −11.8 | 1 and 2 |
Carbamoyl phosphate | −49.4 | −11.8 | 2 |
Phosphoenolpyruvate | −61.9 | −14.8 | 1 |
Because of the role the phosphate esters play in the metabolism, the question about the reasons behind the variation of their ΔGohydr has attracted the interest of many researchers (e.g. ref. 3–10 and many others).
For instance, one of the widely used textbook explanations in regard to ATP in its physiological form ATP4− emphasizes the role of resonance stabilization of the products, electrostatic repulsion between the neighboring phosphate groups and stabilization due to solvation effects;1 nevertheless this explanation is rather of qualitative character and cannot offer quantitative predictions of the ΔGohydr for other phosphate compounds. One of the proposed explanations, known as the ‘competition for the lone pair’, stresses the role of the competition for the electron density of lone pairs of the bridging ester oxygen atom between the phosphate moiety and the organic rest.11 Following this rationalization, greater ability to attract the electron density by the organic substituent would result in diminished strength of interaction between the bridging O atom and the phosphate moiety, thus leading to the creation of less stable, more exothermic molecules.
Several reports have focused on the role of negative hyperconjugation, referred to as the generalized anomeric effect, in phosphate reactivity.12–14 It has been shown by Kirby et al.15–17 on grounds of crystallographic and kinetic studies that a structure–reactivity correlation can be drawn in reference to the lengths of scissile ester P–O bonds. First observations made for another class of compounds, heterocyclic acetal esters, indicated that a relationship between the effective electronegativity of the leaving group, as measured by the pKa of the appropriate alcohol and the length of the scissile C–O bonds exists. It has been proposed that both acetal oxygen atoms (endocyclic and exocyclic one) take part in n(O)–σ*(C–O) donor–acceptor interactions, weakening thus the scissile bonds and reinforcing the neighboring ones.
Kirby et al. hypothesized that the mechanism behind the observed correlation of structure and reactivity would rest in energy changes of the bridging σ*(C–O) orbital. It was argued that for labile, high-energy compounds lowering of σ*(C–O) energy caused by the increased electronegativity of the substituents would promote additional donation from the oxygen lone pairs. This would also result in the elongation and weakening of the scissile bridging C–O bond on one hand, and in shortening and strengthening of the endocyclic acetal one on the other. An interplay scheme was thus proposed where the two bonds were either reinforced or weakened in an opposing manner by donor–acceptor interactions involving oxygen lone pairs. These observations were then generalized to phosphate esters, where the scissile ester P–O bonds play in a sense a role similar to the exocyclic C–O bonds.
The influence of oxygen electron lone pairs on P–O bonds has been demonstrated in a number of studies. For instance, in early Gorenstein and coworkers' papers18–20 on phosphate and phosphorane compounds the ester P–O bonds were shown to change depending on the orientation of the lone pairs of the ester O atoms.
Extensive evidence of the influence of the anomeric or hyperconjugation effects on the P–O bond lengths and ΔGohydr was given by Ruben et al.2 Based on the NBO analysis21,22 of a variety of phosphate compounds, these authors reached the conclusion that there is a positive correlation between the extent of the generalized n(O) → σ*(P–O) anomeric effect and the values of ΔGohydr. This was evidenced by the analysis of the σ*(P–O) orbital populations and the energies of orbital interactions based on second order perturbation correction (E(2)ij). According to these authors, similar correlations also hold with regard to the P–O bond lengths, the σ*(P–O) orbital energies and the polarity of ester P–O bonds. In other words, their results indicated that the more polar the studied σ*(P–O)ester orbitals and the lower their energies are, the higher their populations will be. This corresponds to longer ester P–O bonds and greater ΔGohydr values for the studied set of model phosphates. In this way they obtained results which were in line with the mechanism proposed by Kirby et al. for scissile C–O and P–O bonds.
Studies on the role of coordination and solvation of the phosphate group23–25 demonstrated the role of stabilisation of phosphate terminal oxygen lone pairs in various media.
These studies have, nevertheless, focused mainly on the local interactions that could largely be attributed to the phosphate group. Factors concerning the organic parts of studied molecules were accounted for in a very limited degree only. Our aim is therefore to investigate the role of these fragments. Our interest has been sparked by the fact that the observed high values of ΔGohydr are often associated with molecules that have a double bond in the nearest vicinity of the ester P–O–C bridge.11 This is the case of phosphoenolpyruvate, acetyl phosphate and carbamoyl phosphate, as it may be seen in Table 1.
The scope of this paper includes a study of experimental charge density and theoretical calculations of two molecules of some biological significance: dihydrogen phosphoenolpyruvate, H2PEP−, in a crystal of ammonium dihydrogen phosphoenolpyruvate and hydrogen phosphoglycolate, HPG2− (HO3POCH2COO2−), in a crystal of diammonium hydrogen phosphoglycolate. Structurally these two compounds differ from each other by the presence of an additional methylidene substituent at the ester C atom in the former. Phosphoenolpyruvic acid has the highest value of ΔGohydr of the organic phosphates involved in glycolysis.1 On the other hand phosphoglycolic acid is a low-energy phosphate that takes part in the plant photorespiration process;26 it has also been found in the tissues of humans.27 This choice was dictated by comparable ionization states of the phosphate group and the presence of the same countercation i.e. NH4+. In order to get a wider insight into the interactions between the phosphate group and the organic rest we have performed DFT and NBO calculations for 15 model molecules. The results have allowed to rationalize the experimental results and to propose a connection between the molecular structure and such features as the geometry of the ester C–O–P bridge or the hydrolysis energy.
The approach adopted for multipole refinements was as follows. The C–H and O–H bond lengths were reset after each cycle to values obtained from the DFT cluster calculations; the N–H distances were taken from Allen et al.33
The imposed constraints were: 1.09 Å for C–H bonds in I, 1.103 Å in II, 1.03 Å for N–H bonds; 1.03 Å for the phosphate hydroxyl O–H in I and 1.06 Å in II, as well as 1.05 Å for the carboxylic O–H in II. For the H atoms bonded to the main molecular skeleton of the anions, the harmonic anisotropic displacement parameters were estimated by the SHADE2.1 server34 and kept fixed during the refinement. The ammonium H atoms were refined with isotropic atomic displacement parameters. Multipolar functions of phosphorus, oxygen, nitrogen and carbon atoms were expanded up to l = 3 and hydrogen atoms up to l = 2. However, for C-bonded H atoms only the quadrupole terms parallel to the C–H bond were refined, whereas for the O- and N-bonded H atoms all quadrupolar terms were refined in order to reproduce the deformations caused by strong hydrogen bonds. The oxygen atoms in both compounds were divided into classes based on their vicinity, with separate expansion/contraction parameters κ and κ′; see ESI† for the details. For the terminal phosphate O atoms, only the spherical κ was refined, while the multipolar κ′ values were fixed at 0.75 to prevent uncontrolled expansion of the radial functions. In the case of I an individual electric charge constraint (Q = +1) was applied to the NH4+ cation The radial deformation functions Rl(r) were in the form of single Slater functions [ζn+3/(n + 2)!]rnexp(−ζr). For phosphorus n was 6, 7, 8 for dipoles, quadrupoles and octupoles, respectively, and the initial ζ value was 5.19 bohr−1.
Correction for isotropic extinction (mosaic distribution dominated, Gaussian distribution) was included for both compounds, following the scheme given by Becker & Coppens.35 The Hirshfeld36 rigid bond test results indicated good quality of the model, with values for bonds between non-H atoms not exceeding 5 × 10⁻⁴ Å2. The crystal data and refinement details for both crystals are presented in Table 2.
Crystal data | I | II |
---|---|---|
Chemical formula | C3H8NO6P | C2H11N2O6P |
Mr | 185.07 | 190.10 |
Crystal system, space group | Orthorhombic, Pbca | Monoclinic, P21/c |
Temperature (K) | 85 | 85 |
a, b, c (Å) | 14.6460(7), 13.0224(9), 7.4486(6) | 13.189(4), 8.079(3), 13.804(4) |
β (°) | 91.27(3) | |
V (Å3) | 1420.64(17) | 1470.5(8) |
Z | 8 | 8 |
Radiation type | Mo Kα | Mo Kα |
μ (mm−1) | 0.37 | 0.37 |
Crystal size (mm) | 0.54 × 0.44 × 0.18 | 0.37 × 0.32 × 0.28 |
Data collection | ||
Tmin, Tmax | 0.845, 0.941 | 0.907, 0.928 |
No. of measured, independent and observed [>3σ(I)] reflections | 116![]() ![]() ![]() |
134![]() ![]() ![]() |
Rint | 0.023 | 0.024 |
Refinement | ||
R[F2 > 3σ(F2)], wR(F2), S | 0.014, 0.014, 1.59 | 0.018, 0.017, 1.47 |
No. of reflections | 8332 | 17![]() |
No. of parameters | 356 | 760 |
No. of restraints | 0 | 0 |
Δρmax, Δρmin (e Å−3) | 0.23, −0.21 | 0.29, −0.28 |
In order to analyze the relation between the energy of hydrolysis and the molecular structure of organic phosphates DFT calculations for a series of model molecules have been performed. The considered reaction was:
R–OPO3H− + H2O → R–OH + H2PO4− |
In II there are two symmetry independent hydrogen phosphoglycolate anions somewhat differing in conformation. For instance the torsion angle O2–P–O1–H1 in molecule A (i.e. the angle O2A–P1A–O1A–H1A) is −147°, while for molecule B – −175°. The bonds and angles in the ester parts of the molecules are listed in Table 3.
I | |||
---|---|---|---|
P–O1 | 1.5639(2) | O1–P–O2 | 107.328(9) |
P–O2 | 1.4918(1) | O1–P–O3 | 112.724(9) |
P–O3 | 1.4995(1) | O1–P–O4 | 105.758(10) |
P–O4 | 1.6268(2) | O2–P–O3 | 118.960(9) |
O4–C2 | 1.3721(2) | O2–P–O4 | 103.054(9) |
O3–P–O4 | 107.845(9) | ||
P–O4–C2 | 125.176(14) |
II | |||
---|---|---|---|
P1A–O1A | 1.5647(2) | O1A–P1A–O2A | 99.932(10) |
P1A–O2A | 1.6037(2) | O1A–P1A–O3A | 111.479(10) |
P1A–O3A | 1.5093(2) | O1A–P1A–O4A | 111.783(11) |
P1A–O4A | 1.5069(2) | O2A–P1A–O3A | 109.915(11) |
P2B–O1B | 1.5566(2) | O2A–P1A–O4A | 108.794(11) |
P2B–O2B | 1.6016(2) | O3A–P1A–O4A | 113.993(11) |
P2B–O3B | 1.5181(2) | P1A–O2A–C2A | 118.147(15) |
P2B–O4B | 1.5025(2) | O1B–P2B–O2B | 98.904(10) |
O2A–C2A | 1.4253(3) | O1B–P2B–O3B | 112.200(11) |
O2B–C2B | 1.4212(3) | O1B–P2B–O4B | 113.186(11) |
O2B–P2B–O3B | 109.044(11) | ||
O2B–P2B–O4B | 110.609(11) | ||
O3B–P2B–O4B | 112.096(11) | ||
P2B–O2B–C2B | 118.642(15) |
Atom | Multipole refinements | DFT calculations | ||||
---|---|---|---|---|---|---|
QH | QB | QB.isol | QH.isol | QB.cl | QH.cl | |
I (NH4H2PEP) | ||||||
P | 0.41 | 3.68 | 3.65 | 0.33 | 3.69 | 0.46 |
O1 | −0.27 | −1.48 | −1.33 | −0.25 | −1.44 | −0.23 |
O2 | −0.31 | −1.49 | −1.49 | −0.47 | −1.49 | −0.30 |
O3 | −0.34 | −1.51 | −1.51 | −0.48 | −1.47 | −0.28 |
O4 | −0.24 | −1.39 | −1.23 | −0.16 | −1.30 | −0.15 |
C2 | 0.06 | 0.46 | 0.52 | 0.05 | 0.50 | 0.06 |
![]() |
||||||
II [(NH4)2HPG] | ||||||
P1A | 0.13 | 3.42 | 3.65 | 0.30 | 3.68 | 0.42 |
P2B | 0.11 | 3.38 | 3.68 | 0.30 | 3.71 | 0.42 |
O1A | −0.36 | −1.49 | −1.33 | −0.27 | −1.43 | −0.27 |
O2A | −0.33 | −1.46 | −1.30 | −0.20 | −1.30 | −0.16 |
O3A | −0.39 | −1.45 | −1.55 | −0.54 | −1.49 | −0.35 |
O4A | −0.38 | −1.46 | −1.54 | −0.52 | −1.49 | −0.34 |
O1B | −0.37 | −1.53 | −1.33 | −0.26 | −1.45 | −0.27 |
O2B | −0.30 | −1.45 | −1.29 | −0.20 | −1.30 | −0.16 |
O3B | −0.40 | −1.42 | −1.55 | −0.54 | −1.50 | −0.37 |
O4B | −0.39 | −1.47 | −1.55 | −0.53 | −1.51 | −0.34 |
C2A | −0.10 | 0.15 | 0.47 | −0.04 | 0.47 | −0.01 |
C2B | −0.11 | 0.12 | 0.45 | −0.04 | 0.43 | −0.01 |
Also the ester O atomic charges of the organic moieties show no significant difference between the studied molecules, although in this study the H2PEP− ester O atom is more positive than its counterparts in HPG2−. It is perhaps also worth to notice that the experimental charges of the phosphate ester O atoms are systematically lower than those predicted from the theoretical calculations; such a difference was observed previously in KH2PG45 and sodium bis(p-nitrophenyl)phosphate.46 Both Hirshfeld and Bader charges show that the ester C atom in H2PEP− experiences more electron withdrawal and is thus more positive than that in HPG2−, what corresponds with shorter C–Oe (Oe is the ester O atom in the C–O–P fragment) bonds in the former molecule. The methylene C atom is weakly negative, whereas the carboxylic C atoms, as in other carboxylate compounds,47 are strongly positive.
Calculations performed in vacuo and in the cluster environment convey an additional opportunity to look into the shifts of the electron density induced by intermolecular interactions, allowing thus a crude evaluation of the effects of coordination, hydrogen bonding etc. to be made. In particular, comparison of the results for the isolated molecules and the clusters shows that inclusion of the hydrogen bonds brings about a slight depletion of negative charge of terminal O atoms.
Bond | Experiment | Theoretical, cluster | Theoretical, free anion | |||
---|---|---|---|---|---|---|
ρc | ∇2ρc | ρc | ∇2ρc | ρc | ∇2ρc | |
P–O1 | 1.352(17) | 16.03(6) | 1.375 | 15.81 | 1.333 | 16.65 |
P–O2 | 1.686(21) | 20.12(8) | 1.622 | 27.55 | 1.638 | 27.55 |
P–O3 | 1.609(21) | 19.90(8) | 1.591 | 25.69 | 1.604 | 25.81 |
P–O4 | 1.138(16) | 10.70(6) | 1.179 | 11.69 | 1.145 | 12.47 |
O4–C2 | 1.940(13) | −15.29(6) | 1.898 | −12.79 | 1.958 | −15.41 |
C1–O5 | 2.359(14) | −26.82(8) | 2.310 | −17.97 | 2.243 | −14.19 |
C1–O6 | 2.882(19) | −30.30(11) | 2.763 | −12.83 | 2.800 | −15.28 |
Bond | Experiment | Theoretical, clusters | Theoretical, free anions | |||
---|---|---|---|---|---|---|
ρc | ∇2ρc | ρc | ∇2ρc | ρc | ∇2ρc | |
P1A–O1A | 1.38(3) | 14.99(8) | 1.40 | 16.41 | 1.34 | 17.74 |
P1A–O2A | 1.30(3) | 10.40(8) | 1.26 | 13.03 | 1.28 | 12.64 |
P1A–O3A | 1.65(3) | 15.89(9) | 1.57 | 24.44 | 1.57 | 24.63 |
P1A–O4A | 1.70(3) | 17.04(9) | 1.57 | 24.34 | 1.58 | 24.51 |
P2B–O1B | 1.42(3) | 14.95(8) | 1.42 | 17.35 | 1.36 | 18.61 |
P2B–O2B | 1.30(3) | 11.90(8) | 1.27 | 12.80 | 1.28 | 12.49 |
P2B–O3B | 1.62(3) | 15.73(9) | 1.54 | 22.92 | 1.55 | 23.11 |
P2B–O4B | 1.67(3) | 18.23(10) | 1.58 | 25.45 | 1.59 | 25.64 |
O2A–C2A | 1.700(19) | −8.88(6) | 1.68 | −11.65 | 1.67 | −11.48 |
O2B–C2B | 1.676(19) | −8.21(6) | 1.68 | −11.37 | 1.68 | −11.52 |
O5A–C1A | 2.74(3) | −31.88(14) | 2.63 | −15.03 | 2.65 | −16.19 |
O6A–C1A | 2.60(3) | −31.43(13) | 2.55 | −19.18 | 2.52 | −17.90 |
O5B–C1B | 2.78(3) | −32.86(14) | 2.63 | −15.89 | 2.65 | −17.05 |
O6B–C1B | 2.58(3) | −30.96(13) | 2.54 | −19.06 | 2.52 | −17.97 |
Considering the ρc values, the general agreement between the experiment and theory is good. Certain discrepancies may be observed for the terminal P–O (P1A–O3A, –O4A, P2B–O3B and –O4B) and carboxylate C–O bonds, namely the experimental ρc values are slightly higher than the theoretical ones, but the differences are only slightly greater than the commonly accepted criterion of 3σ. In any case, as far as the three types of P–O bonds (i.e. the terminal ones, e.g. P–O2 or P–O3 in I; the hydroxyl P–OH like P–O1 in I; the ester P–OC like P–O4 in I) are concerned, the quantities obtained for the present compounds resemble the relevant values reported previously.43–45,48–52 The ester P–O bond in phosphoenolpyruvate (P–O4) is less populated (0.16 in e Å−3 terms of ρc) than in phosphoglycolate molecules (P1A–O2A and P2B–O2B). Contrary to that the ester C–O bonds are more populated in I, than in II, the difference being approximately 0.25 e Å−3. Out of other intramolecular bonds the carboxylate C–O ones merit a short comment. In I the carboxylic group is unionized –COOH, while in II these groups have lost their protons. Consequently, in I there is a difference of approximately 0.52 e Å−3 between the charge densities at the bcps of the formally double and single bonds (C1–O6 and C1–O5, respectively). This value locates between analogous differences for dihydrogen phosphoglycolate45 (0.41 e Å−3), trans-cinnamic acid47 (0.31 e Å−3), picolinic acid N-oxide53 (0.55 e Å−3) or coumarin-3-carboxylic acid47 (0.75 e Å−3). In II the C–O bonds are formally equal, with the bond order of 1.5. The different values of ρc result here from the influence of hydrogen bonds, namely atoms O6A and O6B are involved in strong H bonds, what brings about certain decrease of relevant charge density in comparison with ρc of C1A–O5A or C1B–O5B. All these quantities are within the range of the literature values.54,55
In the case of Laplacian the question of agreement between the experimental and theoretical values is less straightforward. First of all it may be said that all the experimental quantities found for the present compounds are in reasonable agreement with the Laplacians reported so far for related bonds. Smaller or greater discrepancies appear if one compares the experimental data with the theoretical ones. It has been noticed that experimental and theoretical Laplacians have a tendency to differ, particularly in the case of polar bonds56 and this is what may be observed in the present structures. In particular there is a good concurrence of both Laplacians for the C–C, CC and ester C–O (i.e. C2–O4 in I, C2A–O2A and C2B–O2B in II) bonds. Also for the P–Oe, P–OH and O–H ones the differences are not serious. The discrepancy for C–H and N–H is larger, but it should be taken into account that these bonds are characterized by rather large negative Laplacians, that means that a small modification of the charge distribution near the bcp may give rise to a significant change of ∇2ρc. Anyway, the experimental and theoretical quantities found for the present systems are consistent with the previously reported.56 The terminal P–O and carboxylic C–O bonds are therefore the most problematic. As it was previously commented in the literature (e.g. in the quoted paper) the difference results almost exclusively from the difference of Hessian eigenvalues associated with the eigenvectors parallel to the respective bonds (typically denoted as λ3); such is also our case (see ESI† for the details). To get a deeper insight into the nature of these discrepancies we have calculated profiles of experimental and theoretical (the cluster) electron density, ρ, and its Laplacian, ∇2ρ, along the P1A–O3A and C1A–O5A bonds; they are presented in Fig. 3 and 4.
It may be noticed that the shape of the experimental charge density is almost perfectly reproduced by the theoretical function for the P–O bond; in the case of C–O the agreement is somewhat worse. Approximately 0.2–0.4 Å from the oxygen atom there seems to be a local increase of ρexp − ρtheor; this is more evident in the P–O diagram. Its reason is not clear, but this feature illustrates slightly flatter experimental ρ near the minimum and steeper experimental ∇2ρ. The theoretical Laplacians, apart from being flatter, show similar shapes as the experimental ones. Large differences between both these functions at the bcps to a great extent reflect the fact that the critical points are located in the range of steep decrease of ∇2ρ.
Similar differences between the experimental and theoretical shapes of ρ and ∇2ρ have been recently reported for the N–N bond in pigment Yellow 110 molecule.57
The discussed discrepancies may in part ensue from simplified (single Slater) form of the deformation radial functions used for fitting the experimental charge densities.58
H2PEP− | HPG2−(A) | ||||
---|---|---|---|---|---|
Orbital(s)* | Occ. | Composition | Orbital(s) | Occ. | Composition |
a lp – lone pair, dlp – diagonal lone pair, tlp – transversal lone pair; see text for the explanation. | |||||
σ(P–O1) | 1.985 | 0.454P(sp3.64) + 0.891O1(sp1.86) | σ(P1A–O1A) | 1.984 | 0.452P1A(sp3.75) + 0.892O1A(sp1.77) |
σ(P–O2) | 1.979 | 0.510P(sp2.19) + 0.861O2(sp2.19) | σ(P1A–O3A) | 1.985 | 0.493P1A(sp2.46) + 0.868O3A(sp2.08) |
σ(P–O3) | 1.981 | 0.504P(sp2.35) + 0.864O3(sp2.18) | σ(P1A–O4A) | 1.984 | 0.498P1A(sp2.43) + 0.867O4A(sp2.10) |
σ(P–O4) | 1.954 | 0.441P(sp4.16) + 0.898O4(sp3.05) | σ(P1A–O2A) | 1.973 | 0.467P1A(sp3.36) + 0.884O2A(sp2.81) |
lp(O1) | 1.964 | sp1.34 | lp(O1A) | 1.968 | sp1.29 |
lp(O1) | 1.924 | p | lp(O1A) | 1.930 | p |
lp(O2) | 1.975 | sp0.46 | lp(O3A) | 1.975 | sp0.48 |
lp(O2) | 1.818 | p | lp(O3A) | 1.858 | p |
lp(O2) | 1.816 | p | lp(O3A) | 1.836 | p |
lp(O3) | 1.974 | sp0.46 | lp(O4A) | 1.974 | sp0.48 |
lp(O3) | 1.837 | p | lp(O4A) | 1.846 | p |
lp(O3) | 1.820 | p | lp(O4A) | 1.835 | p |
lp(O4) (dlp) | 1.933 | sp1.61 | lp(O2A) (dlp) | 1.944 | sp1.25 |
lp(O4) (tlp) | 1.832 | p | lp(O2A) (tlp) | 1.891 | p |
σ*(P–O1) | 0.220 | 0.891P(sp3.64) − 0.454O1(sp1.86) | σ*(P1A–O1A) | 0.208 | 0.892P1A(sp3.75) − 0.452O1A(sp1.77) |
σ*(P–O2) | 0.119 | 0.861P(sp2.19) − 0.510O2(sp2.19) | σ*(P1A–O3A) | 0.148 | 0.868P1A(sp2.46) − 0.493O3A(sp2.08) |
σ*(P–O3) | 0.143 | 0.864P(sp2.35) − 0.504O3(sp2.18) | σ*(P1A–O4A) | 0.144 | 0.867P1A(sp2.43) − 0.498O4A(sp2.10) |
σ*(P–O4) | 0.256 | 0.898P(sp4.16) − 0.441O4(sp3.05) | σ*(P1A–O2A) | 0.214 | 0.884P1A(sp3.36) − 0.467O2A(sp2.81) |
Inspection of Table 7 leads to the following observations:
1. The populations of the purely p lone pairs in the two terminal and the hydroxyl oxygen atoms are depleted in comparison to the spx pairs, as expected, because the former ones are oriented perpendicularly to the P–O bonds and therefore their interactions with the σ*(P–O) orbitals are more favored;
2. The populations of the p lone pairs in H2PEP− are systematically lower than populations of their analogues in HPG2−, indicating thus stronger donor–acceptor interactions in the former molecule;
3. The population of the ester σ*(P–O4) orbital in H2PEP− is distinctly higher than that of σ*(P1A–O2A) in HPG2− (in accord with previous findings for high-energy phosphates2).
4. The ester oxygen atom (O4 and O2A, respectively) has two lone pairs. The first one is oriented more or less along the diagonal of the C–O–P angle and for this reason will be hereinafter labelled as diagonal or dlp; its population is only slightly smaller than 2.0. The other pair is perpendicular to the COP plane and therefore will be identified as transversal or tlp; its population is reduced in a degree comparable to the other p orbitals of the terminal phosphate O atoms – more for H2PEP− than for HPG2−. A view of dlp and tlp for molecule A from II is shown in Fig. 5.
It has been suggested that there is a positive correlation between the length of this bond and the free energy of hydrolysis. We have tried to correlate both these quantities over the set of the 15 molecules specified above and the result is presented in Fig. 6.
The ester P–O bond length is somewhat less correlated with ΔEh for the present data than it was reported previously by Ruben et al.2 for a set of 10 molecules, for which the correlation coefficient between d(P–O) and −ΔG of hydrolysis was 0.88 (N.B. throughout this paper we take the hydrolysis energy as the difference between the bonding energies of substrates minus the energies of products, i.e. as the quantity related to the phosphorylation potential,62 therefore we have changed the sign of R accordingly). Inspection of the diagram presented in Fig. 6 reveals that there are two types of molecules departing from the general trend. Those in which the C atom bonded to the phosphate group is involved in a double bond (anions 1, 2, 4, 6) are located above the regression line, whereas the trihalogenomethyl phosphates (13, 14, 15) are underneath. Generally saying, four separate subgroups of compounds i.e. monohalides, trihalides, compounds with alkyl ester C atom and those with a double bond in the vicinity of the ester C atom can be discerned in the diagram.
The moderate correlation, illustrated in Fig. 6, indicates that the P–Oe bond length and the energy of hydrolysis are influenced by a somewhat different set of factors. On the other hand there is a very strong correlation between P–Oe bond length and the population or the energy of the σ*(P–Oe), as evidenced by the respective R factors of 0.995 and −0.999, what is in turn in good accordance with the results reported by Ruben et al. (0.98 and −0.99, respectively).
Accordingly, these authors argued that the donation from the terminal phosphate oxygen lone pairs to the σ*(P–Oe) orbitals – the so called generalized anomeric effect – should play a prevalent role in the scale of P–O bond lengthening or weakening. However, in the course of our investigation we have found a similarly strong correlation of P–O bond lengths with the orbital energy of the ester O atom transversal lone pair, tlp (R = −0.955). Assuming that the observed and calculated differences must originate from the chemical character and constitution of the residue bonded to the phosphate group (as within the latter there seems to rest no apparent reason to bring about variation of these bonds), we have decided to focus on the ester O atom and its interactions.
Indeed, a chain of correlations leading from the interactions of tlp with the ester C atom and its neighbourhood to the P–Oe distance can be drawn. A diagram of such correlations, showing a proposed logical sequence of factors, is presented in Chart 1. Interactions of lone pairs with empty antibonding orbitals are quantified here as the second order perturbation energy21,22 calculated as
![]() | (1) |
The following interactions should be commented, when analyzing the presented chart:
(a) Interaction of the occupied orbital with an adjacent empty one (e.g. step 1 → 2 in the diagram). This leads to lowering of the energy of the occupied orbital. This should appear, in principle, as a result of the perturbations described above, but it should be kept in mind that the NBO orbitals are retrieved from the canonical DFT ones that have already included this effect.
(b) There may be a logically inverse relation: lowering of the energy of a considered orbital leads to weakening of its interactions with neighboring empty antibonding ones (step 2 → 3).
(c) Interaction of a lone pair located on A with σ*(B–C) leads to strengthening of the bond A–B (the case of 3 → 4 or 6 → 7 → 8) and to
(d) weakening of B–C (7 → 4).
To illustrate the donor–acceptor interactions referred to in p. (c) an exemplary overlapping of tlp with the π*(CO) and one of the σ*(P–Ot) orbitals in the molecule of hydrogen acetyl phosphate (1) is shown in Fig. 7.
It results from Chart 1 that interactions of the transversal lone pair of Oe with the ester carbon atom and its neighborhood may be regarded as the main factor shaping the P–Oe bond. As these interactions manifestly grow when low lying (in terms of energy) antibonding orbitals, such as π* or σ*(C–Br, Cl, F) are available (see Table 8), it may be noticed that the molecules with a double bond by the ester C atom, as well as the trihalogenomethyl phosphates, have the longest P–Oe bonds (the detailed values may be found in the ESI†). It may be also noticed that a few steps are needed to connect tlp-C interactions [expressed as the sum of second order perturbation energies, ∑E(2)(tlp-C)] with the length of the P–Oe bond and for this reason the correlation between these two parameters is somewhat blurred: the 1–4 correlation coefficient is 0.849; see Fig. 8 for the ∑E(2)(tlp-C)–d(P–Oe) diagram. The analogical correlation concerning the C–Oe bond is stronger – −0.913, what results from more direct connection between the C–Oe distance and ∑E(2)(tlp-C); see Chart 1. Loops 4 → 3 → 4 and 4 → 5 → 6 → 7 → 4 provide additional feedback that strengthens the bond elongation.
Number from Scheme 1 | R– | ∑ΔE(2)(tlp-C) (kcal mol−1) | ΔEh (kcal mol−1) |
---|---|---|---|
6 | CH3–C(![]() |
46.08 | 7.5 |
2 | CH3–C(![]() |
43.75 | 7.7 |
15 | CBr3– | 40.38 | 6.4 |
14 | CCl3– | 35.77 | 5.0 |
13 | CF3– | 33.30 | 4.1 |
1 | HOOC–C(![]() |
31.69 | 4.0 |
4 | CH3–CH2–C(![]() |
28.70 | 5.2 |
12 | CBrH2– | 25.00 | 3.8 |
10 | CFH2– | 21.56 | 2.9 |
11 | CClH2– | 21.31 | 3.5 |
8 | HOOC–CH2– | 12.09 | 1.5 |
5 | CH2![]() |
10.46 | 1.9 |
9 | CH3– | 10.37 | 0.9 |
7 | CH2OH–CHOH–CH2– | 10.21 | 1.6 |
3 | Glucose-6-O-yl- | 9.75 | 2.0 |
![]() | ||
Fig. 8 Correlation between the sum of the second order perturbation energies, ∑E(2)(tlp-C), and the P–Oe bond lengths. The colors show the subgroups as in Fig. 6. For the purpose of interpretation the ∑E(2) may be treated as the reason, and P–Oe length as a consequence. Likewise, in following figures the quantities shown in the x axes may be treated as causes, as only they may be reasonably interpreted as such. |
In the case of the other lone pair of Oe it is not possible to draft a similar diagram. For instance, the correlation coefficient between the second order interactions of dlp with the organic moiety and the energy of this orbital (analogously to the step 1 → 2) is −0.296; the next step, equivalent to 2 → 3 gives R = −0.203 and so on. On the other hand, these interactions are strongly correlated with the C–Oe length (R = −0.908); this means that the parameters of dlp merely reflect shortening or lengthening of this bond and the orbital does not take essential part in the interplay of the organic moiety with the phosphate group.
Also the charge of the ester carbon atom does not seem to influence the P–Oe distance; the correlation coefficient between P–Oe and the Bader charge of C, QB, is 0.528. The multiple correlation coefficient, obtained from linear regression of P–Oe as a function of both ∑E(2)(tlp-C) and QB, is 0.876 – this means that the carbon charge does not affect the P–Oe bond length effectively.
Another factor, namely the steric interactions, merits analysis. In the NBO approach there are two ways of description of these interactions. The first consists in calculating the difference between the energies of orthogonalized and pre-orthogonalized natural localized molecular orbitals (NLMO) and the other – in calculating repulsions between pairs of disjoint orbitals.22 The correlation obtained by fitting the P–Oe distance as a function of ∑E(2)(tlp-C) and the steric repulsion is strong – 0.971 when using the first approach. The other method allows to separate the repulsions between various fragments of the molecule. In this way it may be found (see details in the ESI†) that the correlation is improved the most by the tlp-organic part repulsions (R = 0.944). Taking this into account and noting that the coefficient by the steric repulsion energies in the regression equation is positive, we are inclined to think that these interactions are not actually an independent factor that might influence the P–Oe distance (in such a case the coefficients should be negative reflecting thus a kind of braking force that would act oppositely to the tlp-C attraction), but they merely reflect lengthening or shortening of the C–Oe bond.
Eventually we have decided to consider the interaction of σ(P–Oe) with the organic part. Such an interaction would lead to creation of an additional weak bonding effect along C–Oe at the cost of the strength of the P–Oe bond. The values of ∑E(2)[σ(P–Oe)–C] are generally lower than ∑E(2)(tlp-C) and range between 2.8 and 4.2 kcal mol−1 for compounds with aliphatic ester C, 4.0 and 6.3 kcal mol−1 for monohalogenomethyl phosphates, 5.3 and 9.9 kcal mol−1 for esters with a double bond at the ester C atom and between 11.5 and 16.8 kcal mol−1 for trihalogenomethyl phosphates. These quantities are much lower than ∑E(2)(tlp-C), which are between 9.8 and 46.1 kcal mol−1 (see ESI† for the details), but nevertheless the values for CX3PO3H− (X = F, Cl, Br) may play some role in shaping the P–Oe bond. Interestingly, the coefficient of correlation between d(P–Oe) and ∑E(2)[σ(P–Oe)–C] is 0.954. Low values, however, of these interactions seem to suggest that they essentially mirror stronger interplay of tlps with the organic parts; only in the case of CX3PO3H− they may exert considerable influence. This conclusion may be supported by the values of the R(∑E(2)(tlp-C), ∑E(2)[σ(P–Oe)–C]) correlation coefficient: 0.776 for all 15 molecules and 0.919 after exclusion of trihalogenomethyl phosphates. An examplary interaction of the σ(P–Oe) with a σ*(C–Br) in CBr3PO3H− is illustrated in Fig. 9.
Taking all these regards into account it must be said that the multiple regression of d(P–Oe) against both ∑E(2)(tlp-C) and ∑E(2)[σ(P–Oe)–C] gives a rather strong correlation coefficient, R = 0.970. The regression of d(P–Oe) against ∑E(2)(tlp-C) and ∑E(2)[σ(P–Oe)–C] is shown in Fig. 10.
![]() | ||
Fig. 10 Relation between the P–Oe bond lengths calculated from regression against ∑E(2)(tlp-C) and ∑E(2)[σ(P–Oe)–C] and those obtained from DFT. The regression equation is: d(P–Oe) = 0.0008(4)∑E(2)(tlp-C) + 0.0069(11)∑E(2)[σ(P–Oe)–C] + 1.6119(59)‡ and the energies are in kcal mol−1. |
Similar reasoning may be drawn for C–Oe; in this case also the interaction of dlp with the organic part should be taken into account. As this interaction is strongly correlated with the interaction of σ(P–Oe)–organic part (the respective R = 0.970) both quantities may be treated jointly and the auxiliary interactions may be thus represented as the sum, ∑E(2)(aux) = ∑E(2)[σ(P–Oe)–C] + ∑E(2)(dlp-C)]. The correlation coefficients of interest are: R[d(C–Oe), ∑E(2)(tlp-C)] = −0.913, R[d(C–Oe), ∑E(2)(aux)] = −0.904, R[∑E(2)(tlp-C), ∑E(2)(aux)] = 0.805 and the correlation coefficient between the DFT data and the values obtained from the multiple regression against ∑E(2)(tlp-C) and ∑E(2)(aux) is 0.956. The regression results are shown in Fig. 11.
This relation manifestly shows that the energy of hydrolysis is basically predetermined by the chemical constitution of the organic moiety; Table 7 presents the studied esters, ordered in descending order of magnitude of the tlp-organic moiety interactions. Inspection of this table reveals that the presence of low energy π* or σ* antibonding orbitals increases ΔEh; only the former factor seems to be of interest for the biochemical systems.
Another issue arises here, namely, whether the hydrolysis energy may be somehow localized. This question perhaps should not be understood too literally, but nevertheless it would be appealing to identify orbitals which may contribute to release of this energy. In technical terms it means that a correlation of ΔEh with the differences of the energies of the respective orbitals before and after the hydrolysis is sought. In the following discussion the quantities before hydrolysis will be labelled as pre and those after – as post. We have analyzed the following energies: energy of tlp [E(tlp)], energy of dlp [E(dlp)], total interaction of tlp or dlp with the organic fragment [∑E(2)(tlp-C) or ∑E(2)(dlp-C), respectively], steric repulsion energies of tlp or dlp [Est(tlp) or Est(tlp)], energy of σ(C–Oe) [symbolized as E(CO)], energy of σ(P–Oe) [E(PO)] and that of σ*(P–Oe). The post-hydrolytic energies (as well as the populations) of the two last orbitals were taken as averages of the respective quantities of the two P–O(H) bonds of the H2PO4− anion. All the considered energy differences were weighted with the populations of the involved orbitals, according to the scheme: ΔE = PpreEpre − PpostEpost, where P and E denote the applicable population and energy (in the case of Δ∑E(2) the populations were halved).
The hydrolysis energy is correlated the most with the difference connected with dlp, Δ∑E(2)(dlp-C) (R = 0.852), but the chemical sense of such correlation may be difficult to interpret. For this reason we have decided to leave the Δ∑E(2) parameters aside. In this way the best regression was obtained with three variables: ΔE(dlp), ΔE(PO) and ΔE(CO). The equation has the form (in kcal mol−1):
ΔEh = 0.119(11)ΔE(dlp) + 0.077(11)ΔE(PO) + 0.125(23)ΔE(CO) − 3.75(65) | (2) |
![]() | ||
Fig. 13 Correlation of the hydrolysis energies (ΔE) obtained from DFT and from linear regression with ΔE(dlp), ΔE(PO) and ΔE(CO) as the explanatory variables. |
When analyzing eqn (2) it may be noticed that the relative contribution of dlp to ΔEh, calculated as 0.119ΔE(dlp) is regularly greater than the share of σ(P–Oe) [computed as 0.077ΔE(PO)]. The ratio 0.119ΔE(dlp)/0.077ΔE(PO) is e.g. 6.0 for 4, 3.5 for H2PEP (1), 2.8 for acetyl phosphate (2) and so on; only for trihalogenomethyl phosphates drops below 1.0. It may be therefore concluded that for most of the compounds majority of the hydrolysis energy is, in a sense, stored at dlp.
ΔEh = 189(23)ρc(C–Oe) + 40.5(64)∇2ρc(P–Oe) + 3.9(10)QB(C) − 26(3); | (3) |
ΔEh = 28.1(34)ρc(C–Oe) + 1.68(27)∇2ρc(P–Oe) + 3.9(10)QB(C) − 26(3). | (4) |
![]() | ||
Fig. 14 Correlation of the hydrolysis energy obtained from DFT and from linear regression against ρc(C–Oe), ∇2ρc(C–Oe) and QB(C). |
However, a practical application of this equation may be limited, what can be shown when ΔEh of the two compounds studied experimentally in this work are calculated. Using the parameters obtained from the multipole refinement one gets 4.4 kcal mol−1 for H2PEP−, what is quite a reasonable result. On the contrary, ΔEh calculated for molecules A and B of PGH2− is 7.3 and 7.6 kcal mol−1 and it may be easily checked that such a large difference between the fitting and the DFT calculations results mainly from the difference between the experimental and theoretical values of the Laplacian in the critical point of the C–Oe bond. It seems, thus, that the precise determination of the Laplacian is crucial for realistic assessment of ΔEh. Unfortunately, this is not always possible, as it has been discussed above (in the Topology section). Omitting ∇2ρc(C–Oe) yields a relation with R = 0.757. However, exclusion of the molecules with a double bond attached to the ester C atom greatly improves the regression results (R = 0.958; see Fig. 15).
![]() | ||
Fig. 15 Correlation of the hydrolysis energy obtained from DFT and from linear regression against ρ(C–Oe) and QB(C) after elimination molecules with a double bond at the ester carbon atom. |
The regression equation in this case is:
ΔEh = −1.39(47)QB(C) + 50.0(59)ρ(C–Oe) − 9.8(15) | (5a) |
ΔEh = −1.39(47)QB(C) + 7.41(88)ρ(C–Oe) − 9.8(15) | (5b) |
The energy of hydrolysis, calculated from this relation is 2.6 and 2.5 kcal mol−1 for phosphoglycolate molecules A and B, respectively.
Finally, it should be emphasized that the relations derived in this paragraph concern the mono-ionized phosphate esters. The question of whether and how the eqn (3)–(5) may be modified for phosphates at other ionization degrees needs a more extensive study.
Interaction of tlp with the organic part leads to depopulation of the pair, partial transfer of its electrons onto adjacent antibonding orbitals and in consequence to creation of additional bonding effect along the C–Oe bond. This effect is particularly strong if the energies of the available acceptor antibonding orbitals are low; this is the case of the π* and low lying σ*(C–X) orbitals (X = F, Cl, Br). This, in turn, results in shortening of the C–Oe bond in the trihalogenomethyl phosphates and in the molecules with the ester C atom involved in a double bond.
Additional donor interactions of σ(P–Oe) with the organic fragment also affect the lengths of the P–Oe and C–Oe bonds in the studied compounds; the latter bond seems to be affected by C-dlp interactions too. On the contrary, the hydrolysis energy depends almost exclusively on the tlp-C interactions; moreover it is proportional to them. For these reasons the P–Oe bond length shows only approximate relation to the hydrolysis energy.
The energy release during the hydrolysis is due to scission of the ester P–O bond and consecutive rearrangement of the molecular and electronic structure of the products. It has been attempted in this work to find whether it is possible to attribute the energy liberation to particular regions of the ester. The regression analysis suggests that there are three orbitals that chiefly contribute to the energy production; they are: dlp, σ(P–Oe) and σ(C–Oe). Two first ones experience stabilisation upon hydrolysis and therefore can be considered as those that release the energy, while the last one undergoes destabilisation at the cost of a part of the energy liberated by the former orbitals. Accordingly, the net ΔEh is the relevant difference. Analysis of the regression equation suggests that dlp, although not taking a leading part in the interplay of the phosphate group with the organic moiety, may be treated as the major storage place of the hydrolysis energy, especially in the case of high energy phosphates with the double bond at the ester C atom.
This work presents analysis of the role of the donor–acceptor interactions of the ester oxygen lone pairs in determining the electronic and geometric structure as well as the thermodynamics of phosphate esters. Previously evidence of Kirby et al. indicated that the kinetics and scissile bond lengthening are strongly dependent on the effective electronegativity of the organic substituent, expressed as pKa of the corresponding alcohol. We have come to the conclusion, that this effective electronegativity, or electron withdrawal force can be identified with the sum of the donor–acceptor interaction energies of tlp with the organic fragment of the ester.
Thus, following Kirby et al.15–17 it may be inferred that in systems where strong delocalizing effects between tlp and organic parts exists, addition of a phosphate moiety is energetically less favourable, due to a high level of involvement of tlp in interactions with the organic part, and phosphate molecules thus formed experience greater destabilization with respect to the hydrolysis products.
We have also shown that, taking some precautions, especially connected with the divergent values of the experimental and theoretical Laplacians at the C–Oe bond critical point in some compounds, it is possible to estimate the hydrolysis energy from the topological parameters retrieved from the experimental charge density map.
Footnotes |
† Electronic supplementary information (ESI) available: Parameters of the Slater deformation functions used in the multipole refinements, complete list of atom charges, full lists of topological parameters, results of the DFT calculations and regressions of the P–Oe distances obtained by inclusion of steric repulsion. CCDC 1403706 and 1403707. For ESI and crystallographic data in CIF or other electronic format see DOI: 10.1039/c5ra12605c |
‡ In this and the following regression equations the estimated standard errors are given in parentheses and its order is the order of the last digit of the relevant estimated quantity, e.g. 1.6119(59) means that the e.s.d = 0.0059. A short comment on the statistical aspects of the regression analyses presented in this paper is given in the ESI.† |
This journal is © The Royal Society of Chemistry 2015 |