DOI:
10.1039/C5RA12547B
(Paper)
RSC Adv., 2015,
5, 78336-78351
Simultaneous determination of vasicine and its major metabolites in rat plasma by UPLC-MS/MS and its application to in vivo pharmacokinetic studies
Received
29th June 2015
, Accepted 8th September 2015
First published on 10th September 2015
Abstract
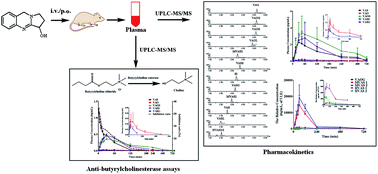
An efficient and sensitive ultra-performance liquid chromatography-tandem mass spectrometry method has been developed and validated to simultaneously determine and quantify vasicine (VAS) and its major metabolites including vasicinone (VAO), 9-oxo-1,2,3,9-tetrahydropyrrolo[2,1-b]quinazolin-3-yl hydrogen sulfate (VAOS), 1,2,3,9-tetrahydro-pyrrolo[2,1-b]quinazolin-3-yl hydrogen sulfate (VASS), 1,2,3,9-tetrahydropyrrolo[2,1-b]quinazolin-3-β-D-glucuronide (VASG), vasicinol (VASL) and vasicinolone (VAOL) using pseudoephedrine as the internal standard in rat plasma. The chromatographic separation was conducted on a HSS T3 column (100 mm × 2.1 mm, 1.8 μm) with the gradient elution using a mobile phase of methanol–0.1% formic acid in water at a flow rate of 0.4 mL min−1 for 7 min. The tandem mass spectrometric detection was conducted using multiple reaction monitoring (MRM) by positive electrospray ionization (ESI). The corresponding lower limits of quantitation (LLOQ) of the method were 0.73, 0.80, 0.75, 0.80, 0.82, 0.87, 0.82 ng mL−1 for VAO, VAOS, VASS, VASG, VAS, VASL and VAOL, respectively. The within- and between-run precision for all analytes were less than 7.66% and 12.30%, respectively. The recovery for all analytes was between 85.89% and 114.58%, and the matrix effects for all analytes were not observed. By the UPLC-MS/MS method, the relative quantitation of five metabolites of 9-oxo-1,2,3,9-tetrahydropyrrolo[2,1-b]quinazolin-3-β-D-glucuronide (VAOG), hydroxylation–acetylation products of VAS (HVAS1 and HVAS2) and methylation–acetylation products of VAS (MVAS1 and MVAS2) were achieved by standard curves derived from the urine sample with treatment by VAS as a reference substance, in which the considerable target metabolites were included. This method was successfully applied to pharmacokinetic studies of VAS and its metabolites in rats. The activity of the components in plasma after intravenous administration of VAS (2 mg kg−1) was evaluated by in vitro anti-butyrylcholinesterase assays. The results indicated that in vivo butyrylcholinesterase inhibitive activities were mainly due to the different concentrations of prototype VAS and a few other metabolites.
1. Introduction
Vasicine (VAS), a potential natural cholinesterase inhibitor, exhibited promising anticholinesterase activity in preclinical models and was investigated for the treatment of Alzheimer's disease.1–3 It is also reported to show bronchodilatory, respiratory stimulant and uterine stimulant effects.4–6 VAS can be absorbed quickly by the gastrointestinal tract with a first-pass effect, reaching the maximum plasma concentration (Cmax) at 0.5–1 h with a low oral bioavailability.7,8 Our previous study found that VAS can be extensively metabolized in rats via the oxidative and conjugative pathways, and a total of 72 metabolites were detected based on a detailed analysis of their 1H and 13C NMR data.9 Among the 25 metabolites found in rat plasma, six key metabolites were isolated from rat urine and elucidated as vasicinone (VAO), vasicinol (VASL), vasicinolone (VAOL), 1,2,3,9-tetrahydropyrrolo[2,1-b]quinazolin-3-yl hydrogen sulfate (VASS), 9-oxo-1,2,3,9-tetrahydropyrrolo[2,1-b]quinazolin-3-yl hydrogen sulfate (VAOS), and 1,2,3,9-tetrahydropyrrolo[2,1-b]quinazolin-3-β-D-glucuronide (VASG) (structures are shown in Fig. 1). The acetylcholinesterase (AChE) and butyrylcholinesterase (BChE) inhibitory activities of VAS and its major metabolites were also evaluated in vitro, indicating that most metabolites maintained potential inhibitory activity against AChE and BChE, but weaker than that of VAS. These results implied that VAS undergoes metabolic inactivation process in vivo in respect to cholinesterase inhibitory activity.9 However, no reports are currently published addressing the in vivo studies on the pharmacokinetics and pharmacodynamics of VAS and its metabolites, which are essential for the development of VAS as an anti cholinesterase agent.
 |
| Fig. 1 The chemical structures of pseudoephedrine (PSH, IS), vasicine (VAS) and its eleven metabolites vasicinone (VAO), vasicinolone (VAOL), 9-oxo-1,2,3,9-tetrahydropyrrolo[2,1-b]quinazolin-3-yl hydrogen sulfate (VAOS), 9-oxo-1,2,3,9-tetrahydropyrrolo[2,1-b]quinazolin-3-β-D-glucuronide (VAOG), 1,2,3,9-tetrahydropyrrolo[2,1-b]quinazolin-3-yl hydrogen sulfate (VASS), vasicinol (VASL), 1,2,3,9-tetrahydropyrrolo[2,1-b]quinazolin-3-β-D-glucuronide (VASG), hydroxylation–acetylation of VAS (HVAS1 and HVAS2), methylation–acetylation of VAS (MVAS1 and MVAS2). | |
Different analytical techniques have been described for the qualitative and quantitative determination of VAS in various biological specimens, including high-performance thin layer chromatography,10–12 high performance capillary electrophoresis,13 high performance liquid chromatography (HPLC),14 and ultra-performance liquid chromatography/quadrupole time of flight mass-spectrometry (UPLC/Q-TOF MS).15 However, none of these reported methods was optimized to simultaneously quantify the mixture of VAS and its metabolites in biological samples. In the meanwhile, the lower limit of quantitation (LLOQ) for the analysis method has to be low enough to sufficiently quantify the major metabolites of VAS in the in vivo pharmacokinetic studies. Ultra-performance chromatography-tandem mass spectrometry (UPLC-MS/MS) proves to be a feasible alternative due to fast separation and detection performance. Moreover, UPLC-MS/MS has been extensively applied in the bioanalysis and pharmacokinetic studies of numerous drugs.3,16
In the present study, a sensitive and selective UPLC-MS/MS method is developed and validated with satisfying LLOQ and wide linear range. The validated method is then applied to study the pharmacokinetic profiling of VAS and its metabolites in rat models after intravenously and oral administration of VAS. In addition, the inhibitory activity against BChE of the components in rat plasma after the i.v. treatment of 2 mg kg−1 VAS was also evaluated by in vitro anti-BChE assays, providing valuable functional information of VAS and its metabolites for their further development as new drug candidates.
2. Material and methods
2.1. Materials
VAS and VAO were isolated from Peganum harmala L. and VASL, VAOL, VASS, VAOS, VASG (purity > 98%) were obtained from rat urine after oral administration of VAS according to a previously reported method.9 Pseudoephedrine hydrochloride (PSH) was provided by Xinjiang Tianshan Mountains Pharmaceutical Factory (Urumqi, China). BChE from equine serum, AChE from Electrophorus electricus, chlormequat chloride, acetylcholine (ACh) chloride, butyrocholine (BCh) and chloride, choline (Ch) chloride were obtained from Sigma Aldrich Co. (St. Louis, MO, USA). HPLC grade acetonitrile and methanol were purchased from Fisher Scientific Co. (Santa Clara, USA). 96% Formic acid of HPLC grade was purchased from Tedia Co. (Fairfield, USA). HPLC grade water was obtained by a Milli-Q Academic System (Millipore, Billerica, MA).
2.2. Animals and ethics statement
Sprague-Dawley rats (male and female, 200–250 g) were provided by the Experimental Animal Center of Shanghai University of Traditional Chinese Medicine (Permit Number: SCXK (Hu) 2013-0016). The animals were housed with free access to food and water and maintained on a 12 h light and dark cycle (lights on from 7:00 to 19:00) at environmental temperature (22 °C to 24 °C) and 60% to 65% relative humidity for seven days. Before the experiments, all rats were fasted for 12 h with free access to water. Animal maintenance and experiments were approved by the Animal Care and Use Committee of Shanghai University of Traditional Chinese Medicine (Approval Number: ACSHU-2011-G115) and guide for the Care and Use of Laboratory Animals of the National Institutes of Health.
2.3. Apparatus and operation conditions
2.3.1. Liquid chromatography. The separation was performed on a Waters-ACQUITY™ UPLC system (Waters Corp., Milford, MA, USA) using an ACQUITY UPLC HSS T3 column (2.1 mm × 100 mm, 1.8 μm). The column was eluted with a gradient mobile phase of methanol (A) and 0.1% formic acid in deionized water (B): 0–1 min, linear from 5% to 10% A; 1–1.5 min, linear from 10% to 13% A; 1.5–2.7 min 13% A; 2.7–3.7 min, linear from 13% to 19% A; 3.7–4.0 min 19% A; 4.0–4.2 min, linear from 19% to 45% A; 4.2–5 min 45% A; 5.0–6.0 min 90% A; and 6.0–7.0 min 5% A. The flow rate was 0.4 mL min−1. The column and sample-tray temperatures were maintained at 40 °C and 10 °C, respectively. The injection volume was 5 μL using a partial loop with needle overfill mode.
2.3.2. Mass spectrometric conditions. A Micromass Quattro Premier XE tandem quadruple mass spectrometer (Waters, Manchester, UK) equipped with an electrospray ionization (ESI) interface was used for quantification. The mass spectrometer was operated in positive ionization mode by using multiple reaction monitoring (MRM). The main working parameters were set as follows: capillary voltage, 3.00 kV; extractor voltage, 3.00 V; source temperature, 120 °C; desolvation temperature, 400 °C; desolvation gas flow, 800 L h−1 (N2); cone gas flow, 50 L h−1. Nitrogen (99.9% purity) and argon (99.999% purity) were used as cone and collision gases, respectively. Precursor–product ion transition of VAS, its metabolites and PSH were shown in Fig. 2. MRM transitions voltages, the individual cone voltages and collision energy voltages were summarized in Table 1. The inter-channel delay and the inter-scan delay were both set at 0.1 s. Data acquisition was carried out on MassLynx 4.1 software.
 |
| Fig. 2 Precursor–product ion transition of PSH, VAS, and its eleven metabolites VAO, VAOL, VAOS, VAOG, VASS, VASL, VASG, HVAS1, HVAS2, MVAS1 and MVAS2. | |
Table 1 MS/MS conditions for multiple reaction monitoring of analytesa
Analytes |
Ion Mode |
Parent |
Daughter |
Dwell (s) |
Cone energy (V) |
Collision energy (V) |
HVAS1 and 2: hydroxylation–acetylation of VAS; VASL: vasicinol; VAS: vasicine; MVAS1: methylation–acetylation of VAS 1; VASG: 1,2,3,9-tetrahydropyrrolo[2,1-b]quinazolin-3-β-D-glucuronide; VASS: 1,2,3,9-tetrahydropyrrolo[2,1-b]quinazolin-3-yl hydrogen sulfate; MVAS2: methylation of VAS 2; VAOL: vasicinolone; VAOS: 9-oxo-1,2,3,9-tetrahydropyrrolo[2,1-b]quinazolin-3-yl hydrogen sulfate; VAOG: 9-oxo-1,2,3,9-tetrahydropyrrolo[2,1-b]quinazolin-3-β-D-glucuronide; VAO: vasicinone; PSH: pseudoephedrine hydrochloride (internal standard). |
HVAS1 and 2 |
Positive |
247.1 |
187.1 |
0.15 |
25 |
15 |
VASL |
Positive |
205.1 |
133.8 |
0.05 |
30 |
25 |
VAS |
Positive |
189.1 |
117.9 |
0.15 |
35 |
25 |
MVAS1 |
Positive |
245.1 |
187.1 |
0.05 |
35 |
15 |
VASG |
Positive |
365.3 |
189.1 |
0.05 |
45 |
25 |
VASS |
Positive |
269.1 |
189.1 |
0.05 |
35 |
20 |
MVAS2 |
Positive |
245.1 |
187.1 |
0.05 |
45 |
20 |
VAOL |
Positive |
219.1 |
201.1 |
0.05 |
35 |
20 |
VAOS |
Positive |
283.1 |
185.1 |
0.05 |
40 |
25 |
VAOG |
Positive |
379.1 |
203.1 |
0.05 |
35 |
20 |
VAO |
Positive |
203.1 |
185.1 |
0.05 |
30 |
20 |
PSH (IS) |
Positive |
166.1 |
148.1 |
0.05 |
20 |
10 |
2.4. Stock solutions, standards samples, and quality control samples
Stock solutions of VAS, VASS, VASG, VAO, VAOS, VASL, VAOL with a concentration of 100.0, 182.0, 99.2, 177.2, 98.0, 106.0, 100.0 μg mL−1 were prepared by dissolving proper amount of each standard substance in 25 mL of methanol, respectively. A mixture solution contained these seven standards was obtained and serially diluted with the initial mobile phase (5% methanol containing 0.1% formic acid) to provide working solutions of desired concentrations for calibration standards (CS) and quality control (QC). Stock solution of PSH (internal standard, IS) with a concentration of 181.6 μg mL−1 was prepared by dissolving proper amount of standard substance in 25 mL of methanol. Its working solution (0.036 μg mL−1) was prepared by diluting the stock solutions in acetonitrile. All of the solutions were stored at 4 °C and brought to room temperature before use.
2.5. Sample preparation
For CS and QC samples, 50 μL CS or QC working solutions were added to 50 μL of blank plasma, followed by the addition of 50 μL IS working solution and 250 μL of acetonitrile. For unknown samples, 50 μL of plasma was spiked with 50 μL IS solution and 300 μL of acetonitrile. The mixtures were vortexed for 30 s and centrifuged at 15
000 × g for 10 min at 4 °C. The supernatant (320 μL) was evaporated to dryness by a gentle stream of nitrogen (37 °C). The residues were dissolved by 80 μL of initial mobile phase and centrifuged at 15
000 × g for 5 min. The supernatants (5 μL) were applied to the UPLC-MS/MS analysis.
2.6. Full bioanalytical method validation
Following the FDA guidance for industry,17 the bioanalytical method was fully validated.
2.6.1. Selectivity and carry-over. The selectivity was evaluated by comparing the MRM chromatograms of blank plasma with IS-spiked plasma samples after p.o. and i.v. treatment of VAS, respectively. Carry-over test was performed in triplicate by injecting a blank crude preparation sample extract followed by immediate injection of an extract of sample from the upper limit of standard curve (ULOQ, 500 ng mL−1) along with IS. Peak area in blank sample injected after ULOQ calibrator had to be below 20% of the peak area of the LLOQ calibrator for standard compounds, and below 5% for IS.
2.6.2. Linearity and limits of quantitation. Eight CS working solutions were prepared in five replicates of each concentration and the calibration curve was plotted as the peak area ratio (analyte/IS, y) versus the analyte concentration (x). LLOQ is defined as the lowest concentration giving a signal-to-noise ratio of at least 10-fold and on the calibration curve with an acceptable accuracy (RE, within ±20%) and precision (CV, below 20%).
2.6.3. Within-run and between-run precision. Precision was assessed by analyzing the replicates of QC samples (n = 5) at five concentrations (cal. 0.82, 12.80, 80.00, 200.00 and 500 ng mL−1). The within-run precision was evaluated by repeating the analysis of the standard five times during a single analytical run, and the between-run precision was determined by repeating the analysis of the standard five times during three consecutive days with five analytical run. The coefficient of variation (CV) of within-run and between-run precision was calculated from the observed concentrations (Cobs) as following equation: %CV = [standard deviation (SD)/Cobs] × 100. The relative error (RE) of within-run and between-run precision was calculated from observed concentrations (Cobs) and theoretical concentrations (Cthe) as following equation: %RE = [(Cobs − Cthe)/Cthe] × 100.
2.6.4. Extraction yield and matrix effects. The extraction yield of the assay was expressed by the recovery rate of QC samples at three concentrations (cal. 0.82, 80.00 and 500 ng mL−1). The samples were prepared as described above. The apparent concentrations were calculated by calibration curves, and the recovery was determined as the ratio of the concentration measured versus the concentration added into the sample. The recovery rate (%) was calculated from the mean value of the observed concentration (Cobs) and the theoretical concentration (Cthe) by following equation: % = [Cobs/Cthe] × 100.The effect of rat plasma constituents on the ionization of VAS, VASS, VASG, VAO, VAOS, VASL, VAOL and IS was determined by comparing the MRM peak responses of the pretreatment plasma standard QC samples mixed with rat plasma (A, n = 5) to those of the corresponding analytes in the initial mobile phase (B, n = 5). Whereas the matrix effect of the IS was determined at a single concentration of 0.018 μg mL−1 in five replicates. The value mean (A)/mean (B) × 100% was considered as the matrix effect. The matrix effect is implied if the ratio is less than 85% or more than 115%.
2.6.5. Dilution test. In order to assess the reliability of the method at concentration levels outside the calibration range, ten replicates of QC samples at 2500 ng mL−1 were prepared. Five were diluted at 1/10 with blank rat plasma and five at 1/100 with blank rat plasma. Following the FDA guidance for industry,17 the mean concentration and the imprecision (CV%) and the inaccuracy (RE%) were calculated for each dilution factor. The imprecision (CV%) had not to exceed 15%, and the inaccuracy (RE%) had to be within ±15% of the nominal value. Imprecision are expressed by the CV (%) on results tables, and inaccuracy as the mean percentage of error RE% with regard to the theoretical (or nominal) values.
2.6.6. Biological sample stability. Biological sample stability studies were conducted on QC samples at three concentration levels (cal. 0.82, 80.00 and 500 ng mL−1) with five replicates. Samples were stored for 24 h at ambient temperature (AT, 25 ± 2 °C), for three days at 4 °C, for one month at −20 °C and were submitted to three freeze and thaw cycles. At each concentration level, the imprecision had not to exceed 15%.
2.6.7. Stock solutions stability test. The stability of VASS, VASG, VAO, VAOS, VASL, VAOL and IS stock solutions was assessed under following storage conditions: one month at −20 °C and 24 h at room temperature. This test was performed by comparison of results from a solution kept in these storage conditions and the results from a freshly prepared solution. For this purpose, a working solution of VASS, VASG, VAO, VAOS, VASL, VAOL at 10.0 μg mL−1 and a working solution of IS at 10.0 μg mL−1 in the initial mobile phase were prepared from each corresponding stock solution and injected 5 times in the UPLC/MS-MS system. The eventual degradation should not exceed 5% for all analytes.
2.7. Relative quantitation assay of five metabolites in plasma by UPLC MS/MS
In order to relatively determining metabolites VAOG, MVAS1, MVAS2, HVAS1 and HVAS2 in plasma after administration of VAS, a relative quantitation assay was performed by using urine sample after oral administration of VAS as standard, which contain the target metabolites intending to be measured. The relative quantitation calibration curves of target metabolites were obtained by measuring the peak area ratio of target metabolites of the different dilution ratio urine samples to IS. Then, the relative concentration of target metabolites in plasma samples could be calculated by the relative quantitation calibration curves.
2.7.1. Urine sample collection. The urine from 3 male rats was collected for the study of the relative quantitation assay of metabolites VAOG, MVAS1, MVAS2, HVAS1 and HVAS2. Urine samples were collected from 0 to 24 h after oral administration of VAS (45 mg kg−1). The urine samples (approximately 100 mL) were pooled after centrifuging (4000 × g, 15 min). Blank urine was collected before oral administration of VAS. All samples were stored at −20 °C until use.
2.7.2. Relative quantitation calibration curves of VAOG, MVAS1, MVAS2, HVAS1 and HVAS2. Up to 50 mL of urine was thoroughly mixed with same volume of acetonitrile (n = 5), and then centrifuged at 15
000 × g for 10 min. The supernatant (urine sample extract, USE) was evaporated until dry under nitrogen at 37 °C. Finally, USE (700.50 mg) was obtained by vacuum dehydration (45 °C, 24 h). USE stock solution with a concentration of 10 mg mL−1 was prepared in methanol. The working solutions of USE were serially diluted with the initial mobile phase to provide desired concentrations. Then, 50 μL of USE working solution was added to 50 μL of blank plasma, followed by the addition of 50 μL IS working solution and 250 μL of acetonitrile. The mixture was vortexed for 30 s and centrifuged at 15
000 × g for 10 min at 4 °C. The supernatant (320 μL) was evaporated to dryness by a gentle stream of nitrogen (37 °C). The residue was dissolved by 100 μL of initial mobile phase and centrifuged at 15
000 × g for 5 min. The supernatants (5 μL) were applied to the UPLC-MS/MS analysis. The relative quantitation calibration curves of target metabolites were obtained by the peak area ratio of target metabolites of the different concentration of urine samples to IS.
2.8. Pharmacokinetic study
Experiments were performed on 32 rats that were randomly divided into four groups: one i.v. dosage group (2 mg kg−1) and three oral dosage groups (5 mg kg−1, 15 mg kg−1 and 45 mg kg−1). Aqueous solution of VAS was intravenously injected to rats by vena caudalis at a dose of 2 mg kg−1. Aqueous solution of VAS was orally administered to rats by gavage with gauge syringe at a dose of 5 mg kg−1, 15 mg kg−1 and 45 mg kg−1, respectively. Blood samples (approximately 0.25 mL in each sample) were collected via angular vein according to the specific scheduled time intervals (at different time intervals of 2, 5, 10, 15, 20, 30, 60, 120, 240, 480, 720, 1440, 2160 min after i.v. administration and 2, 5, 15, 30, 45, 60, 120, 240, 480, 720, 1440, 2160 after p.o. administration). The blood samples were centrifuged at 6000 × g at 4 °C for 10 min to obtain plasma. The plasma samples were stored at −20 °C until UPLC/MS/MS analysis.
2.9. In vitro anti-butyrylcholinesterase assays
The BChE inhibitory activities of plasma samples were evaluated based on our previously established method with slight modification.3 Plasma (10 μL) was spiked with 100 μL of acetonitrile (to inactivate cholinesterase in plasma sample). The mixture was vortexed for 30 s and directly evaporated to dryness by a gentle stream of nitrogen (37 °C). The residue was re-dissolved by 60 μL of buffer (20 mM sodium phosphate buffer, pH7.6). BChE solution (0.008 unit mL−1, 40 μL) was added and pre-incubated for 15 min. Up to 50 μL of substrate solution (7.152 μM for BCh) was added into the mixture, and was then incubated for 20 min at 25 °C. The reaction was terminated by adding 300 μL of ice-cold acetonitrile and was immediately mixed with IS (chlormequat, 1.899 μM). The solution was then centrifuged (15
000 × g, 10 min), and the supernatant was used for UPLC-MS/MS analysis. The inhibition ratio was calculated following the equation: inhibition ratio (%) = [C(Ch,control) − (C(Ch,sample) − C(Ch,blank))]/C(Ch,control) × 100. The C(Ch,control) is the concentration of Ch which was not added plasma sample in incubation system. C(Ch,sample) is the concentration of Ch which was added pretreatment plasma sample in incubation system. C(Ch,blank) is the concentration of Ch which was not added BChE in incubation system. A Pearson correlation analysis was processed in concentration of analytes and inhibition ratios at each time, and the correlation factors were calculated. The value of correlation factor was closer to 1, it was indicated that the linear relation was much better between the concentrations of analytes with inhibition ratios.
2.10. Data analysis
All calibration and quantitation data were processed with MassLynx 4.1 software. Experimental data and the pharmacokinetic parameters were expressed as the mean ± standard deviation. The plasma concentration versus time curves were plotted and all the pharmacokinetic data were processed using the noncompartmental pharmacokinetics data analysis software program PK solutions 2™ (Summit Research Services, USA). The following pharmacokinetic parameters of quantitative compounds were calculated: absorption rate constant (ka), absorption half-life (T1/2ka), distribution rate constant (kd), distribution half-life (T1/2kd), elimination rate constant (ke), elimination half-life (T1/2ke), apparent volume of distribution (Vd), clearance rate (CL), and mean residence time (MRT). The maximum peak concentration (Cmax), the time of maximum plasma concentration (Tmax) and area under the plasma concentration versus time curve from zero to time t (AUC0−t) were obtained directly from the observed concentration versus time data. The area under the plasma concentration versus time curve from zero to infinity (AUC0−∞) was calculated by means of the trapezoidal rule with extrapolation to infinity with a terminal elimination rate constant (ke). Due to metabolites VASG, MVAS1, MVAS2, HVAS1 and HVAS2 being quantitated relatively, the pharmacokinetic parameters (ka, T1/2ka, kd, T1/2kd, ke, T1/2ke, Tmax, MRT, Vd, CL) which were not related to dose of drug were analyzed. The Pearson correlation analysis was processed by SPSS 18.0. A statistical analysis was performed using an analysis of variance with α = 0.05 as the minimal level of significance.
3. Results and discussion
3.1. Method validation
3.1.1. Selectivity and carry-over. The representative MRM chromatograms of IS-spiked blank plasma (18 ng mL−1 of IS), IS-spiked standard sample and IS-spiked plasma after administration of VAS, respectively, are shown in Fig. 3. No interference from endogenous substance was observed at the elution times for each analyte MRM channel. The carry-over test for VAO, VAOS, VASS, VASG, VAS, VASL, VAOL at ULOQ and IS did not show any carry-over effect to the blank sample.
 |
| Fig. 3 Representative MRM chromatograms of VAS and its metabolites in rat plasma: (A) a blank plasma and IS (18 ng mL−1); (B) a blank sample spiked with the analytes (with LLOQ) and IS (18 ng mL−1); and (C) a plasma sample (2 h) from a rat after oral administration 45 mg kg−1 of VAS. | |
3.1.2. Linearity and LLOQ. The slopes, intercepts obtained from typical calibration curves of all analytes are shown in Table 2. The LLOQ are 0.73, 0.80, 0.75, 0.80, 0.82, 0.87, 0.82 ng mL−1 for VAO, VAOS, VASS, VASG, VAS, VASL and VAOL, respectively, with acceptable limits of accuracy and precision.
Table 2 LOD, LLOQ and representative calibration curves of each standard substance (n = 5)
Analytes |
LOD (ng mL−1) |
LLOQ (ng mL−1) |
Linear range (ng mL−1) |
Slope |
Intercept |
R2 |
VAO |
0.29 |
0.73 |
0.73–443.00 |
0.1225 |
0.0036 |
0.9988 |
VAOS |
0.32 |
0.80 |
0.80–490.00 |
0.0010 |
0.006 |
0.9990 |
VASS |
0.30 |
0.75 |
0.75–455.00 |
0.0028 |
0.0261 |
0.998 |
VASG |
0.32 |
0.80 |
0.80–490.00 |
0.0052 |
0.0399 |
0.9986 |
VAS |
0.33 |
0.82 |
0.82–500.00 |
0.023 |
0.0129 |
0.9973 |
VASL |
0.35 |
0.87 |
0.87–530.00 |
0.0014 |
0.0661 |
0.9990 |
VAOL |
0.30 |
0.82 |
0.82–500.00 |
0.0451 |
0.0685 |
0.9987 |
3.1.3. Within-run and between-run precision. In the range 0.80–500.00 ng mL−1, within and between-run imprecision and inaccuracy were evaluated at 5 concentration levels (0.80, 12.80, 80.00, 200.00, 500.00 ng mL−1) by repeated determination (n = 5) of pooled QC samples. The within-run imprecision expressed as intra-run CV% did not exceed 7.66% at the LLOQ, and 5.62% at other concentration levels. Inaccuracy expressed as intra-run RE% was between −9.87% and 7.03% (Table 3). The between-run imprecision expressed as inter-run CV % was below 12.30%, and the inaccuracy expressed as inter-run RE% was between −8.33% and 10.05% (Table 3). Both within- and between-run inaccuracy and imprecision of the assay were within FDA bioanalytical method validation guidance acceptance criteria,17 which demonstrated that the method is consistent and precise at different sample concentrations.
Table 3 Summary of within-run and between-run precision for the UPLC-ESIMS/MS method (n = 5)
Analytes |
Nominal level (ng mL−1) |
Within-run precision |
Between-run precision |
Mean ± SD |
CV (%) |
RE (%) |
Mean ± SD |
CV (%) |
RE (%) |
VAO |
0.73 (LLOQ) |
0.71 ± 0.01 |
1.21 |
−2.74 |
0.74 ± 0.02 |
3.14 |
1.37 |
11.34 (QCL) |
10.84 ± 0.25 |
2.34 |
−4.41 |
12.48 ± 0.65 |
5.23 |
10.05 |
70.88 (QCM) |
70.83 ± 0.18 |
0.25 |
−0.07 |
70.23 ± 5.99 |
8.53 |
−0.92 |
177.20 (QCH) |
182.38 ± 6.49 |
3.56 |
2.92 |
183.04 ± 5.80 |
3.17 |
3.30 |
443.00 (ULOQ) |
452.94 ± 0.12 |
0.03 |
2.24 |
438.50 ± 10.22 |
2.33 |
−1.02 |
VAOS |
0.80 (LLOQ) |
0.78 ± 0.02 |
2.16 |
−2.50 |
0.77 ± 0.03 |
4.40 |
−3.75 |
12.54 (QCL) |
11.89 ± 0.51 |
4.31 |
−5.18 |
12.32 ± 0.83 |
6.76 |
−1.75 |
78.40 (QCM) |
80.53 ± 2.44 |
3.03 |
2.72 |
77.35 ± 7.84 |
10.13 |
−1.34 |
196.00 (QCH) |
205.22 ± 11.53 |
5.62 |
4.70 |
201.43 ± 5.82 |
2.89 |
2.77 |
490.00 (ULOQ) |
494.20 ± 11.55 |
2.34 |
0.86 |
487.04 ± 30.39 |
6.24 |
−0.60 |
VASS |
0.75 (LLOQ) |
0.71 ± 0.05 |
7.66 |
−5.33 |
0.74 ± 0.09 |
12.30 |
−1.33 |
11.65 (QCL) |
10.78 ± 0.34 |
3.15 |
−7.47 |
12.04 ± 0.20 |
1.67 |
3.35 |
72.80 (QCM) |
71.45 ± 1.61 |
2.25 |
−1.85 |
74.56 ± 6.75 |
9.05 |
2.42 |
182.00 (QCH) |
191.56 ± 8.08 |
4.22 |
5.25 |
187.73 ± 6.44 |
3.43 |
3.15 |
455.00 (ULOQ) |
466.74 ± 11.98 |
2.57 |
2.58 |
436.22 ± 17.01 |
3.90 |
−4.13 |
VASG |
0.80 (LLOQ) |
0.83 ± 0.05 |
5.87 |
3.75 |
0.77 ± 0.07 |
9.03 |
−3.75 |
12.54 (QCL) |
11.95 ± 0.27 |
2.26 |
−4.70 |
12.79 ± 0.37 |
2.90 |
1.99 |
78.40 (QCM) |
81.65 ± 1.46 |
1.79 |
4.15 |
82.34 ± 6.40 |
7.77 |
5.03 |
196.00 (QCH) |
209.77 ± 9.80 |
4.67 |
7.03 |
201.89 ± 17.24 |
8.54 |
3.01 |
490.00 (ULOQ) |
471.11 ± 2.40 |
0.51 |
−3.86 |
479.36 ± 10.98 |
2.29 |
−2.17 |
VAS |
0.82 (LLOQ) |
0.85 ± 0.04 |
4.64 |
3.66 |
0.80 ± 0.05 |
6.52 |
−2.44 |
12.80 (QCL) |
11.88 ± 0.32 |
2.69 |
−7.19 |
13.01 ± 0.56 |
4.28 |
1.64 |
80.00 (QCM) |
80.88 ± 0.58 |
0.72 |
1.10 |
83.24 ± 3.05 |
3.67 |
4.05 |
200.00 (QCH) |
195.63 ± 7.39 |
3.78 |
−2.19 |
208.67 ± 6.24 |
2.99 |
4.33 |
500.00 (ULOQ) |
495.61 ± 6.36 |
1.28 |
−0.88 |
505.05 ± 8.13 |
1.61 |
1.01 |
VASL |
0.87 (LLOQ) |
0.86 ± 0.06 |
6.54 |
−1.15 |
0.90 ± 0.06 |
6.58 |
3.45 |
13.57 (QCL) |
12.23 ± 0.66 |
5.43 |
−9.87 |
12.44 ± 0.51 |
4.07 |
−8.33 |
84.80 (QCM) |
80.17 ± 1.30 |
1.62 |
−5.46 |
85.62 ± 3.72 |
4.35 |
0.97 |
212.00 (QCH) |
215.20 ± 4.26 |
1.98 |
1.51 |
206.73 ± 11.23 |
5.43 |
−2.49 |
530.00 (ULOQ) |
515.40 ± 4.48 |
0.87 |
−2.75 |
516.99 ± 21.2 |
4.10 |
−2.45 |
VAOL |
0.82 (LLOQ) |
0.79 ± 0.04 |
5.31 |
−3.66 |
0.79 ± 0.06 |
7.13 |
−3.66 |
12.80 (QCL) |
12.14 ± 0.51 |
4.21 |
−5.16 |
11.77 ± 0.29 |
2.44 |
−8.05 |
80.00 (QCM) |
79.12 ± 1.91 |
2.42 |
−1.10 |
80.23 ± 2.50 |
3.12 |
0.29 |
200.00 (QCH) |
192.45 ± 7.45 |
3.87 |
−3.78 |
192.24 ± 9.69 |
5.04 |
−3.88 |
500.00 (ULOQ) |
487.43 ± 2.10 |
0.43 |
−2.51 |
487.06 ± 2.63 |
0.54 |
−2.59 |
3.1.4. Extraction yield and matrix effect. The extraction yield of the assay was expressed by the recovery rate of QC samples at three concentrations (cal. 0.82, 80.00 and 500 ng mL−1). The recoveries of VAO, VAOS, VASS, VASG, VAS, VASL and VAOL were within the range of 85.89% to 108.76%, 96.24% to 105.30%, 92.02% to 114.44%, 93.03% to 114.58%, 89.26% to 107.61%, 92.23 to 98.74% and 92.20 to 95.93%, respectively (Table 4). Thus, the recoveries of all analytes were consistent and reproducible across the entire range (0.80–500.00 ng mL−1).
Table 4 Summary of extraction yield and matrix effect for the UPLC-ESIMS/MS method
Analytes |
Added conc. (ng mL−1) |
Measured conc. (n = 5) (ng mL−1) |
Recovery (%) |
RE (%) |
Matrix effect (%) |
VAO |
0.73 |
0.62 ± 0.01 |
85.89 ± 1.98 |
−14.96 |
97.48 ± 4.10 |
70.88 |
77.09 ± 1.87 |
108.76 ± 2.64 |
8.76 |
101.06 ± 7.43 |
443.00 |
439.44 ± 2.58 |
99.20 ± 0.58 |
−1.45 |
101.15 ± 12.00 |
VAOS |
0.80 |
0.77 ± 0.01 |
96.24 ± 1.38 |
−3.75 |
89.00 ± 1.96 |
78.40 |
82.55 ± 0.43 |
105.30 ± 0.55 |
5.29 |
95.15 ± 6.05 |
490.00 |
487.70 ± 4.38 |
99.53 ± 0.89 |
−0.47 |
98.24 ± 2.56 |
VASS |
0.75 |
0.69 ± 0.01 |
92.02 ± 0.70 |
−8.01 |
102.91 ± 8.66 |
72.80 |
83.31 ± 0.19 |
114.44 ± 0.26 |
14.44 |
99.07 ± 12.32 |
455.00 |
449.85 ± 0.96 |
98.87 ± 0.21 |
−1.13 |
96.70 ± 9.12 |
VASG |
0.80 |
0.75 ± 0.10 |
93.03 ± 11.98 |
−6.25 |
96.22 ± 3.94 |
78.40 |
89.83 ± 0.72 |
114.58 ± 0.92 |
14.58 |
102.97 ± 4.71 |
490.00 |
487.88 ± 2.49 |
99.57 ± 0.51 |
−0.43 |
99.02 ± 2.84 |
VAS |
0.82 |
0.73 ± 0.01 |
89.26 ± 1.6 |
−10.98 |
106.67 ± 5.63 |
80.00 |
84.37 ± 0.97 |
107.61 ± 1.24 |
5.46 |
104.11 ± 11.63 |
500.00 |
488.70 ± 22.47 |
99.74 ± 4.59 |
−0.26 |
97.66 ± 10.57 |
VASL |
0.87 |
0.79 ± 0.02 |
98.74 ± 3.06 |
−9.20 |
105.77 ± 3.43 |
84.80 |
83.14 ± 0.34 |
98.04 ± 0.26 |
−1.96 |
100.55 ± 5.56 |
530.00 |
488.69 ± 4.80 |
92.23 ± 0.48 |
−7.79 |
105.17 ± 7.32 |
VAOL |
0.82 |
0.76 ± 0.04 |
92.20 ± 5.07 |
−7.32 |
100.32 ± 10.12 |
80.00 |
75.19 ± 1.90 |
93.99 ± 2.37 |
−6.01 |
102.71 ± 3.89 |
500.00 |
479.63 ± 23.18 |
95.93 ± 4.64 |
−4.07 |
94.78 ± 4.28 |
IS |
18.00 |
17.73 ± 0.40 |
98.50 ± 2.23 |
−1.50 |
96.46 ± 5.42 |
Matrix effect was conducted as described in Section 2.6.4. The value mean (A)/mean (B) × 100% of all analytes at three concentrations of QC samples and at single concentration of IS was within the acceptable limits (89.00–106.67%, Table 4). Thus, the ion suppression or enhancement of the analytes resulted from plasma components were negligible for this method.
3.1.5. Dilution test. Ten pooled blank rat plasma QC samples at 2500 ng mL−1 were diluted (five at 1/10 and five at 1/100), then processed and injected bracketed between two sets of calibration standards. The resulting concentrations were multiplied by the dilution factor. For both dilution factors, the imprecision (CV%) was below 1.27% and the inaccuracy (RE%) was between −5.80% and −0.96% (Table 5). Thus, the dilution had no effect on the precision and accuracy of the results.
Table 5 Dilution test (n = 5)
Analytes |
Nominal level (ng mL−1) |
Dilution factor |
Mean ± SD |
CV (%) |
RE (%) |
VAO |
2215.00 |
10× |
2156.11 ± 10.12 |
0.47 |
−2.66 |
100× |
2143.03 ± 12.25 |
0.57 |
−3.25 |
VAOS |
2450.00 |
10× |
2426.44 ± 18.68 |
0.77 |
−0.96 |
100× |
2356.57 ± 23.77 |
1.01 |
−3.81 |
VASS |
2275.00 |
10× |
2216.25 ± 19.32 |
0.87 |
−2.58 |
100× |
2203.78 ± 25.67 |
1.16 |
−3.13 |
VASG |
2450.00 |
10× |
2378.93 ± 25.31 |
1.06 |
−2.90 |
100× |
2353.21 ± 19.11 |
0.81 |
−3.95 |
VAS |
2500.00 |
10× |
2437.23 ± 17.42 |
0.71 |
−2.51 |
100× |
2413.59 ± 29.84 |
1.24 |
−3.46 |
VASL |
2650.00 |
10× |
2559.43 ± 32.53 |
1.27 |
−3.42 |
100× |
2496.43 ± 23.17 |
0.93 |
−5.80 |
VAOL |
2500.00 |
10× |
2396.87 ± 22.41 |
0.93 |
−4.13 |
100× |
2373.58 ± 16.92 |
0.71 |
−5.06 |
3.1.6. Biological sample stability. The biological sample stability experiments were aimed at testing the possible degradations of the tested compounds in rat plasma at different conditions that the samples might experience between preparation and analysis. As summarized in Table 6, all three levels of analytes in rat plasma were stable at room temperature up to 24 h with CV less than 9.08%. And all analytes at three levels were stable when kept in the autosampler (4 °C) for three days with CV less than 9.27%. After three cycles of freeze and thaw for QC samples, all analytes at three levels were stable in plasma with CV less than 7.34%. All analytes were stable at −20 °C for at one month with CV less than 8.51%. All data were with acceptable limit, which indicated that the analytes determined were sufficiently stable in biological matrix during the analysis.
Table 6 Stability of each standard substance in rat plasma under different storage conditions (n = 5)
Conditions |
Nominal levels |
VAO |
VAOS |
VASS |
VASG |
VAS |
VASL |
VAOL |
Mean ± SD |
CV% |
Mean ± SD |
CV% |
Mean ± SD |
CV% |
Mean ± SD |
CV% |
Mean ± SD |
CV% |
Mean ± SD |
CV% |
Mean ± SD |
CV% |
AT |
QCL |
0.72 ± 0.01 |
1.34 |
0.78 ± 0.01 |
1.87 |
0.74 ± 0.07 |
9.08 |
0.77 ± 0.03 |
3.43 |
0.79 ± 0.04 |
4.95 |
0.83 ± 0.06 |
7.64 |
0.83 ± 0.01 |
1.26 |
QCM |
70.80 ± 0.16 |
0.23 |
76.54 ± 3.05 |
3.99 |
72.60 ± 1.99 |
2.74 |
77.07 ± 0.73 |
0.95 |
80.90 ± 0.80 |
0.99 |
83.11 ± 1.31 |
1.58 |
79.13 ± 0.21 |
0.26 |
QCH |
448.32 ± 0.09 |
0.02 |
498.23 ± 14 |
2.81 |
444.32 ± 9.78 |
2.20 |
501.01 ± 2.56 |
0.51 |
508.66 ± 8.8 |
1.73 |
521.37 ± 6.36 |
1.22 |
483.94 ± 0.15 |
0.03 |
4 °C |
QCL |
0.71 ± 0.01 |
1.25 |
0.81 ± 0.01 |
0.97 |
0.77 ± 0.07 |
9.27 |
0.78 ± 0.06 |
7.99 |
0.80 ± 0.00 |
0.62 |
0.85 ± 0.03 |
3.13 |
0.81 ± 0.02 |
2.06 |
QCM |
72.11 ± 0.21 |
0.29 |
79.99 ± 2.38 |
2.97 |
73.29 ± 0.64 |
0.88 |
80.09 ± 1.81 |
2.26 |
78.26 ± 0.20 |
0.26 |
83.99 ± 1.39 |
1.66 |
77.33 ± 2.12 |
2.74 |
QCH |
452.34 ± 0.14 |
0.03 |
501.37 ± 11.98 |
2.39 |
451.66 ± 14.18 |
3.14 |
478.12 ± 1.24 |
0.26 |
493.78 ± 5.33 |
1.08 |
517.34 ± 2.17 |
0.42 |
491.58 ± 11.31 |
2.3 |
Freeze/thaw |
QCL |
0.71 ± 0.03 |
4.51 |
0.79 ± 0.04 |
4.88 |
0.74 ± 0.05 |
7.34 |
0.79 ± 0.04 |
4.48 |
0.84 ± 0.03 |
3.40 |
0.85 ± 0.06 |
7.26 |
0.79 ± 0.04 |
4.85 |
QCM |
74.43 ± 3.15 |
4.23 |
79.87 ± 1.73 |
2.17 |
74.55 ± 3.88 |
5.21 |
79.28 ± 3.34 |
4.21 |
77.69 ± 1.65 |
2.12 |
83.21 ± 2.55 |
3.07 |
75.89 ± 2.53 |
3.33 |
QCH |
443.18 ± 16.49 |
3.72 |
478.34 ± 15.69 |
3.28 |
450.73 ± 11 |
2.44 |
487.43 ± 15.26 |
3.13 |
499.01 ± 4.89 |
0.98 |
528.70 ± 11.26 |
2.13 |
488.74 ± 3.23 |
0.66 |
−20 °C |
QCL |
0.70 ± 0.01 |
1.88 |
0.77 ± 0.06 |
7.24 |
0.73 ± 0.08 |
10.89 |
0.76 ± 0.06 |
8.26 |
0.79 ± 0.03 |
3.33 |
0.87 ± 0.04 |
4.95 |
0.81 ± 0.04 |
5.41 |
QCM |
73.23 ± 6.23 |
8.51 |
76.24 ± 4.38 |
5.74 |
71.20 ± 5.72 |
8.04 |
80.37 ± 5.67 |
7.05 |
82.22 ± 2.89 |
3.52 |
80.55 ± 3.33 |
4.13 |
76.89 ± 1.38 |
1.79 |
QCH |
453.18 ± 10.51 |
2.32 |
496.31 ± 29.28 |
5.90 |
459.03 ± 16.85 |
3.67 |
501.7 ± 10.79 |
2.15 |
511.31 ± 8.08 |
1.58 |
524.7 ± 21.2 |
4.04 |
487.59 ± 8.53 |
1.75 |
3.1.7. Stock solutions stability test. The results in Tables 7 and 8 demonstrated that stock solutions of VAO, VAOS, VASS, VASG, VAS, VASL and VAOL kept for 24 h at room temperature and stored below −20 °C for one month were stable, since the degradation expressed by the difference percentage was below 4.24%. All analytes at three levels from stored and freshly prepared stock solutions were stable at room temperature up to 24 h with CV less than 7.64%, and all analytes at three levels from stored and freshly prepared stock solutions were stable at −20 °C for at one month with CV less than 5.28%.
Table 7 Stock solution stability of each standard substance at room temperature for 24 h (n = 5)
Analytes |
Nominal level (ng mL−1) |
Stored stock solutions |
Freshly prepared stock solutions |
Difference (%) |
Mean ± SD (ng mL−1) |
CV% |
Mean ± SD (ng mL−1) |
CV% |
VAO |
0.73 |
0.72 ± 0.03 |
3.65 |
0.73 ± 0.02 |
2.31 |
−1.37 |
70.88 |
70.19 ± 1.50 |
2.13 |
70.49 ± 1.48 |
2.10 |
−0.43 |
443.00 |
451.82 ± 8.45 |
1.87 |
433.43 ± 5.42 |
1.28 |
4.24 |
VAOS |
0.80 |
0.77 ± 0.04 |
5.11 |
0.78 ± 0.04 |
5.57 |
−1.28 |
78.40 |
74.98 ± 2.45 |
3.27 |
77.91 ± 2.38 |
3.06 |
−3.76 |
490.00 |
477.7 ± 11.42 |
2.39 |
474.23 ± 8.54 |
1.80 |
0.73 |
VASS |
0.75 |
0.74 ± 0.06 |
7.64 |
0.76 ± 0.03 |
4.33 |
−2.63 |
72.80 |
71.29 ± 2.48 |
3.48 |
71.88 ± 3.21 |
4.47 |
−0.82 |
455.00 |
451.29 ± 5.42 |
1.2 |
459.22 ± 9.74 |
2.12 |
−1.73 |
VASG |
0.80 |
0.79 ± 0.03 |
4.33 |
0.78 ± 0.02 |
2.44 |
1.28 |
78.40 |
77.35 ± 1.81 |
2.34 |
79.04 ± 2.51 |
3.18 |
−2.14 |
490.00 |
485.22 ± 6.02 |
1.24 |
492.89 ± 8.82 |
1.79 |
−1.56 |
VAS |
0.82 |
0.80 ± 0.05 |
6.51 |
0.81 ± 0.04 |
4.43 |
−1.23 |
80.00 |
77.9 ± 2.74 |
3.52 |
76.24 ± 2.5 |
3.28 |
2.18 |
500.00 |
487.42 ± 9.16 |
1.88 |
479.22 ± 10.4 |
2.17 |
1.71 |
VASL |
0.87 |
0.85 ± 0.04 |
4.86 |
0.86 ± 0.03 |
3.38 |
−1.16 |
84.80 |
81.28 ± 1.77 |
2.18 |
83.47 ± 2.66 |
3.19 |
−2.62 |
530.00 |
514.99 ± 4.89 |
0.95 |
528.36 ± 5.49 |
1.04 |
−2.53 |
VAOL |
0.82 |
0.80 ± 0.03 |
3.26 |
0.81 ± 0.03 |
3.78 |
−1.23 |
80.00 |
77.75 ± 2.50 |
3.21 |
77.65 ± 1.86 |
2.40 |
0.13 |
500.00 |
488.16 ± 2.20 |
0.45 |
484.79 ± 4.8 |
0.99 |
0.70 |
Table 8 Stock solution stability of each standard substance at −20 °C for one month (n = 5)
Analytes |
Nominal level (ng mL−1) |
Stored stock solutions |
Freshly prepared stock solutions |
Difference (%) |
Mean ± SD (ng mL−1) |
CV% |
Mean ± SD (ng mL−1) |
CV% |
VAO |
0.73 |
0.69 ± 0.03 |
4.39 |
0.71 ± 0.03 |
4.07 |
−2.82 |
70.88 |
73.01 ± 1.74 |
2.38 |
70.66 ± 2.25 |
3.19 |
3.33 |
443.00 |
447.89 ± 10.03 |
2.24 |
430.22 ± 6.32 |
1.47 |
4.11 |
VAOS |
0.80 |
0.81 ± 0.03 |
4.28 |
0.79 ± 0.03 |
4.33 |
2.53 |
78.40 |
79.45 ± 2.73 |
3.44 |
78.12 ± 3.16 |
4.05 |
1.70 |
490.00 |
496.38 ± 10.18 |
2.05 |
482.21 ± 11.48 |
2.38 |
2.94 |
VASS |
0.75 |
0.76 ± 0.04 |
5.05 |
0.75 ± 0.04 |
4.89 |
1.33 |
72.80 |
70.3 ± 1.53 |
2.17 |
71.26 ± 2.4 |
3.37 |
−1.35 |
455.00 |
466.58 ± 14.65 |
3.14 |
448.12 ± 5.47 |
1.22 |
4.12 |
VASG |
0.80 |
0.78 ± 0.04 |
5.42 |
0.79 ± 0.04 |
5.05 |
−1.27 |
78.40 |
80.02 ± 3.10 |
3.87 |
78.04 ± 1.69 |
2.16 |
2.54 |
490.00 |
501.21 ± 2.86 |
0.57 |
483.17 ± 5.31 |
1.10 |
3.73 |
VAS |
0.82 |
0.81 ± 0.03 |
4.29 |
0.81 ± 0.02 |
2.26 |
0.00 |
80.00 |
78.11 ± 1.62 |
2.08 |
77.42 ± 3.24 |
4.18 |
0.89 |
500.00 |
492.08 ± 6.54 |
1.33 |
485.06 ± 10.09 |
2.08 |
1.45 |
VASL |
0.87 |
0.88 ± 0.02 |
2.32 |
0.86 ± 0.04 |
4.43 |
2.33 |
84.80 |
85.23 ± 2.28 |
2.67 |
84.21 ± 3.17 |
3.77 |
1.21 |
530.00 |
524.10 ± 3.88 |
0.74 |
526.77 ± 1.79 |
0.34 |
−0.51 |
VAOL |
0.82 |
0.83 ± 0.01 |
1.39 |
0.82 ± 0.02 |
2.81 |
1.22 |
80.00 |
79.05 ± 0.51 |
0.64 |
78.7 ± 2.46 |
3.13 |
0.44 |
500.00 |
479.04 ± 25.29 |
5.28 |
492.18 ± 10.63 |
2.16 |
−2.67 |
3.2. Relative quantitation assay of metabolites VAOG, MVAS1, MVAS2, HVAS1 and HVAS2 in plasma
To analyze a serial of USE relative standard samples (range from 1.95 to 2000 μg mL−1), relative quantitation calibration curves were established in the range of 1.95–125 μg mL−1 for VAOG, 15.63–2000 μg mL−1 for MVAS1, 31.25–2000 μg mL−1 for MVAS2, 15.63–1000 μg mL−1 for HVAS1 and, and 15.63–1000 μg mL−1 for HVAS2. Typical equations of the calibration curves for VAOG, MVAS1, MVAS2, HVAS1 and HVAS2 were y = 0.0430x + 0.0231 (r2 = 0.9992), y = 0.0005x + 0.0084 (r2 = 0.9979), y = 0.0013x + 0.0120 (r2 = 0.9992), y = 0.0040x − 0.0212 (r2 = 0.9996) and y = 0.0044x − 0.0009 (r2 = 0.9999), respectively, where y represents the peak area ratio of analyte to IS and x represents the concentrations of analytes in USE.
The lack of reliable standard for calibration was a great bottleneck for the pharmacokinetic analysis of metabolites. Some relative quantitation approaches have been developed to obtain useful pharmacokinetic parameters, for example, by directly using the calibration curve of prototype compound or other relative metabolite and using relative conversion factor from prototype compound or other relative metabolites.18–21 In present study, the relative quantitation method was developed with rat urine sample after administration of VAS, where relatively large amount of metabolites were found basing on previous report.9,22 The relative quantitation calibration curves of target metabolites were obtained by measuring the peak area ratio to IS in different dilution ratio urine samples.
Compared with the relative quantitation method which was directly using the calibration curve of prototype compound or other relative metabolite,21 the calibration curves of target metabolites was developed by using the urine sample after administration of VAS, it could avoid the differences in ionization of these metabolites with prototype compound or other metabolites. Compared with the relative quantitation method which was used relative conversion factor by prototype compound or other relative metabolites,19 the present method was simple, and it could avoid the tedious steps of calculating relative factors. In addition, all 72 metabolites were found in the urine sample, and the concentrations of target metabolites were also found abundant.9 These were the reasons for using urine as relative standard reference without plasma after administration of VAS. By this relative quantitation assay, some useful pharmacokinetic parameters independent of absolute plasma concentrations, such as elimination rate constant (ke), elimination half-life (T1/2ke), apparent volume of distribution (Vd), clearance rate (CL), and mean residence time (MRT) could be calculated. In present study, by this relative quantitation assay, a relative quantitation method was successfully developed and applied to obtain some useful pharmacokinetic parameters, which provided an alternative method to solve neck barrier in study of metabolites pharmacokinetics.
3.3. Pharmacokinetics study
The validated UPLC-MS/MS method was successfully applied to the in vivo pharmacokinetic study in the rats treated with VAS. The plasma concentration versus time curves of VAS and its metabolites VAO, VAOS, VASS and VASG after intravenous injection of VAS solution at a dose of 2 mg kg−1 in rats were shown in Fig. 4A. Because of the metabolites VASL and VAOL being only detected in some plasma samples inconsecutively the plasma concentration versus time curves of VASL and VAOL were not obtained. Based on the quantitative results, the pharmacokinetics parameters were calculated and summarized in Table 9. As illustrated from Fig. 4A, the VAS plasma concentration showed a sharp decline followed by a slow phase of decrease with T1/2ke of 305.16 ± 122.91 min until the levels fell below the detection limits within 12 h after administration. The T1/2ke values of metabolites VAO, VAOS, VASS and VASG decreased to 131.83 ± 84.06, 138.82 ± 84.33, 28.02 ± 7.17 and 106.58 ± 53.86 min, respectively, which are significantly different from the value of VAS (P < 0.05). Following the sharp plasma concentration decline, most of the VAS transformed to its metabolites VAO, VAOS, VASS and VASG, among which, the formation rates of VAOS and VASG were especially high. These metabolites could be detected in plasma 2 min after intravenous injection of VAS with Tmax of 48.75 ± 14.52, 41.88 ± 18.70, 27.50 ± 13.69 and 36.25 ± 14.09 min for VAO, VAOS, VASS and VASG, respectively. Compared with VAS, these metabolites also exhibited different clearance and distribution volume accordingly. These results suggested that the elimination of VAS is dramatically accelerated by the rapid formation of individual metabolite.
 |
| Fig. 4 Mean plasma concentration–time curves of VAS and its metabolites VAO, VAOS, VASS and VASG in rats plasma after intravenously administration of VAS ((A) 2 mg kg−1) and oral administration of VAS ((B) 5 mg kg−1; (C) 15 mg kg−1; (D) 45 mg kg−1) (n = 8, mean ± SD). | |
Table 9 Pharmacokinetics parameters of VAS and its metabolites VAO, VAOS, VASS and VASG in rats after intravenous administration of 2 mg kg−1 VAS (mean ± SD, n = 8)
Pharmacokinetics parameters |
VAS |
VAO |
VAOS |
VASS |
VASG |
kd (min) |
— |
0.018 ± 0.007 |
0.014 ± 0.006 |
0.102 ± 0.060 |
0.026 ± 0.008 |
T1/2kd (min) |
— |
44.08 ± 16.97 |
62.14 ± 29.28 |
9.89 ± 7.18 |
28.92 ± 8.90 |
Ka (min) |
— |
0.040 ± 0.019 |
0.023 ± 0.013 |
0.095 ± 0.049 |
0.067 ± 0.032 |
T1/2ka (min) |
— |
22.73 ± 12.66 |
40.03 ± 20.49 |
8.77 ± 3.25 |
12.91 ± 6.47 |
ke (min) |
0.003 ± 0.001 |
0.007 ± 0.003 |
0.007 ± 0.003 |
0.026 ± 0.007 |
0.008 ± 0.004 |
T1/2ke (min) |
305.16 ± 122.91 |
131.83 ± 84.06 |
138.82 ± 84.33 |
28.02 ± 7.17 |
106.58 ± 53.86 |
Cmax (μg mL−1) |
0.78 ± 0.27 |
0.03 ± 0.02 |
0.71 ± 0.64 |
0.02 ± 0.00 |
0.49 ± 0.12 |
Tmax (min) |
2.00 ± 0.00 |
48.75 ± 14.52 |
41.88 ± 18.70 |
27.50 ± 13.69 |
36.25 ± 14.09 |
AUC(0−t) (μg min mL−1) |
41.59 ± 11.90 |
3.95 ± 1.76 |
99.69 ± 71.16 |
1.15 ± 0.27 |
51.70 ± 13.99 |
AUC(0−∞) (μg min mL−1) |
41.65 ± 11.90 |
4.18 ± 1.84 |
102.35 ± 70.50 |
1.27 ± 0.34 |
52.65 ± 13.71 |
MRT (min) |
96.32 ± 35.18 |
163.27 ± 36.21 |
202.91 ± 62.92 |
55.43 ± 10.13 |
100.01 ± 18.26 |
Vd (mL kg−1) |
23 401.89 ± 13 042.25 |
106 803.72 ± 76 550.75 |
5515.75 ± 4047.28 |
65 689.06 ± 14 229.80 |
6425.48 ± 3506.53 |
CL (mL min−1 kg−1) |
53.61 ± 20.43 |
584.67 ± 297.76 |
26.23 ± 12.70 |
1729.64 ± 614.47 |
40.50 ± 9.83 |
After oral administration of VAS at doses of 5, 15, and 45 mg kg−1, VAS and its metabolites VAO, VAOS, VASS and VASG were detected in rat plasma at various sampling points. Their plasma concentrations versus time curves were shown in Fig. 4B–D, and their pharmacokinetics parameters were also calculated and summarized in Tables 10–12. VAS could be quickly absorbed into blood and metabolized to form various metabolites, including VAO and conjugated products of VAS (VAOS, VASS and VASG) (Fig. 4B–D) after oral administration of VAS at different doses. The bioavailability of VAS was 49.97%, 63.01% and 50.68% at doses of 5, 15, and 45 mg kg−1, respectively. No significant difference was observed from most of the pharmacokinetic parameters between VAS and its main metabolites (P > 0.05). However, Cmax and AUC of VAS and metabolites VASG displayed a dose-dependent increase, and AUC of metabolites VASS, VAO and VAOS also displayed a dose-dependent increase (Tables 10–12).
Table 10 Pharmacokinetics parameters of VAS and its metabolites VAO, VAOS, VASS and VASG in rats after oral administration of 5 mg kg−1 VAS (mean ± SD, n = 8)
Pharmacokinetics parameters |
VAS |
VAO |
VAOS |
VASS |
VASG |
kd (min) |
0.032 ± 0.016 |
0.050 ± 0.031 |
0.018 ± 0.014 |
0.022 ± 0.009 |
0.025 ± 0.008 |
T1/2kd (min) |
30.61 ± 20.68 |
25.86 ± 28.27 |
53.70 ± 34.39 |
38.84 ± 20.71 |
30.00 ± 7.96 |
Ka (min) |
0.054 ± 0.032 |
0.082 ± 0.028 |
0.045 ± 0.026 |
0.038 ± 0.023 |
0.078 ± 0.048 |
T1/2ka (min) |
14.58 ± 8.13 |
9.63 ± 3.59 |
22.17 ± 22.00 |
26.21 ± 14.33 |
13.57 ± 10.27 |
ke (min) |
0.007 ± 0.003 |
0.007 ± 0.003 |
0.005 ± 0.002 |
0.013 ± 0.008 |
0.008 ± 0.006 |
T1/2ke (min) |
107.07 ± 41.03 |
122.78 ± 45.80 |
142.67 ± 42.07 |
63.87 ± 22.62 |
128.78 ± 52.25 |
Cmax (μg mL−1) |
0.55 ± 0.31 |
0.09 ± 0.06 |
0.91 ± 0.78 |
0.02 ± 0.01 |
0.40 ± 0.20 |
Tmax (min) |
33.75 ± 12.44 |
37.50 ± 10.61 |
41.25 ± 12.44 |
31.88 ± 8.99 |
35.63 ± 10.44 |
AUC(0 t) (μg min mL−1) |
51.26 ± 37.08 |
8.52 ± 4.99 |
101.57 ± 78.10 |
1.45 ± 0.57 |
32.74 ± 15.79 |
AUC(0−∞) (μg min mL−1) |
52.03 ± 37.71 |
10.11 ± 5.26 |
105.23 ± 81.36 |
1.48 ± 0.58 |
34.39 ± 16.29 |
MRT (min) |
93.78 ± 28.74 |
156.45 ± 57.64 |
175.32 ± 59.89 |
86.17 ± 25.51 |
108.67 ± 29.81 |
Vd (mL kg−1) |
9094.90 ± 2837.28 |
90 446.63 ± 40 904.87 |
8457.55 ± 4098.81 |
303 178.79 ± 149 059.13 |
39 420.29 ± 29 311.42 |
CL (mL min−1 kg−1) |
371.35 ± 464.03 |
727.21 ± 513.63 |
110.15 ± 113.37 |
4329.48 ± 2504.26 |
218.05 ± 162.26 |
Table 11 Pharmacokinetics parameters of VAS and its metabolites VAO, VAOS, VASS and VASG in rats after oral administration of 15 mg kg−1 VAS (mean ± SD, n = 8)
Pharmacokinetics parameters |
VAS |
VAO |
VAOS |
VASS |
VASG |
kd (min) |
0.015 ± 0.008 |
0.009 ± 0.003 |
0.005 ± 0.005 |
0.056 ± 0.042 |
0.015 ± 0.012 |
T1/2kd (min) |
61.71 ± 39.36 |
88.42 ± 33.58 |
171.25 ± 112.56 |
14.01 ± 5.21 |
68.48 ± 36.96 |
Ka (min) |
0.035 ± 0.020 |
0.014 ± 0.006 |
0.017 ± 0.009 |
0.065 ± 0.043 |
0.027 ± 0.016 |
T1/2ka (min) |
28.42 ± 17.13 |
56.31 ± 18.32 |
38.00 ± 8.73 |
15.64 ± 8.51 |
36.24 ± 19.00 |
ke (min) |
0.008 ± 0.003 |
0.007 ± 0.003 |
0.002 ± 0.001 |
0.012 ± 0.003 |
0.008 ± 0.004 |
T1/2ke (min) |
107.71 ± 48.35 |
102.90 ± 37.18 |
357.19 ± 159.34 |
60.71 ± 16.77 |
106.58 ± 53.86 |
Cmax (μg mL−1) |
1.61 ± 0.95 |
0.03 ± 0.02 |
0.50 ± 0.31 |
0.02 ± 0.00 |
0.49 ± 0.12 |
Tmax (min) |
31.88 ± 8.99 |
97.50 ± 29.05 |
79.29 ± 36.49 |
56.25 ± 26.78 |
73.13 ± 27.49 |
AUC(0−t) (μg min mL−1) |
195.99 ± 97.10 |
7.17 ± 3.32 |
137.22 ± 38.75 |
2.27 ± 0.57 |
100.99 ± 25.88 |
AUC(0−∞) (μg min mL−1) |
196.83 ± 96.90 |
7.40 ± 3.41 |
145.85 ± 38.95 |
2.52 ± 0.70 |
101.93 ± 25.57 |
MRT (min) |
128.26 ± 23.06 |
242.84 ± 29.00 |
446.87 ± 196.68 |
110.60 ± 20.75 |
163.44 ± 20.65 |
Vd (mL kg−1) |
17 778.97 ± 17 537.74 |
457 852.98 ± 331 597.99 |
72 167.95 ± 43 337.69 |
547 590.78 ± 158 685.36 |
24 805.06 ± 13 660.87 |
CL (mL min−1 kg−1) |
98.29 ± 51.09 |
2501.52 ± 1287.33 |
114.76 ± 45.69 |
6584.94 ± 2346.45 |
156.23 ± 36.91 |
Table 12 Pharmacokinetics parameters of VAS and its metabolites VAO, VAOS, VASS and VASG in rats after oral administration of 45 mg kg−1 VAS (mean ± SD, n = 8)
Pharmacokinetics parameters |
VAS |
VAO |
VAOS |
VASS |
VASG |
kd (min) |
0.011 ± 0.005 |
0.008 ± 0.004 |
0.004 ± 0.002 |
0.015 ± 0.013 |
0.009 ± 0.006 |
T1/2kd (min) |
79.02 ± 35.73 |
110.31 ± 41.93 |
134.83 ± 29.31 |
64.74 ± 20.45 |
93.29 ± 40.23 |
Ka (min) |
0.013 ± 0.003 |
0.018 ± 0.010 |
0.009 ± 0.004 |
0.020 ± 0.016 |
0.010 ± 0.005 |
T1/2ka (min) |
56.44 ± 14.03 |
53.97 ± 28.55 |
104.49 ± 56.35 |
52.51 ± 23.63 |
85.40 ± 40.03 |
ke (min) |
0.009 ± 0.004 |
0.004 ± 0.002 |
0.003 ± 0.001 |
0.007 ± 0.004 |
0.006 ± 0.002 |
T1/2ke (min) |
89.70 ± 36.30 |
215.82 ± 129.41 |
238.28 ± 92.39 |
83.94 ± 23.73 |
140.49 ± 46.60 |
Cmax (μg mL−1) |
2.44 ± 0.89 |
0.19 ± 0.06 |
3.77 ± 1.80 |
0.12 ± 0.04 |
3.23 ± 1.53 |
Tmax (min) |
39.38 ± 10.44 |
50.63 ± 7.26 |
50.63 ± 10.44 |
30.00 ± 12.99 |
46.88 ± 11.71 |
AUC(0−t) (μg min mL−1) |
469.36 ± 186.26 |
57.56 ± 20.77 |
1127.93 ± 536.48 |
20.16 ± 4.47 |
594.37 ± 155.36 |
AUC(0−∞) (μg min mL−1) |
474.92 ± 185.67 |
61.68 ± 20.78 |
1134.81 ± 534.71 |
21.69 ± 4.63 |
595.95 ± 155.32 |
MRT (min) |
210.65 ± 37.67 |
340.44 ± 76.76 |
370.36 ± 121.45 |
293.41 ± 112.25 |
275.26 ± 86.27 |
Vd (mL kg−1) |
14 458.84 ± 7686.93 |
299 376.46 ± 247 575.17 |
20 586.51 ± 18 265.98 |
498 537.45 ± 410 905.94 |
15 749.93 ± 4976.13 |
CL (mL min−1 kg−1) |
105.72 ± 30.50 |
838.30 ± 345.10 |
52.21 ± 29.95 |
2174.63 ± 478.34 |
81.74 ± 24.15 |
The mean plasma relative concentration (calculated by USE) versus time curves of metabolites VAOG, MVAS1, MVAS2, HVAS1 and HVAS2 in rats plasma after intravenously administration of VAS (2 mg kg−1) and oral administration of VAS (45 mg kg−1) were shown in Fig. 5, and their pharmacokinetics parameters were calculated and summarized in Table 13. Some useful pharmacokinetic parameters independent from absolute plasma concentrations, such as ka, T1/2ka, kd, T1/2kd, ke, T1/2ke, Tmax, Vd, CL and MRT were calculated. As illustrated from Fig. 5A, because of the metabolites HVAS1 and MVAS1 being only detected in some plasma samples inconsecutively after intravenously administration of VAS (2 mg kg−1), the plasma concentration versus time curves of VASL and VAOL were not obtained. As same as the quantification metabolites (VAO, VAOS, VASS and VASG), the T1/2ke values of metabolites VAOG, MVAS2 and HVAS2 were 102.16 ± 72.75, 79.06 ± 26.45 and 75.65 ± 51.43 min, respectively, which were significantly shorter than the value of VAS (305.16 ± 122.91) (P < 0.05). These metabolites could be detected in plasma 2 min after intravenous injection of VAS with Tmax of 47.14 ± 16.04, 120.00 ± 84.85 and 23.75 ± 7.50 min for VAOG, MVAS2 and HVAS2, respectively. After oral administration of VAS at doses of 45 mg kg−1, the metabolites VAOG, MVAS1, MVAS2, HVAS1 and HVAS2 were detected in rat plasma at various sampling points. Their plasma concentrations versus time curves were shown in Fig. 5B, and their pharmacokinetics parameters were also calculated and summarized in Table 13.
 |
| Fig. 5 Mean plasma relative concentration (calculated by urine sample extract, USE)–time curves of metabolites VAOG, MVAS1, MVAS2, HVAS1 and HVAS2 in rats plasma after intravenously administration of VAS (A, 2 mg kg−1) and oral administration of VAS (B, 45 mg kg−1) (n = 8, mean ± SD). | |
Table 13 Pharmacokinetics parameters of metabolites VASG, MVAS1, MVAS2, HVAS1 and HVAS2 in rats after oral administration of 45 mg kg−1 VAS and intravenous administration of 2 mg kg−1 VAS (mean ± SD, n = 8)
Pharmacokinetics parameters |
VAOG |
MVAS 1 |
MVAS 2 |
HVAS 1 |
HVAS 2 |
p.o. |
i.v. |
p.o. |
i.v. |
p.o. |
i.v. |
p.o. |
i.v. |
p.o. |
i.v. |
kd (min) |
0.007 ± 0.002 |
0.014 ± 0.060 |
0.018 ± 0.009 |
— |
0.016 ± 0.009 |
0.020 ± 0.015 |
0.011 ± 0.007 |
— |
0.012 ± 0.004 |
0.050 ± 0.022 |
T1/2kd (min) |
109.85 ± 48.75 |
21.25 ± 17.46 |
51.33 ± 33.87 |
— |
52.42 ± 22.76 |
44.61 ± 26.70 |
88.62 ± 51.76 |
— |
65.27 ± 20.47 |
15.74 ± 6.03 |
Ka (min) |
0.016 ± 0.015 |
0.056 ± 0.023 |
0.024 ± 0.015 |
— |
0.025 ± 0.016 |
0.016 ± 0.009 |
0.012 ± 0.006 |
— |
0.023 ± 0.015 |
0.056 ± 0.014 |
T1/2ka (min) |
66.17 ± 28.36 |
13.85 ± 4.70 |
38.58 ± 22.37 |
— |
37.17 ± 17.28 |
48.38 ± 22.77 |
64.14 ± 21.76 |
— |
43.29 ± 25.80 |
13.00 ± 3.67 |
ke (min) |
0.006 ± 0.002 |
0.011 ± 0.007 |
0.007 ± 0.003 |
— |
0.005 ± 0.003 |
0.010 ± 0.004 |
0.005 ± 0.003 |
— |
0.006 ± 0.003 |
0.013 ± 0.009 |
T1/2ke (min) |
121.03 ± 53.35 |
102.16 ± 72.75 |
128.90 ± 74.19 |
— |
200.74 ± 105.71 |
79.06 ± 26.45 |
179.51 ± 96.74 |
— |
166.11 ± 95.06 |
75.65 ± 51.43 |
Tmax (min) |
66.00 ± 31.10 |
47.14 ± 16.04 |
94.29 ± 32.07 |
— |
78.75 ± 34.72 |
120.00 ± 84.85 |
53.57 ± 31.05 |
— |
65.63 ± 34.89 |
23.75 ± 7.50 |
MRT (min) |
282.04 ± 15.87 |
146.02 ± 85.60 |
165.48 ± 56.13 |
— |
181.89 ± 78.10 |
184.75 ± 35.81 |
285.25 ± 69.51 |
— |
270.74 ± 81.92 |
116.77 ± 65.12 |
Vd (mL kg−1) |
274.13 ± 242.72 |
109.94 ± 72.80 |
4.12 ± 3.43 |
— |
9.64 ± 8.85 |
1.58 ± 0.89 |
94.94 ± 28.34 |
— |
39.90 ± 14.92 |
26.94 ± 11.15 |
CL (mL min−1 kg−1) |
1.38 ± 0.53 |
0.92 ± 0.69 |
0.02 ± 0.01 |
— |
0.03 ± 0.02 |
0.01 ± 0.00 |
0.41 ± 0.12 |
— |
0.19 ± 0.07 |
0.31 ± 0.15 |
3.4. In vitro anti-butyrylcholinesterase assays
The butyrylcholinesterase inhibition ratios–time curves of plasma samples after intravenously administration 2 mg kg−1 VAS was shown in Fig. 6. A Pearson correlation analysis was processed in concentration of analytes and inhibition ratios at each sampling time point by SPSS 18.0 (Fig. 7). It was found that there is a high positive correlation between VAS plasma levels and inhibition ratios (correlation factor of 0.981, Fig. 7A). Moreover, no or low correlation were displayed with the metabolites (Fig. 7B–E). It indicated that the in vivo BChE inhibitory activity was mainly related to the concentration of VAS and few related to the concentration of metabolites. The AChE inhibitory activities of plasma samples were also evaluated (data no show), but no AChE inhibitory activities were determined in these plasma samples. It might be related to VAS and its metabolites general have stronger inhibitory activities against BChE than that of AChE.9 In other words, the concentrations of VAS or its metabolites in plasma samples were too low to produce potent AChE inhibitory activities.
 |
| Fig. 6 Mean plasma concentration and butyrylcholineasterase inhibition ratio–time curves of VAS and its metabolites VAO, VAOS, VASS and VASG in rats plasma after intravenously administration of VAS (2 mg kg−1, n = 8, mean ± SD). | |
 |
| Fig. 7 The correlation analysis of mean plasma concentration and butyrylcholineasterase inhibition ratio of VAS (A) and its metabolites VAO (B), VAOS (C), VASS (D) and VASG (E) in rats plasma after intravenously administration of VAS (2 mg kg−1, n = 8). | |
4. Conclusion
The UPLC-MS/MS method was developed and validated for the simultaneous determination of VAS and its eleven metabolites (quantitative for VAO, VAOS, VASS, VASG, VAS, VASL and VAOL and semi quantitative for VAOG, MVAS1, MVAS2, HVAS1 and HVAS2) in plasma. This method achieved a proper separation for analytes and IS within 7 min by gradient elution on an HSS T3 column without any matrix effect. The established method was sufficiently conducted the pharmacokinetic study of VAS and its metabolites after oral administration 5, 15, 45 mg kg−1 and intravenous administration 2 mg kg−1 of VAS. BChE inhibition assays of plasma indicated that in vivo BChE inhibitory activity was mainly attributed to VAS and a few to its related metabolites.
Acknowledgements
The authors gratefully acknowledge the award from the Key Projects of Joint Funds of the National Natural Science Foundation of China and Xinjiang Uygur Autonomous Region of China (No. U1130303), the National Natural Science Foundation of China (Grant 81173119), the National Science & Technology Major Project “Key New Drug Creation and Manufacturing Program”, China (Grants 2012ZX0910320-051, 2012ZX09505001-002), and the Program of Shanghai Subject Chief Scientist (13XD1403500) awarded to professor Chang-hong Wang for financial support of this study.
References
- X. Y. Zheng, L. Zhang, X. M. Cheng, Z. J. Zhang, C. H. Wang and Z. T. Wang, J. Planar Chromatogr.--Mod. TLC, 2011, 24, 470–474 CrossRef CAS.
- T. Zhao, K. M. Ding, L. Zhang, X. M. Cheng, C. H. Wang and Z. T. Wang, J. Chem., 2013 DOI:10.1155/2013/717232.
- W. Liu, Y. D. Yang, X. M. Cheng, C. Gong, S. P. Li, D. D. He, L. Yang, Z. T. Wang and C. H. Wang, J. Pharm. Biomed. Anal., 2014, 94, 215–220 CrossRef CAS PubMed.
- W. Liu, X. M. Cheng, Z. T. Wang and C. H. Wang, Int. J. Pharm. Res., 2013, 40, 386–395 CAS.
- W. Liu, X. M. Cheng, Y. L. Wang, S. P. Li, T. H. Zheng, Y. Y. Gao, G. F. Wang, S. L. Qi, J. X. Wang, J. Y. Ni, Z. T. Wang and C. H. Wang, J. Ethnopharmacol., 2015, 162, 79–86 CrossRef PubMed.
- W. Liu, X. M. Cheng, Y. L. Wang, S. P. Li, T. H. Zheng, Y. Y. Gao, G. F. Wang, S. L. Qi, J. X. Wang, J. Y. Ni, Z. T. Wang and C. H. Wang, Phytomedicine, 2015, DOI:10.1016/j.phymed.2015.08.005.
- S. B. Rachana, P. Mamta, K. M. Priyanka and S. Sonam, Indo Global J. Pharm. Sci., 2011, 1, 85–98 CAS.
- T. Vyas, R. P. Dash, S. Anandjiwala and M. Nivsarkar, Fitoterapia, 2011, 82, 446–453 CrossRef CAS PubMed.
- W. Liu, X. Y. Shi, Y. D. Yang, X. M. Cheng, Q. Liu, H. Han, B. H. Yang, C. Y. He, Y. L. Wang, B. Jiang, Z. T. Wang and C. H. Wang, PLoS One, 2015, 10, e0122366, DOI:10.1371/journal.pone.0122366.
- A. C. Suthar, K. V. Katkar, P. S. Patil, P. D. Hamarapurkar, G. Mridula, V. R. Naik and V. S. Chauhan, J. Pharma Res., 2009, 2, 1893–1899 CAS.
- R. K. Patel, R. J. Kanani, V. R. Patel and M. G. Patel, Int. J. Pharm. Res., 2010, 2, 14–17 CAS.
- H. Pulpati, Y. S. Biradar and M. Rajani, J. AOAC Int., 2008, 91, 1179–1185 CAS.
- B. Avula, S. Begum, S. Ahmed, M. I. Choudhary and I. A. Khan, Int. J. Pharm. Pharm. Sci., 2008, 63, 20–22 CAS.
- L. Liu, T. Zhao, X. Cheng, C. H. Wang and Z. T. Wang, Acta Chromatogr., 2013, 25, 221–240 CrossRef CAS.
- G. Madhukar, P. R. Ennus Tajuddin Tamboli, S. H. Ansari, M. Z. Abdin and A. Sayeed, Pharmacogn. Mag., 2014, 10, S198 CrossRef PubMed.
- S. Noble, D. Neville and R. Houghton, J. Chromatogr. B: Biomed. Sci. Appl., 2014, 947, 173–178 CrossRef PubMed.
- US Food and Drug Administration (FDA), Guidance for Industry: Bioanalytical Method Validation (Draft Guidance), Center for Drug Evaluation and Research (CDER), 2013 Search PubMed.
- C. H. Wang, Y. Li, J. Gao, Y. Q. He, A. Z. Xiong, L. Yang and Z. T. Wang, Anal. Bioanal. Chem., 2011, 401, 275–287 CrossRef CAS PubMed.
- K. Banerjee, S. Utture, S. Dasgupta, C. Kandaswamy, S. Pradhan, S. Kulkarni and P. Adsule, J. Chromatogr. A, 2012, 1270, 283–295 CrossRef CAS PubMed.
- M. Sulyok, R. Krska and R. Schuhmacher, Anal. Bioanal. Chem., 2007, 389, 1505–1523 CrossRef CAS PubMed.
- Z. Z. Liu, L. H. Zhang, P. Ju, P. Y. Hou, Y. Y. Zhang, X. Tang, K. S. Bi and X. H. Chen, J. Chromatogr. B: Biomed. Sci. Appl., 2014, 947, 132–138 CrossRef PubMed.
- Y. Liang, H. P. Hao, A. Kang, L. Xie, T. Xie, X. Zheng, C. Dai, L. R. Wan, L. S. Sheng and G. J. Wang, J. Chromatogr. A, 2010, 1217, 4971–4979 CrossRef CAS PubMed.
|
This journal is © The Royal Society of Chemistry 2015 |
Click here to see how this site uses Cookies. View our privacy policy here.