DOI:
10.1039/C5RA12543J
(Paper)
RSC Adv., 2015,
5, 85606-85612
Combined experimental and theoretical insight into the drug delivery of nanoporous metal–organic frameworks†
Received
29th June 2015
, Accepted 25th September 2015
First published on 25th September 2015
Abstract
Two isostructural nanoporous MOFs with [Zn3(μ3-O)(BTC)2(H3O)]n (NTU-Z11) and {[Zn3(μ3-O)(BTC)2(DMF)]·2NH2(CH3)2·4H2O}n (GDMU) (BTC = 1,3,5-benzenetricarboxylate) have been used as drug carriers of 5-fluorouracil (5-FU). The incorporation of 5-FU into the desolvated NTU-Z11 and GDMU was around 0.38 g g−1 and 0.22 g g−1, respectively. NTU-Z11 presents pH-triggered controlled drug release properties in pH 6.0, 7.4 and 9.18 and water media. In addition, we performed GCMC simulations to investigate the loading of 5-FU into NTU-Z11 and GDMU at the molecular level. The results from simulations reproduce the experimental trend with respect to the drug loading capacity of each material. A comparison between the calculated drug loading values and some molecular level properties indicates the existence of a relationship between the void space of the material and the drug loading capacity.
Introduction
Porous metal–organic frameworks (MOFs) have been particularly highlighted for their excellent gas-storage and catalysis properties.1–3 Recently, tremendous efforts on MOF carriers have been made to boost their way toward medical applications.4–8 Férey’s group first described the potential loading and release properties of some drugs on MOFs,9 whereas Lin et al. have constructed a Pt-based drug at the nanoscale by using it as one building block to create a new coordination polymer.10 Horcajada and his co-workers also reported that porous MOFs can load and release drugs, acting as promising non-toxic drug carriers.11
Zhang and his co-workers reported a facile route to synthesize a series of NTU-based MOFs.12 NTU-Z11 is the isostructure of MOF-38 and can be repeatedly synthesized with a high yield;13 moreover, its channels are empty and have a dimension of about 11.5 × 11.5 Å. Inspired by these work, our strategy is to explore a neutral MOF whose structural features are similar to NTU-Z11. Unfortunately, only a negative GDMU was obtained but we are still interested in developing the loading and release properties of 5-FU on the two MOFs because the efficiency of the drug delivery is related to the pore characteristics and the nature of the host–guest interactions. GCMC simulation is a powerful technique to explain and predict gas adsorption onto porous materials. However, it is still a challenge to use GCMC simulations to investigate the loading of large molecules onto porous materials due to the requirement of the conformational sampling and tight interaction of such molecules in pores.14–16
Herein, we demonstrate two Zn(II)-based frameworks with additional negative charges that have been used as drug carriers of 5-FU. The amount of 5-FU incorporated into the desolvated NTU-Z11 and GDMU was around 0.38 g g−1 and 0.22 g g−1, respectively. NTU-Z11 presents pH-triggered controlled drug release properties in pH 6.0, 7.4 and 9.18 and water media. In addition, we performed GCMC simulations to investigate the loading of 5-FU into NTU-Z11 and GDMU at the molecular level. A comparison between the calculated drug loading values and some molecular level properties indicates the existence of an important relationship between the void space of the material and the drug loading capacity.
Materials and method
All reagents were purchased from commercial sources and used as received. IR spectra were recorded with a Perkin-Elmer Spectrum One spectrometer in the region 4000–400 cm−1 using KBr pellets. TGA was carried out with a Metter-Toledo TA 50 instrument under a dry dinitrogen flux (60 mL min−1) at a heating rate of 5 °C min−1. X-ray powder diffraction (PXRD) data were recorded on a Rigaku RU200 diffractometer at 60 kV and 300 mA for Cu Kα radiation (λ = 1.5406 Å), with a scan speed of 2 °C min−1 and a step size of 0.02° in 2θ.
X-ray crystallography
Single crystal X-ray diffraction analyses of the two compounds were carried out on a Bruker SMART APEX II CCD diffractometer equipped with graphite monochromated Mo Kα radiation (λ = 0.71073 Å) using the ϕ/ψ scan technique at room temperature. The intensities were corrected for Lorentz and polarization effects as well as for empirical absorption based on multi-scan techniques; all structures were solved by direct methods and refined by full-matrix least-squares fitting on F2 by SHELX-97.17 Absorption corrections were applied using multi-scan program SADABS.18 Non-hydrogen atoms were refined anisotropically. The structure contains large (37% volume) regions of intensely disordered cations and solvent. These were impossible to model at atomic resolution and their presence in the structure is assumed on the basis of the elemental analysis, TGA and the PLATON/SQUEEZE calculations.19 The latter were used to calculate the diffraction contribution of the solvent molecules and, thereby, to produce a set of solvent-free diffraction intensities for the refinement of the MOF structure. Crystallographic data for complexes GDMU are given in Table 1. Selected bond distances and bond angles are listed in Table 2. CCDC: 1405443 for GDMU.
Table 1 Crystal data and structure refinement information for compound GDMU
R = ∑(Fo − Fc)/∑(Fo). wR2 = {∑[w(Fo2 − Fc2)2]/∑(Fo2)2}1/2. |
Crystal system |
Tetragonal |
Space group |
I4cm |
Crystal color |
Colorless |
a, Å |
20.5138(10) |
c, Å |
17.8100(8) |
Γ |
90 |
V, Å3 |
7494.7(8) |
Z |
8 |
ρcalcd, g cm−3 |
1.531 |
F(000) |
3536 |
θ range, deg |
2.49–27.92 |
Reflns collected/unique (Rint) |
21 512/4425 (0.0299) |
GOF |
1.092 |
R1, wR2 (I > 2σ(I))a |
0.0319, 0.0900 |
R1, wR2 (all data)b |
0.0357, 0.0924 |
Table 2 Selected bond distances (Å) and angles (deg) of the structure GDMU
Zn1–O1 |
1.945(4) |
Zn1–O8 |
1.9458(17) |
Zn1–O4 |
1.969(3) |
Zn1–O5 |
1.972(3) |
Zn2–O7 |
2.059(5) |
Zn2–O3 |
2.091(3) |
Zn2–O3 |
2.091(3) |
Zn2–O8 |
2.103(4) |
Zn2–O6 |
2.106(3) |
Zn2–O6 |
2.106(3) |
O1–Zn1–O8 |
113.76(18) |
O1–Zn1–O4 |
123.14(16) |
O8–Zn1–O4 |
105.27(16) |
O1–Zn1–O5 |
103.53(16) |
O8–Zn1–O5 |
103.27(17) |
O4–Zn1–O5 |
105.86(18) |
O7–Zn2–O3 |
86.24(14) |
O3–Zn2–O3 |
97.10(17) |
O7–Zn2–O8 |
171.1(2) |
O3–Zn2–O8 |
87.85(12) |
O3–Zn2–O8 |
87.85(12) |
O7–Zn2–O6 |
91.29(15) |
O3–Zn2–O6 |
173.17(14) |
O3–Zn2–O6 |
89.08(15) |
Syntheses of these complexes
[Zn3(μ3-O)(BTC)2(H3O)]n (NTU-Z11). We synthesized NTU-Z11 according to the literature procedure.12 The sample purity was confirmed by PXRD.
{[Zn3(μ3-O)(BTC)2(DMF)]·2NH2(CH3)2·4H2O}n (GDMU). A mixture of Zn(NO3)2·6H2O (0.450 g, 0.1 mmol), (4,4′-bis(pyrid-4-yl)biphenyl) (0.015 g, 0.04 mmol), and H3BTC (0.450 mg, 0.2 mmol) in DMF (4 mL) was placed in a screw-capped vial. Then five drops of HNO3 was added into the mixture. The vial was capped and placed in an oven at 110 °C for 3 days. The resulting colorless single crystals were washed with absolute CH3CH2OH three times to give 1. Anal. calcd for C25H37N3O18Zn3 (863.68), C, 34.77; H, 4.32; N, 4.87. Found C, 34.28; H, 4.15; N, 4.55. IR (KBr, cm−1): 3480(vs); 2940(m); 1632(vs); 1428(v); 1390(v); 1099(m); 938(m); 708(v); 547(m).
Computational details
The adsorption of 5-FU into NTU-11 and GDMU was studied using grand canonical ensemble Monte Carlo (GCMC) simulations, employing the RASPA code at 298 K.20 The structures of 5-FU and the MOFs are described with an all-atom model in this work. The structures for 5-FU and the MOFs can be found in Fig. S1 and S2.† For the MOF structures, the framework atoms were kept rigid during the simulations. The guest–guest and guest–host interactions were computed with a Lennard-Jones (LJ) and coulombic potential. The Antechamber program AmberTools1.27 was used to generate the force field for 5-FU with the general amber force field parameters.21 The atomic partial charges for 5-FU were computed with the CHELPG method based on the Gaussian 03 suite with the 6-31++g* basis set. The Lennard-Jones parameters and partial charges can be found in Tables S1–S3.†
The atomic positions of the NTU-Z11 and GDMU structures were taken from the PXRD data (the Rietveld refinement for the 5-FU@MOF complexes was performed with the software GSAS/EXPGUI, using the X-ray structure of the MOF for the initial atomic coordinates). The cations of H3O+ and NH2(CH3)2+ are included in NTU-Z11 and in GDMU, respectively. The cations of NH2(CH3)2+ were not removed in the uptake of 5-FU. Thus we also did not remove these molecules in these simulated structures. The Lennard-Jones parameters for the MOF structure atoms were taken from the UFF force field (listed in Table S2†).22 The accurate prediction of adsorption in various MOFs could be achieved by a number of simulation investigations using the UFF force field.23,24 The molecular geometries for cations were optimized by DFT. In the canonical ensemble, the desired number of cations were inserted into the pore and acceleration of the equilibrium with reinsertion-move was attempted. The obtained configurations were used to simulate the adsorption of 5-FU in the MOFs. The solvent molecules of the MOFs in the simulations are allowed to move (including translation and rotation).
The heats of adsorption were computed using the equation:
where 〈 〉 refers to the average over the simulation, and
U is the energy,
N is the number of adsorbed molecules.
The interactions of unlike sites were computed with Lorentz–Berthelot mixing rules. The Lennard-Jones interactions were cut and shifted at 13 Å. The partial charges of the NTU-Z11 and GDMU atoms were computed from density functional theory (DFT) with the B3LYP functional. For the metal atoms, the LanL2DZ basis set was applied. The 6-31++g* basis set was used to optimize all other atoms. The atomic partial charges can be obtained by fitting the electrostatic potentials after the DFT computation. The coulombic interactions were computed using the Ewald sum technique. The details of simulated boxes are listed in Table S4.† After the initial 106 Monte Carlo (MC) cycles, the production of 106 cycles was used to compute the ensemble average properties. For each cycle, the MC moves include the molecules of insertion, deletion, translation, rotation or regrowth. We used equal probability for each MC move.
Results and discussion
[Zn3(μ3-O)(BTC)2(H3O)]n (NTU-Z11) and {[Zn3(μ3-O)(BTC)2(DMF)]·2NH2(CH3)2·4H2O}n (GDMU)
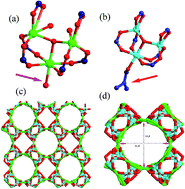
NTU-Z11 and GDMU are isostructural and are composed of the [Zn3(μ3-O)(COO)6] subunits (Fig. 1a and b). The subunits are connected by BTC ligands, which results in an infinite 3-D (3,6)-connected framework with 1-D channel of about 11.5 × 11.5 Å dimensions along the c-axis (Fig. 1c and d) but we should state herein, if the L was absent in this reactive system, the final product of GDMU could not be obtained. Furthermore, the pores of GDMU were occupied by the NH2(CH3)2 and DMF molecules. This structural feature was also similar to MOF-38, which holds some disordered HTEA molecules. However, the MOF-38 cannot be repeated as mentioned in the literature.13
 |
| Fig. 1 (a) The geometries of metals and ligands in NTU-Z11; (b) view of the geometries of the metal and ligands in GDMU; (c) view of the 3D frameworks and (c) the larger hexagonal channel in the MOFs. | |
Thermogravimetric analyses
The thermogravimetric analysis (TGA) of complex GDMU was performed (Fig. S3†). It shows three weight loss steps. The first weight loss begins at 25 °C and is completed at 80 °C. The observed weight loss of 8.6% corresponds to the loss of the free water molecules (calcd 8.3%). The second weight loss occurs next, and can be attributed to the elimination of NH2(CH3)2 cations (obsd 9.5%; calcd 10.4%). A gradual weight loss from 210 °C indicates that the complex decomposes continuously when the temperature is raised. The mass remnant at ∼700 °C of 25.4% is roughly consistent with the deposition of ZnO (calcd 28.3%) (a weight loss of 4.0% is larger than the calculated value, probably resulting from the sensitivity to temperature and humidity or a very slow absorbability of the guest molecules from the air at room temperature).
Both NTU-Z11 and GDMU were desolvated at 120 °C for 10 h prior to insertion of the drug. As confirmed by PXRD and TGA, the 5-FU-containing sample maintains its crystallinity (Fig. S3 and S4†) and thus, the drug encapsulation did not alter the structure of these materials. Only a decrease in the intensity of the low angle reflections on the PXRD patterns (∼5–8° 2θ) was observed after encapsulation, following the change in pore content that is known to strongly affect the relative intensities of the Bragg peaks2b. This was confirmed by N2 adsorption analysis showing that the BET surface area significantly decreases upon the loading of the drug molecules (see ESI Fig. S5†).
Incorporation of the drug molecule during the loading process has been recorded by Fourier transform infrared spectroscopy (FTIR) (Fig. S6†). The absorption bands of C–F deformations were discovered in the 820–550 cm−1 regions. The absorption band at about 1240 cm−1 may be due to fluorine atoms on the ring.25,26 Based on the above structural analyses, these two compounds may be taken as good drug carriers. The loading of anticancer compound 5-FU was carried out by impregnating NTU-Z11 and GDMU under stirring in 5-FU-containing ethanol solutions.
UV-vis absorption spectroscopy was used to determine the effective storage capacity. To reach a maximal drug loading, the 5-FU to porous solid relative ratio and the contact time were evaluated (Table S5†).6 The loading amount of 5-FU increased as the initial 5-FU/material weight ratio decreased and optimal values of 1
:
1 and 1
:
3 were identified for NTU-Z11 and GDMU in ethanol, respectively. The contact time was also important; the maximum adsorption was obtained after 2 days and 3 days for NTU-Z11 and GDMU, respectively. Thus, the best results were obtained when NTU-Z11 was soaked for 2 days with a 5-FU to material weight ratio of 1
:
1, while GDMU was soaked for 3 days with a 5-FU to material weight ratio of 1
:
3. 5-FU was incorporated into desolvated NTU-Z11 and GDMU with loadings of 0.382 and 0.206 g g−1, respectively. The difference between NTU-Z11 and GDMU shows that the NH2(CH3)2 acts as a gate and blocks the drug molecule’s access to the inner pores.27
Fig. 2 shows the release profile of the drug delivery system of NTU-Z11 and GDMU in PBS solution at 37 °C. In the first stage (24 hours), NTU-Z11 and GDMU have similar releasing behavior and approximately 65% of the drug was released. However, the next stage showed a gradual release for GDMU, implying a strong host–guest interaction was involved in this process. Compared with the NTU-Z11 carrier, there is a big cation in the host channels in GDMU, which can act as a donor/acceptor and bind to drug molecules resulting in the dramatic releasing behavior. Thus, 5-FU with a flat molecular shape diffuses along the hexagonal channels. Similar results were also found in MIL-53 with a pore size of 8.6 Å, which exhibited a drug loading capacity of 0.22 g g−1 for the drug IBU (IBU = ibuprofen).3
 |
| Fig. 2 The release process of 5-FU from the drug-loaded GDMU and NTU-Z11 (% 5-FU vs. time). | |
To further explore the pH-responsive drug release properties of NTU-Z11, the release profiles were assessed in pH 6.0 and 9.18 and water media. Around 62.5% of the loaded 5-FU was released fast within 24 h, and 63.1% was released within 30 h. More than 40% of 5-FU was released in around one hour, which is consistent with the dissolution of NTU-Z11 in an acidic environment. Compared with other MOF carriers,28 NTU-Z11 shows a fast release rate for 5-FU. In the water media, the release profile of 5-FU exhibits a flat shape and no burst effect occurs. The delivery of 5-FU occurred within 96 h and 47% of the loaded drug was released. However, three stages related to the drug release could be distinguished at pH 9.18; around 48% of the loaded drug was released in the first stage (33 h) and not more than 10% of the loaded drug was released after this. Thus, a rapid releasing process was observed during the first stage followed by a slower release at high pH. These results imply that the loaded drug can be decreased during blood circulation and the drug release rate is suddenly accelerated after release into cancer cells.25,29
Computational simulations of 5-FU adsorption
The amount of drug to porous material or the drug loading is one of the main quantities of interest in the use of MOFs for controlled drug release.30 We have used GCMC simulations to investigate the loading of 5-FU into the two compounds at the molecular level. These simulations were used to determine the preferential binding sites of 5-FU in the porous materials, to estimate the maximum drug loading capacity of each material, and propose a molecular mechanism for drug loading and release.
Adsorption isotherm of 5-FU in MOFs
We calculated the adsorption isotherms of 5-FU in NTU-Z11 and GDMU at 298 K. As observed in Fig. 3, there are some differences between NTU-Z11 and GDMU. NTU-Z11 has a much higher saturation capacity for 5-FU, which is about 0.4 g g−1. The saturation capacity is around 0.22 g g−1 for GDMU. The bigger molecules of GDMU result in a low saturation capacity compared to that of NTU-Z11. Also, GDMU shows a saturation uptake at the low fugacity range due to the stronger 5-FU–MOF interactions. The presence of stronger interactions due to the existence of cations in GDMU strengthens the host–guest interactions and results in the steep adsorption of 5-FU at lower fugacity compared to that in NTU-Z11.
 |
| Fig. 3 (a) and (b) The calculated adsorption isotherms of 5-FU in NTU-Z11 and GDMU at 298 K, respectively. | |
Heat of adsorption
The heats of adsorption (Qst) for 5-FU in NTU-Z11 and GDMU are shown in Fig. 4. The heat of adsorption is closely related to the pore structure, which could be taken as an index of the adsorption material’s heterogeneity.30 Fig. 4 shows Qst for NTU-Z11 and GDMU as a function of the uptake. As shown in Fig. 4, NTU-Z11 shows a low Qst (about 120–150 kJ mol−1) for the loading process. This observation shows that the 5-FU molecules can load into the MOF pores with strong interactions. The stronger interaction results in the higher adsorption heat of 5-FU in GDMU than that in NTU-Z11 because of the presence of DMF in GDMU. The GDMU shows a higher Qst (160–228 kJ mol−1) in the range of loadings. The medicinal molecules can be strongly retained in the MOF structures due to the high Qst for the loadings and this is very favorable for the long release process. GDMU shows higher Qst values than NTU-Z11 at high loadings, with important contributions of the solvent molecules. The results are consistent with the experimental release process.
 |
| Fig. 4 (a) and (b) The calculated heats of adsorption of 5-FU in NTU-Z11 and GDMU at 298 K, respectively. | |
Density plots
NTU-Z11 consists of the trimeric SBU and BTC ligands. The 3-D framework has two channel systems with dimensions of 7.5 × 7.5 Å (referred to as A) and 11.5 × 11.5 Å (referred to as B) along the c-axis. As shown in Fig. 5, the 5-FU molecules are primarily distributed in two favorable regions. The 5-FU loading is closely packed in the pores because the solvent molecules have a smaller size in the A region. The bigger cations present in GDMU hinder the adsorption of 5-FU in the A region. Then the adsorption of 5-FU in NTU-Z11 increases with the increase of fugacity. However, the adsorption of 5-FU in GDMU rapidly approaches to a platform at the same range of fugacity.
 |
| Fig. 5 The density of 5-FU in GDMU at 298 K: (a) 10−9 mPa, (b) 10−7 mPa (above); and the density of 5-FU in NTU-Z11 at 298 K: (a) 10−9 mPa, (b) 10−7 mPa (below). | |
Conclusion
In summary, two isostructural nanoporous MOFs were used to load the anti-cancer chemotherapy drug 5-FU and demonstrated a remarkably different capacity due to their various pore spaces. Owing to the pH-sensitive properties of NTU-Z11, it was observed that it released much faster in mildly acidic buffer solution than in a neutral medium, suggesting that this pH-triggered feature may be a useful property for drug delivery to tumors. The GCMC simulations suggested that the anti-cancer drug 5-FU could load into NTU-Z11 with a high loading capacity. Our findings indicate that the combined experimental–computational approach is a powerful strategy for the efficient identification and incorporation of bioactive compounds in porous materials.
Acknowledgements
This work was partially supported by grants from the National Natural Science Foundation of China (21201044, 21401143 and 20806064), Science and Technology Project of Anhui Province (Grants 1206c0805031 and 1406c085021), Shaanxi Province science and technology key projects (2011K12-03-01). Y. Z. acknowledges funding from the Natural Science Foundation of Jiangsu Province, China (BK20131227). Generous allocations of computer time were provided by the ScGrid plan of Supercomputing center of CAS and Testing Center of Yangzhou University and a Project funded by the Priority Academic Program Development of Jiangsu Higher Education Institutions and thanks for Prof. S. W. Ng for refinement of structural data.
References
-
(a) Q. Zhai, Q. Lin, T. Wu, L. Wang, S. Zheng, X. Bu and P. Feng, Chem. Mater., 2012, 24, 2624 CrossRef CAS;
(b) Y. J. Cui, Y. F. Yue, G. D. Qian and B. L. Chen, Chem. Rev., 2012, 112, 1126 CrossRef CAS PubMed.
-
(a) J.-P. Zhang, Y.-B. Zhang, J.-B. Lin and X.-M. Chen, Chem. Rev., 2012, 112, 1001 CrossRef CAS PubMed;
(b) B. Chen, L. Wang, Y. Xiao, F. R. Fronczek, M. Xue, Y. Cui and G. Qian, Angew. Chem., Int. Ed., 2009, 48, 500 CrossRef CAS PubMed.
- G. Férey, C. Mellot-Draznieks, C. Serre and F. Millange, Acc. Chem. Res., 2005, 38, 217 CrossRef PubMed.
- C. Wu and W. Lin, Angew. Chem., Int. Ed., 2007, 46, 1075 CrossRef CAS PubMed.
- J. Zhuang, C. H. Kuo, L. Y. Chou, D. Y. Liu, E. Weerapana and C. K. Tsung, ACS Nano, 2014, 8, 2812 CrossRef CAS PubMed.
- P. Horcajada, C. Serre, G. Maurin, N. A. Ramsahye, F. Balas, M. Vallet-Regi, M. Sebban, F. Taulelle and G. Ferey, J. Am. Chem. Soc., 2008, 130, 6774 CrossRef CAS PubMed.
- G. Férey, Chem. Soc. Rev., 2008, 37, 191 RSC.
- K. M. L. Taylor, A. Jin and W. B. Lin, Angew. Chem., 2008, 120, 7836 CrossRef PubMed.
- P. Horcajada, C. Serre, M. Vallet-Regi, M. Sebban, F. Taulelle and G. Férey, Angew. Chem., 2006, 118, 6120 CrossRef PubMed.
- K. M. L. Taylor-Pashow, J. D. Rocca, Z. G. Xie, S. Tran and W. B. Lin, J. Am. Chem. Soc., 2009, 131, 14261 CrossRef CAS PubMed.
- P. Horcajada, T. Chalati, C. Serre, B. Gillet, C. Sebrie, T. Baati, J. F. Eubank, D. Heurtaux, P. Clayette, C. Kreuz, J. S. Chang, Y. K. Hwang, V. Marsaud, P. N. Bories, L. Cynober, S. Gil, G. Ferey, P. Couvreur and R. Gref, Nat. Mater., 2010, 9, 172 CrossRef CAS PubMed.
- J. K. Gao, K. Q. Ye, L. Yang, W. W. Xiong, L. Ye, W. Wang and Q. C. Zhang, Inorg. Chem., 2014, 53, 691 CrossRef CAS PubMed.
- J. Kim, B. Chen, T. M. Reineke, H. Li, M. Eddaoudi, D. B. Moler, M. O’Keeffe and O. M. Yaghi, J. Am. Chem. Soc., 2001, 123, 8239 CrossRef CAS PubMed.
- T. Düren, L. Sarkisov, O. M. Yaghi and R. Q. Snurr, Langmuir, 2004, 20, 2683 CrossRef.
- Q. Yang, C. Zhong and J. F. Chen, J. Phys. Chem. C, 2008, 112, 1562 CAS.
- T. Düren, Y. S. Bae and R. Q. Snurr, Chem. Soc. Rev., 2009, 38, 123 RSC.
- G. M. Sheldrick, Acta Crystallogr., Sect. A: Found. Crystallogr., 2008, 64, 112 CrossRef CAS PubMed.
- G. M. Sheldrick, SAINT Software reference Manual, Bruker AXS, Madison, WI, 1998 Search PubMed.
- A. L. Spek, J. Appl. Crystallogr., 2015, 71, 9 CAS.
- D. Dubbeldam, S. Calero, D. E. Ellis and R. Q. Snurr, Mol. Simul., 2015, 1, 1 Search PubMed.
- D. A. Case, T. A. Darden III, T. E. Cheatham, C. L. Simmerling, J. Wang, R. E. Duke, R. Luo, R. C. Walker, W. Zhang, K. M. Merz, B. Roberts, B. Wang, S. Hayik, A. Roitberg, G. Seabra, I. Kolossvai, K. F. Wong, F. Paesani, J. Vanicek, J. Liu, X. Wu, S. R. Brozell, T. Steinbrecher, H. Gohlke, Q. Cai, X. Ye, J. Wang, M. J. Hsieh, G. Cui, D. R. Roe, D. H. Mathews, M. G. Seetin, C. Sagui, V. Babin, T. Luchko, S. Gusarov, A. Kovalenko and P. A. Kollman, AMBER 11, University of California, San Francisco, 2010 Search PubMed.
- A. K. Rappe, C. J. Casewit, K. S. Colwell, W. A. Goddard III and W. M. Skiff, J. Am. Chem. Soc., 1992, 114, 10024 CrossRef CAS.
- K. M. Gupta, Y. Chen and J. Jiang, J. Phys. Chem. C, 2013, 117, 5792 CAS.
- C. E. Wilmer, K. C. Kim and R. Q. Snurr, J. Phys. Chem. Lett., 2012, 3, 2506 CrossRef CAS PubMed.
- C. Y. Sun, C. Qin, X. L. Wang, G. S. Yang, K. Z. Shao, Y. Q. Lan, Z. M. Su, P. Huang, C. G. Wang and E. B. Wang, Dalton Trans., 2012, 41, 6906 RSC.
- C. Y. Sun, C. Qin, C. G. Wang, Z. M. Su, S. Wang, X. L. Wang, G. S. Yang, K. Z. Shao, Y. Q. Lan and E. B. Wang, Adv. Mater., 2011, 23, 5629 CrossRef CAS PubMed.
- S. T. Meek, J. A. Greathouse and M. D. Allendorf, Adv. Mater., 2011, 23, 249 CrossRef CAS PubMed.
- P. Horcajada, C. Serre, M. Vallet-Regi, M. Sebban, F. Taulelle and G. Ferey, Angew. Chem., Int. Ed., 2006, 45, 5974 CrossRef CAS PubMed.
- S. F. Yan, J. Zhou, Z. C. Wang, J. B. Yin, Y. Z. Zheng and X. S. Chen, Eur. J. Pharm. Biopharm., 2011, 78, 336 CrossRef CAS PubMed.
- M. C. Bernini, D. Fairen-Jimenez, M. Pasinetti, A. J. Ramirez-Pastor and R. Q. Snurr, J. Mater. Chem. B, 2014, 2, 766 RSC.
Footnote |
† Electronic supplementary information (ESI) available. CCDC 1405443. For ESI and crystallographic data in CIF or other electronic format see DOI: 10.1039/c5ra12543j |
|
This journal is © The Royal Society of Chemistry 2015 |
Click here to see how this site uses Cookies. View our privacy policy here.