Effect of preparation of Fe–Zr–K catalyst on the product distribution of CO2 hydrogenation
Xiaojuan Su,
Jianli Zhang*,
Subing Fan,
Qingxiang Ma and
Tian-Sheng Zhao*
State Key Laboratory Cultivation Base of Natural Gas Conversion, College of Chemistry and Chemical Engineering, Ningxia University, Yinchuan 750021, People's Republic of China. E-mail: zhaots@nxu.edu.cn; zhangjl@nxu.edu.cn
First published on 7th September 2015
Abstract
The precursors of Fe–Zr–K catalysts were prepared by microwave assisted homogeneous precipitation followed by incipient wetness impregnation. The obtained mesoporous particles were small and uniformly shaped. After reduction, the catalyst showed high activity for the selective production of light olefins from CO2 hydrogenation, superior to the catalyst obtained by co-precipitation. Characterization indicated that with Zr addition, the reducibility, surface basicity and surface atomic composition of the samples varied with the Zr content. The CO2 adsorption ability of the samples was increased and the samples became hard to reduce as a result of the interaction between iron species and zirconia. In the case of using 5Fe–1Zr–K under selected conditions of 1000 h−1, 320 °C and 2 MPa, the CO2 conversion and the selectivity of C2–C4 olefins reached 54.36% and 53.63%. The olefin/paraffin ratio in the C2–C4 hydrocarbon product fraction reached 6.44. The selectivity of CO and C5+ hydrocarbons were 3% and 19.78%, respectively. The catalytic activity remained stable up to 92 h in time-on-stream reaction.
1. Introduction
The increase in CO2 emissions with industrialization, and the resulting greenhouse effect have given rise to ever-increasing concerns about the disposal of CO2. The chemical transformation of CO2 into other chemicals as an avenue for carbon recycling has attracted durative interest.1–6Compared with the H2/CO2–methanol-to-olefins process, direct synthesis of light olefins from CO2 hydrogenation avoids the methanol synthesis and is more cost-effective. Research suggests that CO2 hydrogenation to light olefins proceeds in two steps: reduction of CO2 to CO via the reverse water–gas shift (RWGS) reaction, followed by CO hydrogenation via the Fisher–Tropsch (F–T) reaction7,8 as follows:
| nCO2 + nH2 ↔ nCO + nH2O (RWGS) |
| nCO + 2nH2 → (CH2)n + nH2O (F–T) |
Various iron-based catalysts have been studied for this direct process9–21 because they are usually adopted in the industrial shift reaction as well as the F–T reaction.22 The catalysts' formulation and preparation procedures obviously affect their performance. Unpromoted iron-based catalysts exhibit high methane selectivity;9,10,19 however, the introduction of a potassium promoter results in the enhancement of the carburization of the iron species, formation of iron carbide active phases9 and selectivity of light olefins.15,19,20 Several structural supports and chemical promoters have been employed to improve the catalytic performance and to tailor the product distribution.11–18 Manganese stabilizes the Fe–K catalyst due to a higher resistance to bulk oxidation, but does not change the product distribution.11 Alumina supported Fe–K shows high conversion of CO2 and low selectivity of CO and methane at reaction temperature of 400 °C with the C5+ selectivity above 33%.12 γ-Al2O3 supported Fe–Mn–K lowers the formation of methane and increases the product ratio of olefin/paraffin.17 Zirconia supported K–Fe also displays higher selectivity of light olefins, whereas the CO selectivity was 15%.23 Up to the present time, the selectivity of CO or methane or both in CO2 hydrogenation still remains higher. Thus, further reduction of these two side products is desired.
Based on the two-step reaction mechanism of CO2 hydrogenation to light olefins, the formation of CO or methane may be reduced by tuning the rates of the two reactions. The F–T rate and the WGS rate were shown to be altered with water addition during the F–T synthesis reaction.24 A bifunctional catalyst of ceria modified Fe/Mn/K for olefin production from CO2 hydrogenation was reported with combining the RWGS and F–T chain growth activity.18 Zirconia alone provides adsorption sites for the surface reaction intermediates, and the catalytic behavior of metal/zirconia for CO2 hydrogenation is dependent on metal type and influenced by the interfacial contact area between the metal and zirconia.25 Methane formation is suppressed by H2O in the WGS reaction over Rh/Fe2O3/ZrO2.26 On the other hand, iron-based catalysts with higher surface areas from microemulsion technology exhibit higher activity for CO2 hydrogenation,14 and mesoporous xFeMnO by the sol–gel process enhances CO2 hydrogenation to C2–C5 hydrocarbons.21 With a faster reaction rate than the conventional heating, microwave assisted-homogeneous precipitation has shown potential in obtaining catalytic materials with desirable properties such as fine particles and good chemical homogeneity.27,28
In this study, to further understand the role of Zr promoters in iron catalysts for CO2 hydrogenation to light olefins, Fe–Zr–K catalysts were prepared using microwave assisted-homogeneous precipitation followed by incipient wetness impregnation methods. The effects of the added amounts of Zr on the structural properties of the precursors of Fe–Zr–K catalysts and on the activity for CO2 hydrogenation were investigated by means of physico-chemical characterization. The influencing mechanism of zirconia on iron catalysts in product selectivity and activity stability was correlated.
2. Experimental
2.1 Sample preparation
The Fe–Zr sample was prepared by the microwave-assisted homogeneous precipitation (MAHP) method with urea as the precipitator. The molar ratios of Fe/Zr included 7![[thin space (1/6-em)]](https://www.rsc.org/images/entities/char_2009.gif) :
:![[thin space (1/6-em)]](https://www.rsc.org/images/entities/char_2009.gif) 1, 5
1, 5![[thin space (1/6-em)]](https://www.rsc.org/images/entities/char_2009.gif) :
:![[thin space (1/6-em)]](https://www.rsc.org/images/entities/char_2009.gif) 1, 3
1, 3![[thin space (1/6-em)]](https://www.rsc.org/images/entities/char_2009.gif) :
:![[thin space (1/6-em)]](https://www.rsc.org/images/entities/char_2009.gif) 1 and 1
1 and 1![[thin space (1/6-em)]](https://www.rsc.org/images/entities/char_2009.gif) :
:![[thin space (1/6-em)]](https://www.rsc.org/images/entities/char_2009.gif) 1. The molar ratio of (Fe + Zr)/urea was 1
1. The molar ratio of (Fe + Zr)/urea was 1![[thin space (1/6-em)]](https://www.rsc.org/images/entities/char_2009.gif) :
:![[thin space (1/6-em)]](https://www.rsc.org/images/entities/char_2009.gif) 6. In the typical procedure, desired amounts of Fe(NO3)3·9H2O, ZrO(NO3)2·2H2O and urea were mixed in 200 mL of deionized water under stirring until complete dissolution. The solution was then transferred into a Teflon-lined sample holder and reacted under microwave conditions (2450 MHz, 500 W, 1.6 MPa, 170–180 °C) for 2 h. The product was separated via centrifugation, washed, and dried at 120 °C overnight and calcined at 500 °C in air for 3 h. The sample without Zr addition was prepared using the same procedure. For comparison, Fe–Zr samples were also prepared by co-precipitation with NH3·H2O as the precipitator and marked with suffix [C].
6. In the typical procedure, desired amounts of Fe(NO3)3·9H2O, ZrO(NO3)2·2H2O and urea were mixed in 200 mL of deionized water under stirring until complete dissolution. The solution was then transferred into a Teflon-lined sample holder and reacted under microwave conditions (2450 MHz, 500 W, 1.6 MPa, 170–180 °C) for 2 h. The product was separated via centrifugation, washed, and dried at 120 °C overnight and calcined at 500 °C in air for 3 h. The sample without Zr addition was prepared using the same procedure. For comparison, Fe–Zr samples were also prepared by co-precipitation with NH3·H2O as the precipitator and marked with suffix [C].
The Fe–Zr–K sample was prepared by incipient wetness impregnation in a fixed Fe/K molar ratio of 10![[thin space (1/6-em)]](https://www.rsc.org/images/entities/char_2009.gif) :
:![[thin space (1/6-em)]](https://www.rsc.org/images/entities/char_2009.gif) 1. The aqueous solution with the desired amount of K2CO3 was impregnated on the Fe–Zr sample, and then dried at 120 °C overnight. The obtained samples were named as 7Fe–1Zr–K, 5Fe–1Zr–K, 3Fe–1Zr–K, 1Fe–1Zr–K, Fe–K and 5Fe–1Zr–K[C].
1. The aqueous solution with the desired amount of K2CO3 was impregnated on the Fe–Zr sample, and then dried at 120 °C overnight. The obtained samples were named as 7Fe–1Zr–K, 5Fe–1Zr–K, 3Fe–1Zr–K, 1Fe–1Zr–K, Fe–K and 5Fe–1Zr–K[C].
2.2 Sample characterization
X-ray powder diffraction (XRD) patterns were recorded on a Rigaku D/MAX 2200PCX diffractometer with Ni-filtered Cu Kα radiation at 40 kV and 30 mA at scanning speed of 8° min−1.Scanning electron microscopy (SEM) images were obtained on a JEOL-JSM-7500F microscope at 1 kV.
N2 physical adsorption–desorption isotherms were measured at −196 °C on a JW-BK132F instrument after each sample was pretreated under vacuum at 300 °C for 2 h. The BET surface area was calculated from the adsorption branch. The mesopore and micropore parameter calculation was based on the BJH and HK models, respectively.
H2 temperature-programmed reduction (H2-TPR) measurements were carried out on a chemisorption analyzer (TP5000). In a typical procedure, a sample (20–40 mesh) of 70 mg was pretreated in a quartz tube at 350 °C in He (25 mL min−1) for 1 h and cooled to room temperature. Then, the sample was reduced by a mixed gas composed of 5% H2 and 95% N2 as the temperature increased from room temperature to 800 °C at a heating rate of 10 °C min−1. The H2 consumption was synchronously detected on a gas chromatograph with a thermal conductivity detector.
CO2 temperature-programmed desorption (CO2-TPD) was performed on the same TP5000. A 200 mg sample was pretreated at 400 °C for 3 h in a flow of 30% H2 and 70% N2 (30 mL min−1), and purged by He (25 mL min−1) for 1 h. CO2 was then pulse-adsorbed on the sample at 50 °C until saturation, followed by He purge for 1 h. Finally, the sample was heated in He (25 mL min−1) from room temperature to 800 °C at a heating rate of 10 °C min−1. The CO2 desorption amount was synchronously detected.
X-ray photoelectron spectra (XPS) were obtained on a Thermo SCIENTIFIC ESCALAB 250 equipped with an Al Kα X-ray source (h = 1486.8 eV) at 15 kV and 10 mA. The background vacuum of the analysis chamber was 2 × 10⁻⁹ mbar. The binding energies (BE) were calibrated using the C1s peak at 284.8 eV from adventitious carbon.
2.3 Catalytic activity evaluation
Activity tests were carried out in a flow type fixed-bed system with a stainless steel reactor (350 mm length × 8 mm i.d. × 12 mm o.d). Typical conditions were as follows: precursor packing amount = 2 mL (20–40 mesh), H2/CO2 (molar ratio) = 3/1, GHSV = 1000 h−1, T = 320 °C and P = 2.0 MPa. The sample was first reduced at 400 °C for 8 h by 30% H2 in N2 (GHSV = 1000 h−1 and P = 0.1 MPa). The feed gas was then switched on; the reaction started and proceeded for 96 h of time-on-stream (TOS). The sampling interval was 12 h. The data in Table 3 were obtained at TOS = 68 h. Effluent gas was analyzed on an on-line gas chromatograph (GC-9160) with a ϕ3 mm × 2 m TDX-01 packed column for C1 product analysis on TCD, and a 50 m × 0.53 mm × 40 μm Al2O3 capillary column for C1–C5 hydrocarbon product analysis on FID, respectively. Collected liquid products were analyzed on an off-line GC-9160 with a ϕ3 mm × 2 m Porapak Q packed column for aqueous phase product analysis on TCD and a 50 m × 0.32 mm × 1.0 μm HJ-1 capillary column for oil phase product analysis on FID. The data after 48 h time-on-stream reaction were used for the activity discussion. The conversion of CO2 and the selectivity of products were calculated based on carbon balance.| CO2 conv. = (Fin × yinCO2− Fout × youtCO2)/(Fin × yinCO2) × 100% |
| CH4(CO) sel. = (Fout × youti)/(Fin × yinCO2 × Conv.CO2) × 100% |
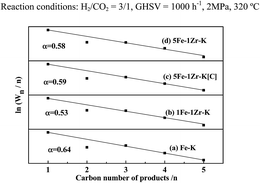
Chain growth probability (α) was calculated according to the Anderson–Schulz–Flory model for the product distribution: ln(Wn/n) = n ln![[thin space (1/6-em)]](https://www.rsc.org/images/entities/char_2009.gif) α + ln[(1 − α)2/α], where n is the number of carbon atoms in a product; Wn is the weight fraction of the corresponding product.
α + ln[(1 − α)2/α], where n is the number of carbon atoms in a product; Wn is the weight fraction of the corresponding product.
3. Results and discussion
3.1 Phases of the samples
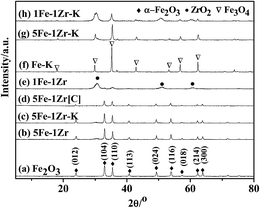
The XRD patterns of the samples are shown in Fig. 1. The characteristic diffraction peaks at 2θ of 24.2°, 33.3°, 35.7°, 40.9°, 49.6°, 54.1°, 62.6° and 64.1° were ascribed to the α-Fe2O3 phase29 and those at 2θ of 30.7°, 51.2° and 60.8° were attributed to the tetragonal ZrO2 phase.30For samples (a)–(e) before reduction and reaction, as the Zr content increased, the peak strength of α-Fe2O3 was gradually diminished, whereas that of ZrO2 increased. K impregnation did not obviously affect the phases, as shown in samples (b) and (c). The diffraction peaks of α-Fe2O3 by the MAHP method were stronger than that obtained by co-precipitation, as shown in samples (b) and (d). For samples (f)–(h) after reaction, the Fe3O4 phase was observed via the diffraction peaks at 2θ of 18.34°, 30.18°, 36.56°, 43.24°, 53.54°, 57.10° and 62.74°, whereas the α-Fe2O3 phase disappeared, suggesting that the iron species are transformed to Fe3O4.23,31 In contrast, the ZrO2 phase did not change distinctly before and after the reaction.
The average crystal particle sizes of the α-Fe2O3 phase in the samples are shown in Table 1. As the Zr content increased, the particle size of the α-Fe2O3 crystal phase, corresponding to the (104) crystal face, increased first and then decreased. With the MAHP preparation method, the crystal particle size of the α-Fe2O3 phase in the 5Fe–1Zr sample was 28.1 nm, which was not a significant change compared with 24.0 nm of 5Fe–1Zr[C] by co-precipitation.
| Sample | Size/nm |
|---|---|
| Fe2O3 | 24.9 |
| 7Fe–1Zr | 32.7 |
| 5Fe–1Zr | 28.1 |
| 3Fe–1Zr | 24.0 |
| 1Fe–1Zr | 11.1 |
| 5Fe–1Zr[C] | 24.0 |
3.2 Textural properties of the samples
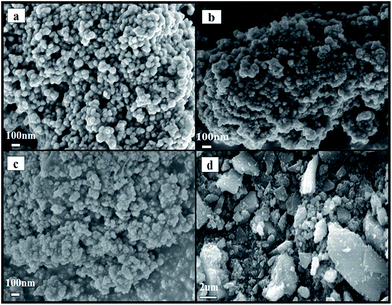
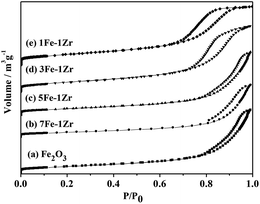
To check the effect of the MAHP method on preparation, the SEM images of fresh samples prepared by the MAHP method before K impregnation were taken, as shown in Fig. 2. Samples (a)–(c) were made up of small and uniformly shaped particles with a microscopic morphology; particle size was in the range of 50–60 nm. In contrast, sample (d) prepared by co-precipitation showed large and irregular particles. During MAHP, the OH− ions required for precipitation were gradually released by the hydrolysis of urea, and the pH value remained consistent. Moreover, when the hydrothermal temperature reached 170–180 °C, the nucleation might occur faster than the crystal particle growth. These two conditions cause the formation of small and uniform particles.32The N2 adsorption–desorption isotherms of fresh samples before K impregnation are shown in Fig. 3. Samples (a)–(e) prepared by the MAHP method showed the type IV isotherm pattern with H3-type hysteresis loop, indicating the presence of mesopores in the samples.21
The pore parameters of fresh samples before reduction and reaction are summarized in Table 2. As the Zr content increased, the surface area and the micropore volume increased. The mesopore volumes of all samples were much larger than the micropore volumes, and 5Fe–1Zr and 3Fe–1Zr showed the maximal mesopore volume. Moreover, 5Fe–1Zr had the minimal mesopore diameter, whereas 1Fe–1Zr had the maximal mesopore diameter. In contrast, 5Fe–1Zr[C] prepared by co-precipitation had the largest surface area, micropore volume, mesopore volume and mesopore diameter.
| Samples | Surface area (m2 g−1) | Mesopore volume (cm3 g−1) | Micropore volume (cm3 g−1) | Mesopore diameter (nm) |
|---|---|---|---|---|
| Fe2O3 | 22.1 | 0.092 | 0.008 | 2.54 |
| 7Fe–1Zr | 39.7 | 0.156 | 0.014 | 2.31 |
| 5Fe–1Zr | 52.6 | 0.190 | 0.020 | 2.25 |
| 3Fe–1Zr | 76.7 | 0.191 | 0.029 | 11.58 |
| 1Fe–1Zr | 83.5 | 0.168 | 0.032 | 11.94 |
| 5Fe–1Zr[C] | 95.3 | 0.153 | 0.037 | 7.32 |
3.3 Reduction behavior of the samples
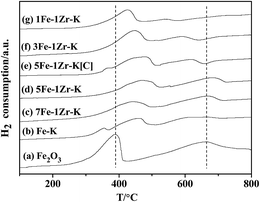
From the H2-TPR profiles of the samples in Fig. 4, it can be seen that all the fresh samples produced two reduction peaks.For Fe2O3 (a), the sharp peak at 280–420 °C and the broad one at 450–800 °C were assigned to the initial reduction of α-Fe2O3 to Fe3O4, and then the reduction of Fe3O4 to α-Fe.31 For Fe–K (b), two peaks appeared at low temperatures and were ascribed to the reduction of α-Fe2O3 to Fe3O4, and the partial reduction of Fe3O4 to FeO.13 For K-containing samples (b)–(g), the first peaks shifted to high temperatures, suggesting that K modification causes the reduction to be more difficult. The use of a K promoter has also been proved to suppress the adsorption of H2 to a certain extent.12,23 Moreover, the second peaks of 7Fe–1Zr–K (c) and 5Fe–1Zr–K (d) shifted to high temperatures, indicating the inhibition effect on the reduction of Fe2O3 and the formation of the iron phase through the FeO phase. With increasing the Zr content in samples (f) and (g), the second peak shifted to lower temperatures, which is coincident with the reported results that Zr addition improves the dispersion of iron phases and makes iron species easily reduced.33 These results demonstrate that there exists an interaction between the iron species and zirconia, and it was the strongest in 5Fe–1Zr–K. The reducibility of sample 5Fe–1Zr–K[C] by co-precipitation was different from that by the MAHP method. Similar to Fe–K (b), two reduction peaks appeared at low temperatures for 5Fe–1Zr–K[C] (e). The second peak was at 500–650 °C, lower than that of the corresponding 5Fe–1Zr–K, implied that the reduction of Fe3O4 to α-Fe is relatively easy.
3.4 Surface adsorption behavior of the samples
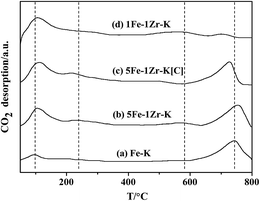
Fig. 5 shows the CO2-TPD profiles of fresh samples after the H2 pretreatment but before the reaction. Sample Fe–K (a) displayed two CO2 desorption peaks at 120–170 °C and 610–800 °C. After the addition of Zr, the peak slightly shifted to high temperatures and the CO2 desorption amount increased, as shown for sample (b). In addition, two new desorption peaks appeared at 200–320 °C and 510–620 °C. The data suggest that the adsorption of CO2, which is related to surface basicity,12 is intensified due to the ZrO2 formation by Zr addition. With further addition of Zr in sample (d), the high temperature desorption peak dramatically decreased. By comparison, the high temperature desorption peak strength of 5Fe–1Zr–K[C] (c) was weaker since the desorption peak temperature was lower.3.5 Surface composition of the samples
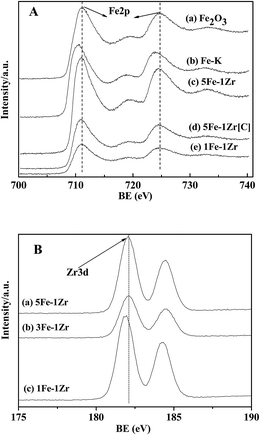
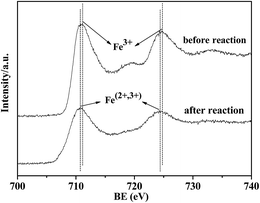
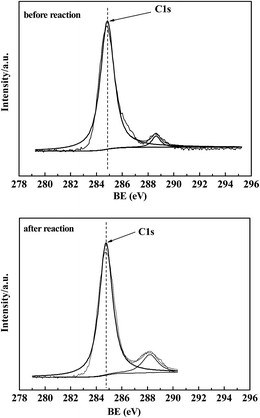
The XPS spectra of fresh samples before reduction and reaction are shown in Fig. 6. For all samples in Fig. 6-A, the binding energies (BE) at 710.9 eV and 724.5 eV were ascribed to Fe(2p3/2) and Fe(2p1/2), respectively. The satellite peak at 718.9 eV characterized the existence of Fe2O3.21 In Fig. 6-B, the BE at 182.1 eV was attributed to Zr(3d5/2) of ZrO2. K addition in Fig. 6-A(b) caused a slight decrease in the BE of Fe(2p1/2) compared with Fe2O3 (a). It was proposed that K lowers the metal work function by donating electrons to the vacant d orbits of the iron, enhancing the dissociative adsorption of CO, whereas lowering the H2 adsorption ability.34 Furthermore, the BE of Fe(2p3/2) and Zr(3d5/2) were lowered for the Fe–Zr samples in Fig. 6-A(c)–(e) and in Fig. 6-B(a)–(c), indicating the increased interaction between the iron species and zirconia.It can be seen from Fig. 7 that after the reaction, the BE of Fe(2p3/2) in 5Fe–1Zr–K shifted slightly towards low energy, compared with those before reduction and reaction, suggesting the existence of Fe3O4 in accordance with the XRD results. The binding energy of the carbon species in the 5Fe–1Zr–K sample is shown in Fig. 8. Before and after reaction, there was carbon (C1s, BE: 284.8 eV) on the sample surface, whereas carbidic carbon (BE: 283.1–283.4 eV)21 was not observed. This suggests that the carburization of Fe probably occurs during the reaction, and after reaction the Fe species transform to iron oxides.
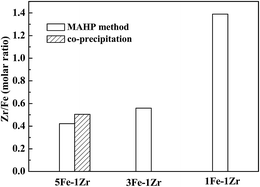
From the atomic concentration of the XPS spectra, the atomic Zr/Fe ratios of the samples were calculated. As shown in Fig. 9, the calculated Zr/Fe ratios are higher than the preparation ratios, revealing that Zr is enriched on the sample surface and the enrichment is stronger on 5Fe–1Zr[C] than on 5Fe–1Zr.
3.6 Catalytic activity for CO2 hydrogenation
The catalytic activities of the samples for CO2 hydrogenation under selected conditions are shown in Table 3. It can be seen that all samples prepared by the MAHP method showed higher activity with CO2 conversion above 43%. The main products were hydrocarbons, except for CO and small amounts of oxygenates. The 5Fe–1Zr–K sample displayed the maximum CO2 conversion of 54.36%. In addition to presenting uniform particles with better dispersion, 5Fe–1Zr–K had the strongest surface basicity as the CO2-TPD profile shows in Fig. 5, which should be favorable for the CO2 adsorptive activation and conversion.| Catalysts | CO2 Conv./% | Sel./% | Hydrocarbon distributiond/C% | O/P | |||||
|---|---|---|---|---|---|---|---|---|---|
| CO | HCb | Oxy.c | CH4 | C![[double bond, length as m-dash]](https://www.rsc.org/images/entities/char_e001.gif) 2–C 2–C![[double bond, length as m-dash]](https://www.rsc.org/images/entities/char_e001.gif) 4 4 |
C02–C04 | C5+ | |||
a Reaction conditions: H2/CO2 = 3/1, GHSV = 1000 h−1, 2 MPa, 320 °C.b HC: hydrocarbons.c Oxy.: oxygenates.d C![[double bond, length as m-dash]](https://www.rsc.org/images/entities/char_e001.gif) 2–C 2–C![[double bond, length as m-dash]](https://www.rsc.org/images/entities/char_e001.gif) 4: C2–C4 olefins; C02–C04: C2–C4 paraffins; C5+: C5+ hydrocarbons. 4: C2–C4 olefins; C02–C04: C2–C4 paraffins; C5+: C5+ hydrocarbons. |
|||||||||
| Fe–K | 48.33 | 7.45 | 89.17 | 3.38 | 16.12 | 50.53 | 6.69 | 26.67 | 7.55 |
| 7Fe–1Zr–K | 49.78 | 7.10 | 91.84 | 1.06 | 19.62 | 52.70 | 8.45 | 19.21 | 6.24 |
| 5Fe–1Zr–K | 54.36 | 3.00 | 96.58 | 0.42 | 19.78 | 53.63 | 8.33 | 18.26 | 6.44 |
| 3Fe–1Zr–K | 51.55 | 6.16 | 90.39 | 3.45 | 21.77 | 50.61 | 9.94 | 17.68 | 5.09 |
| 1Fe–1Zr–K | 43.43 | 9.88 | 90.11 | 0.01 | 24.74 | 46.61 | 14.20 | 14.46 | 3.28 |
| 5Fe–1Zr–K[C] | 34.02 | 4.47 | 94.61 | 0.92 | 19.74 | 48.82 | 7.92 | 23.51 | 6.17 |
In the production distribution, the CH4 selectivity over Fe–K was lower than that over Fe–Zr–K but the CO and C5+ selectivity were high. As the Zr content increased, the CH4 selectivity was gradually increased, whereas the C5+ selectivity decreased, indicating that the Zr addition in the catalyst samples suppresses the formation of the C5+ (heavy) products. As the Fe/Zr ratio increased, the CO2 conversion and the selectivity of light olefins (C![[double bond, length as m-dash]](https://www.rsc.org/images/entities/char_e001.gif) 2–C
2–C![[double bond, length as m-dash]](https://www.rsc.org/images/entities/char_e001.gif) 4) first increased and then decreased. At the Fe/Zr ratio of 5, the CO2 conversion and the C
4) first increased and then decreased. At the Fe/Zr ratio of 5, the CO2 conversion and the C![[double bond, length as m-dash]](https://www.rsc.org/images/entities/char_e001.gif) 2–C
2–C![[double bond, length as m-dash]](https://www.rsc.org/images/entities/char_e001.gif) 4 selectivity reached the maxima of 54.36% and 53.63%, respectively, while the selectivity of CO was the lowest (3%). The O/P ratio in the C2–C4 hydrocarbon products was 6.44. Considering the interaction between iron species and zirconia indicated by the aforementioned XPS results (Fig. 6) as well as the H2-TPR results (Fig. 4), it is likely that during the reduction of the samples zirconia would also lower the metal work function by donating electrons to iron and enhance the adsorption of CO while reducing the H2 adsorption, resulting in an increase in the light olefin products.
4 selectivity reached the maxima of 54.36% and 53.63%, respectively, while the selectivity of CO was the lowest (3%). The O/P ratio in the C2–C4 hydrocarbon products was 6.44. Considering the interaction between iron species and zirconia indicated by the aforementioned XPS results (Fig. 6) as well as the H2-TPR results (Fig. 4), it is likely that during the reduction of the samples zirconia would also lower the metal work function by donating electrons to iron and enhance the adsorption of CO while reducing the H2 adsorption, resulting in an increase in the light olefin products.
In contrast, the 5Fe–1Zr–K[C] catalyst prepared by co-precipitation showed the lowest CO2 conversion, although better product distribution. As shown in Fig. 9, Zr tends to have more enrichment on the catalyst surface prepared by co-precipitation. This enrichment might reduce the active site number on the catalyst surface, influencing the Fe–Zr interaction and the catalytic activity. Furthermore, the weaker surface basicity of 5Fe–1Zr–K[C] than that of 5Fe–1Zr–K (see Fig. 5) is unfavorable for the CO2 adsorptive activation.
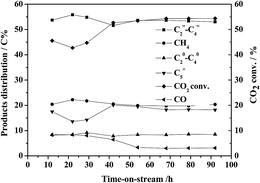
It has been reported that the steady state establishment of F–T synthesis over iron catalysts can be divided into five episodes of distinct kinetic regimes, which last for about 60 h. As the reaction time is extended, Fe species undergo transformation from iron oxide to iron carbide (Fe5C2).35
Fig. 10 shows the catalytic activity of CO2 hydrogenation over 5Fe–1Zr–K and the production changes at set reaction conditions with time-on-stream. It is clear that the catalytic activity exhibited an induction period of about 60 h. At the initial reaction stage, the CO2 conversion increased as the active phase iron carbide was gradually formed. After 60 h, both the CO2 conversion and the C![[double bond, length as m-dash]](https://www.rsc.org/images/entities/char_e001.gif) 2–C
2–C![[double bond, length as m-dash]](https://www.rsc.org/images/entities/char_e001.gif) 4 selectivity remained above 55% and 53%, respectively. The CO selectivity was retained at 3% from the incipient about 8%. The preceding characterization indicates that there exists an interaction between iron species and zirconia, which might play a stable role in the active phase of the catalysts.26
4 selectivity remained above 55% and 53%, respectively. The CO selectivity was retained at 3% from the incipient about 8%. The preceding characterization indicates that there exists an interaction between iron species and zirconia, which might play a stable role in the active phase of the catalysts.26
Chain growth probability (α) for CO2 hydrogenation over the catalyst samples is shown in Fig. 11. With Zr addition, α tends to decrease. As the Zr content increases, α decreases from 0.64 over Fe–K to 0.53 over 1Fe–1Zr–K. This is well in accordance with the hydrocarbon product distribution in Table 3, i.e., CH4 increases, while C5+ hydrocarbons decrease. The α over 5Fe–1Zr–K[C] is higher than that over 5Fe–1Zr–K, and there is more formation of C5+. Moreover, the ln(Wn/n) values for C2 hydrocarbons show negative deviation to the fitted line. As the α decreases, the deviation tends to diminish, implying that the secondary reactions of C2 towards heavy products are likely suppressed.
These results demonstrate that on the one hand, addition of certain amounts of Zr to Fe–K by the MAHP method can improve the dispersion of active Fe on the uniform catalyst particles during the course of reduction/reaction and promote the uptake and activation of CO2 by increasing the surface basicity on the catalyst surface. On the other hand, the Fe–Zr interaction shows a positive effect toward stabilizing the catalysts. The CO2 hydrogenation activity towards light olefins is thus improved.
4. Conclusion
The precursors of Fe–Zr–K catalysts prepared by the microwave-assisted homogeneous precipitation method produced small and uniform particles and improved the dispersion of iron species. After reduction, they showed high activity for the hydrogenation of CO2 to light olefins. Addition of appropriate amounts of Zr promoter, and K modification can increase the catalyst surface basicity and the interaction between iron species and zirconia, resulting in significant improvement in the CO2 conversion and the product distribution. When the Fe/Zr ratio was 5, the CO2 conversion and the light olefins selectivity reached the maxima with the highest O/P ratio in the C2–C4 hydrocarbon product fraction. Moreover, the selectivity of CO was reduced as low as 3%. After the induction period, the catalyst remained stable up to 92 h in time-on-stream reaction.Acknowledgements
Financial supports from the Special Prophase Project on Basic Research of Department of Science and Technology of China (Grant No. 2012CB723106) and the Natural Science Foundation of China (Grant No. 21366025) are greatly acknowledged.References
- M. Mikkelsen, M. Jørgensen and F. C Krebs, Energy Environ. Sci., 2010, 3, 43–81 CAS.
- R. W. Dorner, D. R. Hardy, F. W. Williams and H. D. Willauer, Energy Environ. Sci., 2010, 3, 884–890 CAS.
- W. Wang, S. Wang, X. Ma and J. Gong, Chem. Soc. Rev., 2011, 40, 3703–3727 RSC.
- M. He, Y. Sun and B. Han, Angew. Chem., Int. Ed., 2013, 52, 2–16 Search PubMed.
- G. Centi, E. A. Quadrelli and S. Perathoner, Energy Environ. Sci., 2013, 6, 1–19 Search PubMed.
- S. Zhang, H. Yan, M. Wei, D. G. Evans and X. Duan, RSC Adv., 2014, 4, 30241–30249 RSC.
- G. D. Weatherbee and C. H. Bartholomew, J. Catal., 1984, 87, 352–362 CrossRef CAS.
- T. Riedel, G. Schaub, K. Jun and K. Lee, Ind. Eng. Chem. Res., 2001, 40, 1355–1363 CrossRef CAS.
- M. Lee, J. Lee and C. Chang, Bull. Chem. Soc. Jpn., 1989, 62, 2756–2758 CrossRef CAS.
- M. Lee, J. Lee and C. Chang, J. Chem. Eng. Jpn., 1990, 23, 130–136 CrossRef CAS.
- J. Lee, W. Chern and M. Lee, Can. J. Chem. Eng., 1992, 70, 511–515 CrossRef CAS PubMed.
- P. H. Choi, K. Jun, S. Lee, M. J. Choi and K. W. Lee, Catal. Lett., 1996, 40, 115–118 CrossRef CAS.
- G. Kishan, M. Lee, S. Nam, M. Choi and K. Lee, Catal. Lett., 1998, 56, 215–219 CrossRef CAS.
- T. Herranz, S. Rojas, F. J. Pérez-Alonso and J. L. G. Fierro, Appl. Catal., A, 2006, 311, 66–75 CrossRef CAS PubMed.
- J. Kim, S. Lee, S. Lee, M. Choi and K. Lee, Catal. Today, 2006, 115, 228–234 CrossRef CAS PubMed.
- P. S. Sai Prasad, J. W. Bae, K. Jun and K. W. Lee, Catal. Surv. Asia, 2008, 12, 170–183 CrossRef.
- R. W. Dorner, D. R. Hardy, F. W. Williams and H. D. Willauer, Appl. Catal., A, 2010, 373, 112–121 CrossRef CAS PubMed.
- R. W. Dorner, D. R. Hardy, F. W. Williams and H. D. Willauer, Catal. Commun., 2011, 15, 88–92 CrossRef CAS PubMed.
- Z. You, W. Deng, Q. Zhang and Y. Wang, Chin. J. Catal., 2013, 34, 956–963 CrossRef CAS.
- M. Martinelli, C. G. Visconti, L. Lietti, P. Forzatti, C. Bassano and P. Deiana, Catal. Today, 2014, 228, 77–88 CrossRef CAS PubMed.
- M. Al-Dossary, A. A. Ismail, J. L. G. Fierro, H. Bouzid and S. A. Al-Sayari, Appl. Catal., B, 2015, 165, 651–660 CrossRef CAS PubMed.
- G. P. van der Laan and A. A. C. M. Beenackers, Catal. Rev.: Sci. Eng., 1999, 41, 255–318 CAS.
- J. Wang, Z. You, Q. Zhang, W. Deng and Y. Wang, Catal.Today, 2013, 215, 186–193 CrossRef CAS PubMed.
- V. R. Rao Pendyala, G. Jacobs, J. C. Mohandas, M. Luo, W. Ma, M. K. Gnanamani and B. H. Davis, Appl. Catal., A, 2010, 389(1–2), 131–139 CrossRef CAS PubMed.
- J. O. R. Wambach, A. Baiker and A. Wokaun, Phys. Chem. Chem. Phys., 1999, 1, 5071–5080 RSC.
- A. A. Hakeem, R. S. Vásquez, J. Rajendran, M. Li, R. J. Berger, J. J. Delgado, F. Kapteijn and M. Makkee, J. Catal., 2014, 313, 34–45 CrossRef CAS PubMed.
- F. Bondioli, A. M. Ferrari, C. Leonelli, C. Siligardi and G. C. Pellacani, J. Am. Ceram. Soc., 2001, 84, 2728–2730 CrossRef CAS PubMed.
- J. Du, Y. Zhang, T. Tian, S. C. Yan and H. T. Wang, Mater. Res. Bull., 2009, 44, 1347–1351 CrossRef CAS PubMed.
- Ş. özkara-Aydınoğlu, Ö. Ataç, Ö. F. Gül, Ş. Kınayyiğit, S. Şal, M. Baranak and İ. Boz, Chem. Eng. J., 2012, 181–182, 581–589 CrossRef PubMed.
- V. G. Deshmane and Y. G. Adewuyi, Microporous Mesoporous Mater., 2012, 148, 88–100 CrossRef CAS PubMed.
- W. Ning, N. Koizumi, H. Chang, T. Mochizuki, T. Itoh and M. Yamada, Appl. Catal., A, 2006, 312, 35–44 CrossRef CAS PubMed.
- J. Baneshi, M. Haghighi, N. Jodeiri, M. Abdollahifar and H. Ajamein, Energy Convers. Manage., 2014, 87, 928–937 CrossRef CAS PubMed.
- K. Chen, Y. Fan and Q. J. Yan, Chin. J. Catal., 1995, 16, 433–436 CAS.
- M. E. Dry, T. Shingles, L. J. Boshoff and G. J. Oosthuizen, J. Catal., 1969, 15, 190–199 CrossRef CAS.
- H. Schulz, T. Riedel and G. Schaub, Top. Catal., 2005, 32, 117–124 CrossRef CAS.
| This journal is © The Royal Society of Chemistry 2015 |

