Electrochemical reduction of CO2 to HCOOH on a synthesized Sn electrocatalyst using a Co3O4 anode
V. S. K. Yadav and
M. K. Purkait*
Department of Chemical Engineering, Indian Institute of Technology Guwahati, Guwahati-781039, Assam, India. E-mail: mihir@iitg.ernet.in; Fax: +91-361-2582291; Tel: +91-361-2582262
First published on 31st July 2015
Abstract
The present work investigates the electrocatalytic effect of tin (Sn) and cobalt oxide (Co3O4) on the reduction of CO2 to products electrochemically (RCPE). Electrocatalytic (Sn) powder was synthesized by an electrodeposition method from a SnCl2·2H2O solution. Experiments were conducted using Co3O4 and Sn electrodes as the anode and cathode, respectively, in 0.5 M potassium and sodium carbonate and bicarbonate solutions. The electrodes were prepared by coating the electrocatalysts onto a graphite plate surface. The experiments were conducted with different applied voltages (1.5 to 3.5 V) and time intervals (5, 10, 15, 20 and 25 min) in the various electrolyte solutions. It was observed that HCOOH acid was the only product formed for all the applied conditions. At 1.5 V and 2 V, maximum Faradaic efficiencies of 74.04% and 92.6% for HCOOH production were obtained from 20 and 5 min reactions in a KHCO3 electrolyte solution. The ability of Co3O4 to perform water oxidation and the Sn electrocatalyst to reduce CO2 to HCOOH was established from the obtained results. The optimized reaction conditions to achieve high Faradaic efficiencies are explained in detail.
1. Introduction
Fossil fuels are used as the world’s primary energy source. Since the energy produced from fossil fuels is cheap, most of the energy generated in present technology is from fossil fuels. The process of energy generation deals with combustion of fossil fuels like coal, natural gas and petroleum. CO2 as well as some other gases like nitrous oxide, methane and halocarbons, are released into the atmosphere as greenhouse gases during this combustion. Utilization of fossil fuel energy is drastically increasing due to the rapid rise in population. The emissions of greenhouse gases, mainly CO2, are proportional to the energy generation and are the main cause of global warming.1–3 In all countries, most of the environmentally challenging issues arise due to CO2. Hence, it is highly recommended to control this greenhouse gas before its release into the environment. Many methods exist for the reduction of CO2 into various products, and the reduction of CO2 to products electrochemically (RCPE) is a particularly promising method due to several advantages. Firstly, RCPE in aqueous systems has yielded high selectivity at a low cost by using a heterogeneous catalyst.4–7 Secondly, the entire reaction process can be done at ambient temperature and pressures.8 Thirdly, it can be done using solar energy as an energy source.9–11 Fourthly, energy generated for the RCPE can be stored in the form of fuels.12,13 Fifthly, generation of the proton source from wastewater decreases the overall chemical consumption. Finally, RCPE systems have a compact design and are easy to scale up for industrial applications.It is envisaged from the above literature that RCPE is going to be a promising technology for the reduction of CO2 to produce several products. Reduction of CO2 mainly depends on the electrocatalyst used in the reaction and the applied potentials. However, work is ongoing to improve the reduction rates by improving the stability and efficiency of electrocatalysts. The majority of attention is focused on studying the extent of catalyst deactivation in order to find a developed electrocatalyst of high stability.14 Electrolytes,15 pH16 and catalyst structure17–19 play major roles for product selectivity in RCPE. Copper is a well known electrocatalyst in RCPE as various products like methane, ethylene and other hydrocarbons are formed with significant efficiencies. However, due to the formation of multiple products, the process becomes more complex.20 In order to reduce this complexity, CO2 has to be reduced to a single product with a high Faradaic efficiency. If a liquid product is formed from RCPE with a high Faradaic efficiency, this could be a sustainable approach for future liquid fuel production. Some studies were done for RCPE with Pb and Sn electrocatalysts to form HCOOH.21–25 In most RCPE processes platinum (Pt) was used as an anode for the oxidation of water.26,27 However, few authors have investigated the effect of water oxidation using Co3O4 electrocatalyst for hydrogen evolution reactions.28–31
From the extensive literature survey, it was observed that Pt was used as an anode electrocatalyst for the oxidation reaction in most of the cases. The use of Co3O4 as an electrocatalyst in place of Pt for RCPE is scant and might be a better alternative. The present work explores the use of Co3O4 as an anode and tin (Sn) as a cathode material in RCPE for the reduction of CO2 to HCOOH as a single liquid product. The role of the electrocatalyst anode (Co3O4) and cathode (Sn) towards RCPE is explained with respect to the rate of reaction for all applied voltages using a 2-electrode glass cell. To the best of our knowledge, no studies have been reported using Co3O4 as an anode for RCPE with a Sn electrocatalyst. Therefore, the data generated in this investigation might be useful in the field of RCPE during the selection of low cost and appropriate electrocatalysts.
2. Experimental
2.1. Materials, characterization and product analysis
2.2. Electrochemical synthesis of the Sn powder
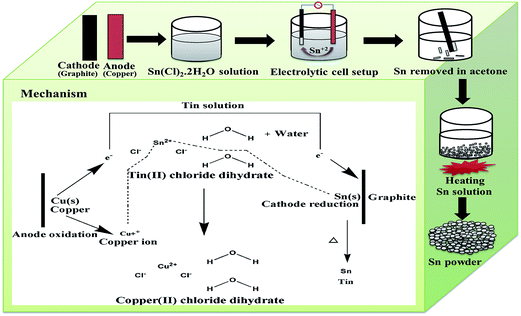
The tin (Sn) powder was synthesized by an electrodeposition method.32 A schematic for the synthesis of the Sn powder is shown in Fig. 1. Metal powder was extracted from the solution of 0.1 M SnCl2·2H2O by supplying energy between the metallic copper plate and graphite plate in an electrolytic cell. A constant current of 0.2 A was applied for 3 min during which the Sn deposition took place on the graphite plate. The deposited Sn powder was removed with acetone. Furthermore, this catalyst solution was heated at 100 °C for 1 h to obtain Sn powder.2.3. Preparation of the electrodes
The electrodes were prepared in a 200 μl solution of nafion + isopropyl alcohol (IPA) in a ratio 1![[thin space (1/6-em)]](https://www.rsc.org/images/entities/char_2009.gif) :
:![[thin space (1/6-em)]](https://www.rsc.org/images/entities/char_2009.gif) 5 which acts as a binder. 7.5 mg of the electrocatalyst (Co3O4 or Sn) was added to the binder solution, and sonicated for 30 min. These solutions were coated onto graphite plate surfaces at 80 °C to produce electrodes with active areas of 2 mg cm−2. Thereafter, the electrodes were dried for 2 h in an oven at 100 °C.
5 which acts as a binder. 7.5 mg of the electrocatalyst (Co3O4 or Sn) was added to the binder solution, and sonicated for 30 min. These solutions were coated onto graphite plate surfaces at 80 °C to produce electrodes with active areas of 2 mg cm−2. Thereafter, the electrodes were dried for 2 h in an oven at 100 °C.
2.4. Electrochemical studies of the CO2 reduction
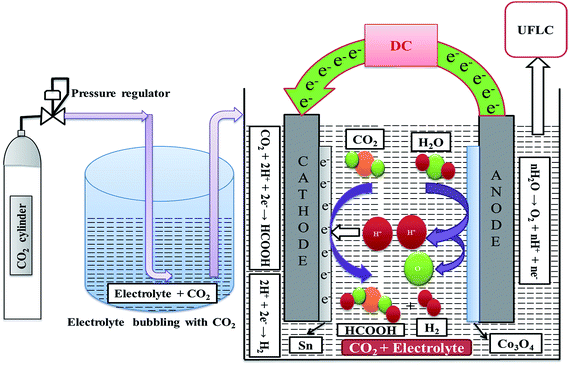
The prepared electrodes were used in RCPE in a 2-electrode homemade glass cell in order to study their effect on CO2 reduction. Fig. 2 shows a schematic of the experimental setup used for RCPE using a 2-electrode cell. The glass cell was filled with 80 ml of a prepared 0.5 M electrolyte solution which was saturated with CO2 by continuous bubbling for 50 min. RCPE experiments were conducted in the CO2 saturated solutions by connecting the electrodes to the DC source. Experiments were conducted at potentials of 1.5, 2, 2.5, 3 and 3.5 V with reaction times of 5, 10, 15, 20 and 25 min for every applied voltage.3. Results and discussion
3.1. Characterization and mechanism of formation of the Sn electrocatalyst
A FTIR spectrum of the synthesized Sn electrocatalyst is presented in Fig. 3a. The broad bands around 3000–3600 cm−1 and 1642 cm−1 correspond to O–H stretching vibrations and O–H bending vibrations respectively, and are attributed to adsorbed water. The band at 1000–1250 cm−1 confirms the presence of Sn.32 An XRD pattern of the synthesized Sn electrocatalyst is shown in Fig. 3b. Peak positions at 30.7°, 32.08°, 43.97°, 45.0°, 55.46°, 62.67°, 63.93°, 64.73°, 72.59°, 73.34° and 79.7° are matched closely to the Sn structure.33 The particle size analysis was performed using a Delsa nano (make: Beckman coulter; model: Delsa nano C) particle size analyzer and the particle size distribution data for synthesized catalyst is shown in Fig. 3c. The particle size of Sn powder was found to be in the range of 156.7–278.9 nm. The distribution median size (Dv50) of the Sn electrocatalyst particles was found to be 192.5 nm. A mechanism for the formation of the Sn electrocatalyst is shown in Fig. 1. Oxidation of copper (Cu(s) → Cu2+ + 2e− (0.34 V)) and reduction of tin (Sn2+ + 2e− → Sn (0.14 V)) take place at the anode and cathode, respectively. Sn ions from the electrolyte solution are deposited on the cathode surface by accepting electrons generated at the anode (oxidation). Copper ions formed at the anode are the driving force for the deposition of Sn ions on the surface of the graphite plate. The deposition rate was proportional to the formation of new copper chloride molecules in solution. Further, upon heating, the deposited Sn powder on graphite gives the Sn electrocatalyst.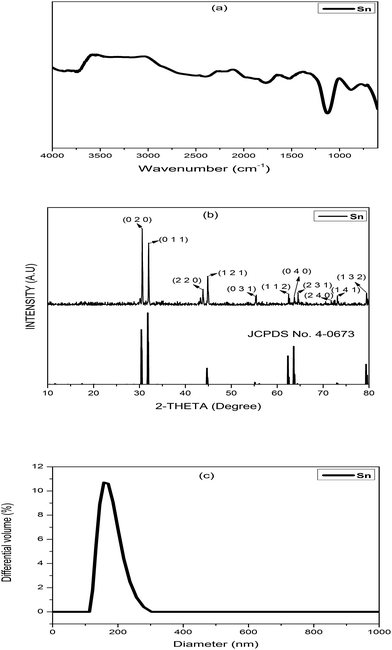 | ||
| Fig. 3 Characterization of the Sn electrocatalyst: (a) FTIR, (b) XRD, and (c) particle size analysis. | ||
3.2. RCPE studies of the Sn electrocatalyst in different electrolyte solutions
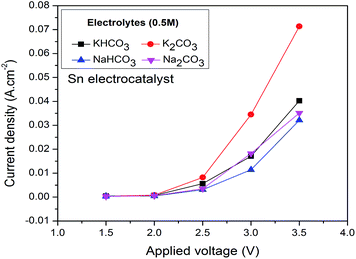
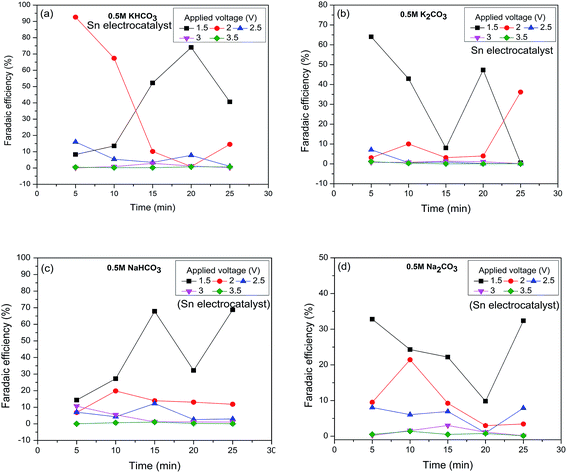 | ||
| Fig. 5 Variation of Faradaic efficiency over time during the reduction of CO2 to HCOOH using (a) KHCO3, (b) K2CO3, (c) NaHCO3, and (d) Na2CO3 electrolyte solutions. | ||
| Electrode | Electrolyte | Applied voltage (V) | Reaction time (min) | Faradaic efficiency (HCOOH) (%) | References | |
|---|---|---|---|---|---|---|
| Anode | Cathode | |||||
| Pt | Sn | 0.5 M KHCO3 | 1.5 | 30 | 74 | 22 |
| 2 | 30 | 47 | ||||
| 1.5 | 120 | 20 | ||||
| 2 | 120 | 20 | ||||
| Pt | Sn | 0.1 M K2CO3 | 1.5 | 30 | — | |
| 2 | 30 | 14.2 | ||||
| 1.5 | 120 | — | ||||
| 2 | 120 | 13 | ||||
| Pt | Sn | 0.1 M KHCO3 | 1.39 | — | 92.3 | 34 |
| Pt | Sn | 0.1 M KHCO3 | 1.8 | 60 | 91 | 25 |
| Co3O4 | Sn | 0.5 M KHCO3 | 1.5 | 20 | 74.08 | Present work |
| 2 | 5 | 92.6 | ||||
| 0.5 M K2CO3 | 1.5 | 5 | 64.03 | |||
| 2 | 25 | 36.18 | ||||
| 0.5 M NaHCO3 | 1.5 | 25 | 68.72 | |||
| 2 | 10 | 19.83 | ||||
| 0.5 M Na2CO3 | 1.5 | 10 | 32.82 | |||
| 2 | 10 | 21.44 | ||||
Finally, the application of Co3O4 as an anode for the reduction of CO2 to HCOOH was proven. Comparison of the HCOOH Faradaic efficiencies in different experimental conditions with the literature is shown in Table 1. From the table it may be concluded that the use of Co3O4 as an alternative to Pt as the anode for RCPE is economically favorable. The experimental conditions for high HCOOH Faradaic efficiencies of RCPE over time are also shown with respect to the applied voltages. It is concluded that bicarbonate electrolyte solutions were able to reduce more CO2 than carbonate solutions.
4. Conclusion
A study on RCPE was done by synthesizing Sn electrocatalysts via an electrodeposition method. The results showed that Co3O4 was able to oxidize H2O efficiently for CO2 reduction. Higher Faradaic efficiencies were obtained with bicarbonate based electrolyte solutions than with carbonate solutions at low applied voltages. The synthesized electrocatalyst was able to reduce CO2 to HCOOH effectively at all applied voltages. A maximum Faradaic efficiency of 92.6% was observed at 2 V with a reaction time of 5 min and 74.06% at 1.5 V after 20 min in KHCO3 solution. With a NaHCO3 solution, high Faradaic efficiencies of 68.72% were observed at 1.5 V with a reaction time of 25 min, which is the most optimum condition for RCPE. This preliminary study will be helpful towards finding cheap and effective electrocatalysts for RCPE (as alternatives to expensive Pt).References
- L. Li, N. Zhao, W. Wei and Y. Sun, Fuel, 2013, 108, 112–130 CrossRef CAS.
- R. Bredesen, K. Jordal and O. Bolland, Chem. Eng. Process., 2004, 43, 1129–1158 CrossRef CAS.
- S. Shafiei and R. A. Salim, Energy Policy, 2014, 66, 547–556 CrossRef CAS.
- M. Alvarez-Guerra, S. Quintanilla and A. Irabien, Chem. Eng. J., 2012, 207–208, 278–284 CrossRef CAS.
- M. R. Goncalves, A. Gomes, J. Condeco, R. Fernandes, T. Pardal, C. A. C. Sequeira and J. B. Branco, Energy Convers. Manage., 2010, 51, 30–32 CrossRef CAS.
- I. Ganesh, Renewable Sustainable Energy Rev., 2014, 31, 221–257 CrossRef CAS.
- R. J. Lim, M. Xie, M. A. Sk, J.-M. Lee, A. Fisher, X. Wang and K. H. Lim, Catal. Today, 2014, 233, 169–180 CrossRef CAS.
- S. Kaneco, K. Iiba, K. Ohta, T. Mizuno and A. Saji, J. Electroanal. Chem., 1998, 441, 215–220 CrossRef CAS.
- J. L. White, J. T. Herb, J. J. Kaczur, P. W. Majsztrik and A. B. Bocarsly, J. CO2 Util., 2014, 7, 1–5 CrossRef CAS.
- S. Kaneco, H. Katsumata, T. Suzuki and K. Ohta, Appl. Catal., B, 2006, 64, 139–145 CrossRef CAS.
- Y. Ping, Y. Ta, P. Yen and C. P. Huang, Sep. Purif. Technol., 2013, 117, 3–11 CrossRef.
- M. Gattrell, N. Gupta and A. Co, Energy Convers. Manage., 2007, 48, 1255–1265 CrossRef CAS.
- D. T. Whipple and P. J. A. Kenis, J. Phys. Chem. Lett., 2010, 1, 3451–3458 CrossRef CAS.
- Y. Hori, H. Konishi, T. Futamura, A. Murata, O. Koga, H. Sakurai and K. Oguma, Electrochim. Acta, 2005, 50, 5354–5369 CrossRef CAS.
- Q. Wang, H. Dong and H. Yu, J. Power Sources, 2014, 271, 278–284 CrossRef CAS.
- N. Sreekanth and K. L. Phani, Chem. Commun., 2014, 50, 11143–11146 RSC.
- W. J. Durand, A. A. Peterson, F. Studt, F. Abild-Pedersen and J. K. Norskov, Surf. Sci., 2011, 605, 1354–1359 CrossRef CAS.
- F. Jia, X. Yu and L. Zhang, J. Power Sources, 2014, 252, 85–89 CrossRef CAS.
- G. Keerthiga, B. Viswanathan and R. Chetty, Catal. Today, 2014, 8–13 Search PubMed.
- P. Bumroongsakulsawat and G. H. Kelsall, Electrochim. Acta, 2014, 141, 216–225 CrossRef CAS.
- V. S. K. Yadav and M. K. Purkait, RSC Adv., 2015, 5, 40414–40421 RSC.
- F. Koleli, T. Atilan, N. Palamut, A. M. Gizir, R. Aydin and C. H. Hamann, J. Appl. Electrochem., 2003, 33, 447–450 CrossRef.
- Y. Chen and M. W. Kanan, J. Am. Chem. Soc., 2012, 5–8 Search PubMed.
- B. Innocent, D. Liaigre, D. Pasquier, F. Ropital, J.-M. Leger and K. B. Kokoh, J. Appl. Electrochem., 2008, 39, 227–232 CrossRef.
- W. Lv, R. Zhang, P. Gao and L. Lei, J. Power Sources, 2014, 253, 276–281 CrossRef CAS.
- J. D. Watkins and A. B. Bocarsly, ChemSusChem, 2014, 7, 284–290 CrossRef CAS PubMed.
- D. W. Dewulf and A. J. Bard, Catal. Lett., 1988, 1, 73–79 CrossRef CAS.
- A. Han, H. Wu, Z. Sun, H. Jia and P. Du, Phys. Chem. Chem. Phys., 2013, 15, 12534–12538 RSC.
- S. Dey, B. Mondal and A. Dey, Phys. Chem. Chem. Phys., 2014, 16, 12221–12227 RSC.
- M. Bajdich, A. Vojvodic, J. K. Norskov and A. T. Bell, J. Am. Chem. Soc., 2013, 135, 13521–13530 CrossRef CAS PubMed.
- J. Yang, K. Walczak, E. Anzenberg, F. M. Toma, G. Yuan, A. Schwartzberg, Y. Lin, M. Hettick, A. Javey, J. W. Ager, J. Yano, H. Frei and I. D. Sharp, J. Am. Chem. Soc., 2014, 136, 6191–6194 CrossRef CAS PubMed.
- M. A. M. Ibrahim, F. Kooli and S. N. Alamri, Int. J. Electrochem. Sci., 2013, 8, 12308–12320 CAS.
- P. Wu, N. Du, H. Zhang, J. Yu, Y. Qi and D. Yang, Nanoscale, 2011, 3, 746–750 RSC.
- K. Hara, A. Kudo and T. Sakata, J. Electroanal. Chem., 1995, 391, 141–147 CrossRef.
| This journal is © The Royal Society of Chemistry 2015 |

