
Pt-nanoparticle functionalized carbon nano-onions for ultra-high energy supercapacitors and enhanced field emission behaviour†
Sachin R. Suryawanshia,
Vaibhav Kawareb,
Disha Chakravartyb,
Pravin S. Walkec,
Mahendra A. More*a,
Kavita Joshi*b,
Chandra Sekhar Rout*d and
Dattatray J. Late*cb
aCentre for Advanced Studies in Materials Science and Condensed Matter Physics, Department of Physics, Savitribai Phule Pune University, Pune 411007, India. E-mail: mam@physics.unipune.ac.in
bPhysical and Materials Chemistry Division, CSIR-National Chemical Laboratory, Dr. Homi Bhabha Road, Pashan, Pune-411008, Maharashtra, India. E-mail: k.joshi@ncl.res.in; datta099@gmail.com; dj.late@ncl.res.in
cNational Centre for Nanoscience & Nanotechnology, University of Mumbai, Mumbai-400 098, Maharashtra, India
dSchool of Basic Sciences, Indian Institute of Technology, Bhubaneswar 751013, Odisha, India. E-mail: csrout@iitbbs.ac.in
First published on 14th September 2015
Abstract
In the present work, we have investigated the charge storage capacitive response and field emission behaviour of platinum (Pt) nanoparticles decorated on carbon nano onions (CNOs) and compared them with those of pristine carbon nano onions. The specific capacitance observed for Pt–CNOs is 342.5 F g−1, about six times higher than that of pristine CNOs, at a scan rate of 100 mV s−1. The decoration with Pt nanoparticles, without any binder or polymer separator on the CNO, leading to enhanced supercapacitance is due to easy accessibility of Na2SO4 electrolyte in the active material. The Density Functional Theory (DFT) calculations of these systems reveal enhancement in the Density of States (DOS) near the Fermi energy (EF) on account of platinum decoration on the CNOs. Furthermore, the field emission current density of ∼0.63 mA cm−2 has been achieved from the Pt-CNOs emitter at an applied electric field of ∼4.5 V μm−1 and from the pristine CNOs sample current density of ∼0.4 mA cm−2 has been achieved at an applied electric field of ∼6.6 V μm−1. The observed enhanced field emission behavior has been attributed to the improved electrical conductivity and increased emitting sites of the Pt–CNO emitter. The field emission current stability of the Pt–CNO emitter over a longer duration is found to be good. The observed results imply multifunctional potential of Pt–CNOs, as supercapacitor material in various next generation hybrid energy storage devices, and field emitters for next generation vacuum nano/microelectronic devices.
1. Introduction
Nanostructures of carbon in all of its forms have proved to be extremely useful and increasingly popular among material scientists in the recent past.1–21 Their popularity is based on their versatility to appear in different forms such as 2D-graphene sheets, 1D-carbon nanotubes (CNT), quantum dots, and 0D-carbon nano onions (CNOs). The latest and the single most popular among these has been graphene, the one atom thick sheet of carbon atoms. Graphene has been used in various applications such as the field effect transistors,2–4 gas sensors,5,6 supercapacitors,7–9 solar cells,10–13 photodetectors,14,15 and high current density field emitters.16–21 The electrons moving through the graphene sheet experience less resistance, making it an excellent candidate for future applications in nanoelectronics, energy storage devices, as well as for quantum computing applications. Electrochemical capacitors, also known as supercapacitors, store the charge between two narrowly spaced layers of differing polarities and have direct applications in power devices like electric vehicles and electronic apparatus.22 Superfast charging and discharging rates, and the capability to sustain over large number of cycles, make electrochemical capacitors potential candidates to be used in high energy density batteries. Further, carbon based supercapacitors, also known as ultracapacitors, have attracted much attention among the scientific community recently, due their exceptional potential to store charge with high retention rate.7–9Previously, the CNOs have been reported as the supercapacitor material with a capacitance of 20–60 F g−1.22–27 The CNOs consist of concentric shells of fullerenes, and differ from the ideal graphene (2D) and CNT (1D), on account of the presence of pentagons and occasionally heptagons. Similar to graphene, the CNOs posses a tunable energy bandgap, a property that can be readily used to tune the electronic, optical and magnetic properties of materials.28–35 Most of the recent reports show that CNOs can store electrical charges and exhibit supercapacitance.22–27 However, in spite of excellent semiconducting properties and the possibility of large surface-to-volume ratio of CNOs, there are very few reports on its potential use in supercapacitors.22–25
Furthermore, the cold cathodes based on carbon nano-crystalline materials have been recognized as potential candidates for high current density applications.16–21 The carbon based material such as graphene nanosheets, carbon nanotubes (CNTs) exibit promising field emisssion (FE) characteristics in terms of low turn-on field, large emission current densities and high field enhancement factor because of their high aspect ratios as well as unique mechanical and electronic properties.16–21 Moreover these materials retain high geometrical factors and have ability to tailor the electrical properties by metal sandwich configuration. In order to enhance the FE behaviour of the pristine nanomaterials, one of the strategies deals with their functionalization/decoration with other metal, metal-oxide nanostructures such as Ag–ZnO,36 Si–ZnO,37 Pd–CNTs,38 Pt/Ru–CNTs.39 In organized manner, these metal nanocomposites have improved the performance of the composite systems in terms of their physico-chemical and electronic properties. Device performance is enhanced by route of functionalization, functionalized materials and their species, and total area of functionalization.36–39
In this work, we demonstrate by experimental as well as theoretical investigations that decoration of CNOs with Pt nanoparticles, significantly enhances the charge storage capacity of pristine CNOs. The enhanced supercapacitance properties of Pt–CNOs are explained by performing electronic structure calculations. The observed boost in the CNOs' charge storing capacity upon Pt decoration holds a promise for future high performance supercapacitors. Also the, comparative field emission behavior of pristine CNOs and Pt–CNOs shows the improvement in the FE performance.
2. Experimental methods
2.1 Materials synthesis
Glucose oxidase (GOx), phosphate buffer (pH 7.4), Nafion solution (w/v 5 K3Fe(CN)6, K4Fe(CN)6) were purchased from Sigma Aldrich and used as received. The deionized water (DI) (resistance 18 M) was produced from Milli-Q DI water plant. The synthesis of CNOs begins with cleaning and drying of white and thin cotton. A wick was made out of the dried cotton and then was used to light a candle made up of clarified butter. To achieve maximum yield, the candle was placed in a stable air condition. A polished copper plate was positioned at 3 cm above the candle, allowing enough space for the oxygen to aid the burning of the lamp (Fig. 1). The copper plate is used just for the support or substrate to collect materials. Someone can use ceramic plates as a collector as well. We have obtained 1 g of carbon black for 50 g of ‘clarified butter’ on an average. The complete and controlled combustion of the oil left a thick layer of carbon nano-onions. The same protocol was also adopted for the synthesis of CNOs from other oil precursors like mustard oil, sunflower oil and paraffin oil. To control the size of CNOs, the height of the copper plate was varied from 2.5 to 5 cm which leads to variation in particle size from 25–60 nm.40,41,42 The as deposited CNOs were then directly collected from the surface of copper plate. The functionalization/decoration of Pt nanoparticles was then carried out using two step controlled reaction. Typically, CNOs were activated first by using 2 M H2SO4 or 4 M HNO3 at 120 °C followed by treating the product with ethyl glycol, deionized water and H2PtCl6 at 140 °C. The CNOs and Pt–CNOs samples were purchased from D and D Advanced Materials (Pune, India). | ||
| Fig. 1 The schematic of candle made up of clarified butter placed in a stable air condition to get thick layer of carbon nano onions on copper plate surface. | ||
2.2 Characterization
High resolution-transmission electron microscopy (HR-TEM) images were acquired using FEI TECNAI TF-30 (FEG) instrument. Raman spectra of CNOs and Pt–CNOs were recorded using 513.5 nm excitation lasers with 0.5 mW laser power in back scattering geometry using LabRam instrument.2.3 Supercapacitor device fabrication and characterization
The electrochemical performances of the CNOs and Pt–CNOs were investigated by Cyclic Voltammetry (CV), galvanostatic charge/discharge tests and EIS on a C–H electrochemical workstation (CHI660D, Austin, TX) using a three-electrode set up. The working electrodes were made by drop casting CNOs and Pt–CNOs samples and drying in vacuum. The EIS measurements were recorded over a frequency range of 100 kHz to 10 MHz with amplitude of 10 mV at the open-circuit potential.2.4 Field emission
The field emission (FE) measurements were carried out in a planar ‘diode’ configuration at base pressure of ∼1.0 × 10⁻⁸ mbar. A typical diode structure consist of a semitransparent phosphor screen (circular disc having diameter ∼40 mm) as an anode, and the pristine CNOs and Pt–CNOs drop casted on Au coated Si as cathode. All the FE measurements were performed at constant separation of ∼1 mm between anode and cathode. The emission current versus applied field measurements were performed using Keithely Electrometer (6514) by sweeping applied dc voltage with a step of 40 V (0–40 kV, Spellman, U.S.). The FE current stability was recorded at different preset current values. Before recording the FE measurements, pre-conditioning of the cathode so as to remove the loosely bound particles/contaminants or adsorbed gas via continuous residual ion bombardment was carried out by applying a fixed potential of −2 kV to the cathode for 1 h duration.2.5 Computational details
Simulations were performed within the Kohn–Sham DFT using the Vienna Ab-initio Simulation Package (VASP).43–45 Projector Augmented Wave (PAW)46,47 type pseudopotentials with Generalized Gradient Approximation (GGA) and Perdew–Burke–Ernzerhof (PBE)48,49 approximation for the exchange–correlation were used. Since Pt atoms posses unpaired electrons, calculations for both the systems under consideration were performed with spin polarization. The total magnetization of the overall system (C60 + Pt4 and C300 + Pt32) turned out to be zero, and thus, the role of magnetization in the observed results was ruled out. All the geometries were relaxed to within 0.005 eV Å−1 force and electronic energies were converged with an accuracy of 0.0001 eV. Cubic simulation box was used for all the simulations, with periodic images of clusters separated by 12 Å.3. Results and discussion
The as-synthesized CNOs and Pt decorated CNOs were examined by TEM and HR-TEM and are shown in Fig. 2a, which show nearly spherical shaped onion like structures with average diameter ∼50 nm. The concentric layers possessed by CNOs, as observed by HRTEM, are shown in Fig. 2b. The lattice spacing measured between these curved layers of the CNOs is 0.35 nm (see ESI Fig. S1†), which is close to that of the graphite (002) plane. Fig. 2c shows the TEM image of CNOs decorated with Pt nanoparticles of size ∼2.5 nm (please see ESI Fig. S3†), and Fig. 2d shows the corresponding HR-TEM image. The measured lattice spacing of Pt nanoparticle is 0.23 nm (see ESI Fig. S2†) which corresponds to that of Pt(111) plane. | ||
| Fig. 2 CNOs (a) TEM image and (b) HR-TEM image. The lattice spacing measured between the curved graphene layers in the onions is ∼0.35 nm. (c) TEM image and (d) HR-TEM image of Pt–CNOs with platinum nanoparticle of size ∼2.5 nm. The lattice spacing of Pt nanoparticles was found to be 0.23 nm. | ||
The Raman spectra of CNO and Pt–CNO samples confirmed the high quality and purity of the samples used in these experiments (please see ESI Fig. S4(a) and (b)†). Raman spectroscopy is a powerful and non-destructive characterization technique used to characterize mechanical and thermal properties of materials.36–40 The Raman spectra of CNO and Pt–CNO show signature of two well defined sharp peaks, high quality of the specimen (Fig. 3). One of the peak representing D-band centre at ∼1356 cm−1 corresponds to defects in the CNOs lattice. The second peak corresponds to the G-band centre at ∼1585 cm−1 represents a crystalline graphitic structure. Also, the G band represents the in-plane stretching vibrations of the sp2-carbon–carbon bonds within the ordered graphitic layers of pristine CNOs.30,50 The I(G)/I(D) peak intensity ratio has been used to determine the relative degree of disordered carbon and other structural imperfections in CNOs. The I(G)/I(D) ratios for pristine CNOs and Pt–CNOs were found to be ∼1.2 and 0.9, respectively, suggesting defective nature upon Pt decoration.29,30,51
 | ||
| Fig. 3 Raman spectra of (a) CNOs and (b) Pt–CNOs. Schematic representations of the (c) CNOs and (d) Pt–CNOs. | ||
3.1 Electrochemical investigations
The capacitive performance of CNOs and Pt–CNOs was measured by three-electrode system in the 0.1 M Na2SO4 aqueous electrolyte. Fig. 4a shows the comparative CVs of CNOs and Pt–CNOs at a scan rate of 100 mV s−1. The specific capacitances of pristine CNOs and Pt–CNOs have been calculated using the following equation.52where, m is the mass of single electrode material (g), v is the scan rate (mV s−1), v1 and v2 are the integration limits (potential window), and I(v) denotes the response current (A). The area under the CV curve represents the charge storage capacity of the electrode. The value of specific capacitance calculated at a scan rate 100 mV s−1 is 60.7 F g−1 and 342.5 F g−1 for pristine CNOs and Pt–CNOs respectively. As will be discussed later, the electronic structure calculations of CNOs and Pt–CNOs reveal that mid-gap energy states are introduced due to decoration of CNOs with Pt which causes the observed phenomenal increase in the capacitance of Pt–CNOs. It should be noted that Pt–CNOs do not show any redox peak in CV curves at any scan rate and therefore the capacitive response is purely due to ultrathin electrical double layers (EDLs) formed at electrode–electrolyte interface. The observed values of specific capacitances in case of Pt–CNOs are superior in comparison with earlier reports of pristine CNOs.22,23,27,53,54 The CV curve of CNO samples shows rectangular shape, whereas it is oval shaped in case of Pt–CNOs. However, both samples retain symmetries in one complete cycle, which are measures of formation of EDLs as well as a low contact resistance at electrode–electrolyte interface. Fig. 4b and c show the CVs of CNOs as well as Pt–CNOs at different scan rates (10, 20, 50, 100, 500 and 1000 mV s−1). The systematic increment in the scan rates, results in a continuous gain in the area covered by CV curves for CNOs. However, the successive increment in scan rates results in continuous loss of the specific capacitance (see Table 1). The table summarizes the specific capacitances at different scan rates for pristine CNO and Pt–CNO samples. The capacitance value observed is higher for lower scan rate while for higher scan rate capacitance value decreases. This can be ascribed to the fact that CNO based electrode is not fully utilized at higher scan rates due to the concentration polarization, which in turn slows down the momentum of electrolyte ions. The specific capacitances of Pt–CNOs follow similar pattern to that of CNOs at successively higher scan rate, however, it is affected by the higher concentration of polarized electrolyte ions (see Table 1). Fig. 4d shows the typical comparative charge–discharge profiles of both the samples at specific current density 10 A g−1. The charging–discharging time of Pt–CNO is more than that of the pristine CNO. This further supports superior charge storage capacity of Pt–CNO compared to that of pristine CNO.

 | ||
| Fig. 4 Electrochemical performance characteristics of CNOs and Pt–CNOs measured in a three-electrode system in the 0.1 M Na2SO4 electrolyte. (a) Comparative CVs of CNOs and Pt–CNOs at a scan rate of 100 mV s−1. (b and c) CVs of CNOs and Pt–CNOs at different scan rates. (d) Comparative charge–discharge profiles of CNOs and Pt–CNOs at 10 A g−1 specific current density. | ||
| Sample | Voltage scan rate, 10 mV s−1 | Voltage scan rate, 50 mV s−1 | Voltage scan rate, 100 mV s−1 | Voltage scan rate, 500 mV s−1 | Voltage scan rate, 1000 mV s−1 |
|---|---|---|---|---|---|
| CNO | 93.8 | 75.5 | 60.7 | 37.9 | 30.0 |
| Pt–CNO | 837.4 | 572.4 | 342.5 | 78.9 | 31.6 |
For the practical application, stability of the electrode is an important and decisive parameter, and therefore response of capacitance was recorded up to 2000 cycles for Pt–CNOs and compared with pristine CNOs in the range −0.3 V to 0.5 V at 1.0 A g−1 in 0.1 M Na2SO4 aqueous electrolyte as shown in Fig. 5a and b. The charging discharging time for 2000 cycles of Pt–CNO (2800 s) is much higher than that of CNO (436 s). This further confirms the superior storage capacity of Pt–CNOs than the pristine CNOs. As shown in Fig. 5c, Pt–CNO sample takes nearly 10 cycles to stabilize the storage capacity, after which the value of specific capacitance is nearly stable. In contrast, zero capacitance loss is exhibited by CNOs. However, its specific capacitance is very low and cannot be utilized for practical purpose. The capacitance retention values are ∼100% and ∼83% for pristine CNOs and Pt–CNOs respectively after initial 10 cycles. The retention in Pt–CNOs is mainly due to adsorption of carbon monoxide53 from atmosphere onto the Pt surfaces which blocks the active sites and thereby poisoning the Pt nanoparticles decorated on CNOs. The electron/ion transport at electrode–electrolyte interface and charge transfer resistance (Rct) is further investigated by electrochemical impedance spectroscopy (EIS) techniques.54,55 The EIS spectra (Nyquist plots) of CNOs and Pt–CNOs were measured under the influence of initial voltage amplitude of −0.5 V and 0.005 V respectively in the frequency range (0.1–1 × 10⁶ Hz) at an open circuit potential (see the ESI Fig. S5 and S6†) which depicts the EIS measurement of pristine CNOs at different frequencies at (0.1 M solution of Na2SO4). These are typical plots consisting of a semicircular arc at higher frequencies and a straight line at lower frequencies as shown in Fig. 5d. The diameter of semicircular arc measures the charge transfer limiting process and is a combination of faradaic charge transfer resistance (Rct) in parallel with the double layer capacitances at electrode–electrolyte interfaces. On the other hand, the straight line inclining to the real axis determines the Warburg impedance. The slope of Warburg impedance exhibits diffusion of electrolyte ions into the electrodes,46 and zero slopes to the real axis correspond to zero diffusion resistance. The Pt–CNOs show lower Warburg impedance than CNOs. The semicircular arc begins from the same position in both the samples (CNOs and Pt–CNOs), which signifies that decoration of Pt has little effect on the ohmic resistance of the supercapacitor device. The Rct values of Pt–CNOs and CNOs measured in 0.1 Na2SO4 are 80.0 Ω and 122.0 Ω respectively. The lower value of Rct shown by Pt–CNOs can be attributed to the high active surface area and minimization in path lengths as discussed in the literature.46 The maximum energy density of ∼115 W h kg−1 is observed in case of pristine CNOs while in case of Pt–CNOs it is up to ∼1484 W h kg−1.
 | ||
| Fig. 5 (a and b) Charging–discharging profiles of CNOs and Pt–CNOs at a specific current density of 20 A g−1 (c) cyclic stability of CNOs and Pt–CNOs at a charge–discharge specific current density of 20 A g−1 for 2000 cycles in the 0.1 M Na2SO4 aqueous electrolyte. (d) Electrochemical impedance spectra of CNOs and Pt–CNOs. | ||
3.2. Computational results
Understanding the observed enhancement of capacitance with addition of Pt atoms to the CNOs requires an understanding of how the electronic structure gets modified with the decoration of CNOs with platinum nanoparticles. Density Functional Theory (DFT) is now a well established theoretical tool to investigate materials to gain understanding about them at nanoscale. It is used quite regularly to compliment experiments to provide further insight and to explain the experimentally observed phenomena. In this work, we use the same to gain understanding of the experimentally observed increased capacitance reported above. Experimentally synthesized CNOs typically consist of 5–10, or more layers of carbon atoms, and comprise of few thousands or more atoms. Simulating such huge system using the DFT is a computationally humongous task, and the computation needs to be scaled down using appropriate representative models. Here, we simulate one/two layered concentric fullerenes, consisting of few hundred atoms, to represent the CNOs. We also test that the calculated results scale with increasing number of layers of atoms, within the limits of available computational resources. The fullerenes used in this work are representative of the general features of the CNOs, viz. concentric spherical carbon atomic shells. The smallest sized CNO simulated in this work consists of single shell of carbon atoms in form of the Buckminster fullerene (C60). The C60 was progressively decorated with 1, 2, 3 and 4 Pt atoms and changes in the electronic structure of the system were monitored from bare C60 to the 4 atom decorated C60 (see Fig. 6a). It was found that the bare C60 possessed no electronic states near its Fermi level (EF), while the density of states (DOS) near the EF go on increasing with the addition of every Pt atom. This difference becomes clear upon comparing the DOS of bare C60 with that of the C60 + Pt4, and is shown in Fig. 6b. In order to confirm that the same trend is followed with increasing number of shells; we performed similar experiment with the two shelled fullerene (C300). C300 was decorated with platinum atoms ranging in number between 2 and 32 (Fig. 6c). The resulting analysis showed that the DOS at the EF was again getting increasingly populated as more Pt atoms were added to the C300 cluster (see Fig. 6d). Thus, the increased capacitance due to addition of Pt atoms is on account of the mid-gap energy states made available to the CNO + Pt system, which were not present in the bare CNO. It was also found that the Pt atoms preferred to cluster together to form structures that adhere to the fullerene surface, rather that covering the surface uniformly. In both cases, viz., C60 as well as C300, Pt atoms are bound to the fullerene surface at a relatively large distance, than a C–Pt dimer bond length. While C–Pt dimer bond length is ∼1.7 Å, the C–Pt distance in case of C300 + Pt32 lies between 2.11 Å and 2.18 Å. Thus, C and Pt atoms in the CNO + Pt system are nearly 26% farther away than the free standing C–Pt dimer. This large distance of separation points to the fact that C and Pt in the CNO + Pt system are bound by the weak van der Waals interaction, rather than being held by exchange/sharing of their valence electrons. Electron localization function,48,49 as well as electron charge density show no sharing/exchange of valence electrons, supporting the fact that the system is bound by the weak van der Waals interaction.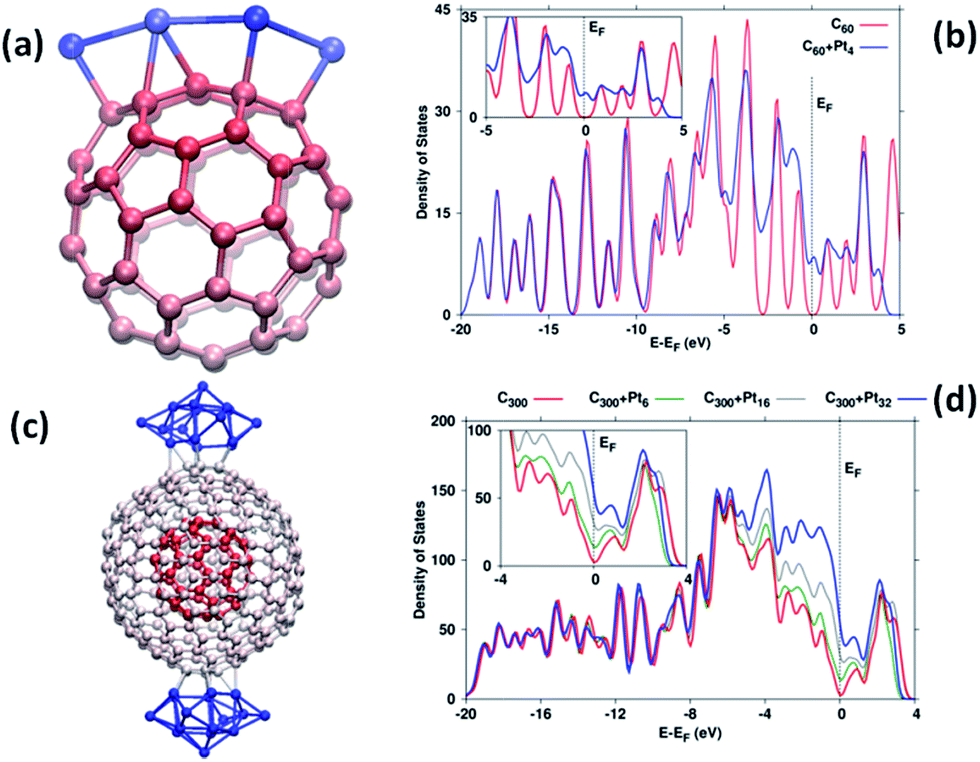 | ||
| Fig. 6 (a) C60 decorated with four Pt atoms. Red spheres represent the carbon atoms, while dark blue, the Pt atoms. (b) Graph of density of states (DOS) of bare C60 shell plotted along with the DOS of C60 + Pt4. Fermi energy (EF) is taken as the zero of the x-axis. No DOS is visible at the Fermi level for the bare C60, but energy levels get populated at EF when Pt atoms decorate the C60. (c) Two shelled fullerene, C300, decorated with 32 Pt atoms. The red as well as the grey spheres represent carbon atoms, while dark blue colored spheres represent the Pt atoms. Carbon atoms are colored different in order to show the two different shells. (d) DOS of bare C300 and C300 + Pt6/Pt16/Pt32. Fermi energy (EF) is taken as the zero of the x-axis. A similar increase in DOS around EF appears with increasing number of Pt atoms decorating the C300. Inset of Fig. 6b and d shows the energy region around the Fermi level. | ||
3.3. Field emission
Fig. 7a shows the FE current density versus applied electric field (J–E) characteristic of the pristine CNOs and Pt–CNOs recorded at a base pressure of ∼1 × 10⁻⁸ mbar. The measured values of the turn-on and threshold field, corresponding to emission current densities ∼1 and ∼10 μA cm−2, are found to be ∼3.9 and ∼5.0 V μm−1, for pristine CNOs and ∼2.5 and ∼2.9 V μm−1, for Pt–CNOs emitters, respectively. Moreover, high emission current density ∼0.630 mA cm−2 was drawn from the Pt–CNOs emitter at relatively lower applied electric field of ∼4.5 V μm−1. For the pristine CNOs emitter, emission current density of ∼0.4 mA cm−2 was achieved at an applied electric field ∼6.6 V μm−1. Table 2 shows the comparative FE performance of CNOs and Pt–CNOs emitters. The FE results demonstrate that the Pt–CNOs emits electrons at a relatively lower applied electric, and exhibits competency to deliver high current density, in contrast to the pristine CNOs emitter. The enhanced FE performance of the Pt–CNOs can be attributed to ‘active’ role played by the Pt nanoparticles. The higher emission current density of Pt–CNOs attributed to the enhanced ‘local’ electric field at the surface of Pt nanoparticles (due to their nanometre size), in addition to the CNOs edges and may lead to higher electron emission. Accordingly, the superior FE behaviour of the Pt–CNOs emitter can be attributed to the combined effect of enhanced electrical conductivity of the nanostructure and increase in the number of emission sites by functionalizing CNOs with the smaller size Pt nanoparticles. The computational analysis based on DFT shows that the density of states near the Fermi increases with the addition of every Pt atom on CNOs, resulting into enhanced electrical conductivity of Pt–CNOs. The modified form of the Fowler–Nordheim (F–N) equation16–21,56,57 for a flat multi-tip emitter is given as,where J is the emission current density, E is the applied average electric field, a and b are constants, typically 1.54 × 10⁻¹⁰ (A V−2 eV) and 6.83 × 10³ (V eV−3/2 μm−1), respectively, ϕ is the work function of the emitter material, λm a macroscopic pre-exponential correction factor, νF is value of the principal Schottky–Nordheim barrier function (a correction factor) and β is the field enhancement factor. Here we considered the applied electric field E is defined as E = V/d, where V is the applied voltage, d is the separation between anode and cathode (∼1 mm) and A is the total area of the emitter (∼1 cm2). The J–E characteristic was further examined by plotting a graph of ln(J/E2) versus (1/E), known as a Fowler–Nordheim (F–N) plot. The obtained F–N plot as shown in Fig. 7b exhibits overall linear behaviour indicates metallic nature of the emitter.16–21 The field enhancement factor was estimated from the slope (m) of the F–N plot. As a result, the estimated value of field enhancement factor (β) for pristine CNOs is ∼1708 and for Pt–CNOs is ∼2990 which signifies the enhanced FE behaviour by the decoration of the Pt nanoparticles.

 | ||
| Fig. 7 (a) Field emission current density versus applied electric field (J–E) curve (b) Fowler–Nordheim (F–N) plot (c) emission current stability with inset shows FE micrographs for pristine CNOs (d) emission current stability for pristine Pt–CNOs with inset shows FE micrographs. | ||
| Field emitter cathode | Turn-on field (V μm−1) at 1 A cm−2 | Threshold field (V μm−1) at 10 A cm−2 | Field enhancement factor (β) |
|---|---|---|---|
| CNO | 3.9 | 5.0 | 1708 |
| Pt–CNO | 2.56 | 2.96 | 2990 |
Moreover, the field emission current stability was examined as an important factor for the practical applications. The emission current versus time (I–t) plot corresponding to pre-set value of ∼5 μA for the pristine CNOs and Pt–CNOs was recorded over a period of 4 hours at a base pressure of 1 × 10⁻⁸ mbar as shown in the Fig. 7c and d respectively. Fig. 7d shows the emission current of Pt–CNOs which is almost steady; while Fig. 7c shows the instability in the emission current of the pristine CNOs. Inset of Fig. 7c and d shows the field emission micrograph of pristine CNOs and Pt nanoparticle decorated CNOs respectively.
4. Conclusions
In conclusion we have demonstrated the successful fabrication and comprehensive suite supercapacitor performance along with field emission behaviour of Pt nanoparticle decorated CNOs. The Pt–CNOs show outstanding supercapacitor performance, worthy of further investigations. The Rct at electrode–electrolyte interface in Pt–CNOs is much lower than pristine CNOs which is an important underlying factor for the high performance of Pt–CNOs. The solid-state supercapacitors based on Pt–CNO hybrid nanostructures were fabricated, which exhibit good electrochemical performance with an energy density of 1484.6 W h kg−1. Furthermore, the FE characteristics of the Pt–CNOs emitter in terms of turn-on and threshold field values are found to be superior to those of pristine CNOs. Additionally, the high emission current density ∼0.630 mA cm−2 was drawn from the Pt–CNOs emitter at relatively lower applied field of ∼4.5 V μm−1. The enhanced FE behavior attributed to the increase in the field enhancement factor β ∼ 2990 for Pt–CNOs. The DFT calculations revealed that the decoration of Pt nanoparticle on CNOs induces the mid-gap states around the Fermi energy. The availability of these states was mainly responsible for the increase in the observed enhanced supercapacitance performance of Pt–CNOs and FE behaviour. It is noteworthy that the Pt atoms preferred to form clusters over the CNO surface, rather than covering the CNO surface uniformly. Thus, the unique features, like high surface area, homogeneous decoration of Pt nanoparticles (responsible for population of the mid-gap states), good electrical conductivity and large field enhancement factor, offered by the Pt–CNOs system have synergic effect in exhibiting excellent supercapacitor and FE performance.Acknowledgements
DJL would also like to acknowledge Prof. C. N. R. Rao (FRS) (Director, International Center for Materials Science and Honorary Director JNCASR, Bangalore), and Prof. V. P. Dravid (Director, NUANCE Center, Northwestern University, USA). The research was primarily supported by NCL-MLP project grant 028626. DJL and CSR would like to thank DST for Ramanujan fellowship SR/S2/RJN-130/2012; SR/S2/RJN-21/2012 and partial financial support under DST/SERB fast-track Project No. SB/FT/CS-116/2013 and BRNS 34/14/20/2015. A part of the reported work (fabrication/characterization) was carried out at the IITBNF, IIT under INUP which is sponsored by DeitY, MCIT, Government of India. VK and KJ acknowledge and CSC-0129 for financial support and CSIR-4PI for computational facility. Mr Sachin Suryawanshi gratefully acknowledges the financial support from BARC, Mumbai, for the award of Senior Research Fellowship under BARC-UoP memorandum (Grant code: GOI-E-153). MAM would like to thank the BCUD, Savitribai Phule Pune University for the financial support provided for the field emission work under CNQS-UPE-UGC program activity.References
- K. S. Novoselov, D. Jiang, F. Schedin, T. J. Booth, V. V. Khotkevich, S. V. Morozov and A. K. Geim, Proc. Natl. Acad. Sci. U. S. A., 2005, 102, 10451–10453 CrossRef CAS PubMed.
- K. S. Novoselov, A. K. Geim, S. V. Morozov, D. Jiang, M. I. Katsnelson, I. V. Grigorieva, S. V. Dubonos and A. A. Firsov, Nature, 2005, 438, 197–200 CrossRef CAS PubMed.
- L. Liao, J. Bai, R. Cheng, Y. Lin, S. Jiang, Y. Qu, Y. Huang and X. F. Duan, Nano Lett., 2010, 10, 3952–3956 CrossRef CAS PubMed.
- F. Schwierz, Nat. Nanotechnol., 2010, 5, 487–496 CrossRef CAS PubMed.
- W. Yuan and G. Shi, Graphene-Based Gas Sensors, J. Mater. Chem. A, 2013, 1, 10078 CAS.
- Y. P. Dan, Y. Lu, N. J. Kybert, Z. Luo and A. T. C. Johnson, Nano Lett., 2009, 9, 1472–1475 CrossRef CAS PubMed.
- Y. Wang, Z. Q. Shi, Y. Huang, Y. F. Ma, C. Y. Wang, M. M. Chen and Y. S. Chen, J. Phys. Chem. C, 2009, 113, 13103–13107 CAS.
- (a) S. R. C. Vivekchand, C. S. Rout, K. S. Subrahmanyam, A. Govindaraj and C. N. R. Rao, J. Chem. Sci., 2008, 120, 9–13 CrossRef CAS; (b) L. Echegoyen, A. Ortiz, M. N. Chaur and A. J. Palkar, Carbon Nano Onions, in Chemistry of Nanocarbons, ed. T. Akasaka, F. Wudl and S. Nagase, John Wiley & Sons, Chichester, UK, 2010, pp. 463–483 Search PubMed; (c) J. Bartelmess and S. Giordani, Beilstein J. Nanotechnol., 2014, 5, 1980 CrossRef PubMed.
- M. D. Stoller, S. Park, Y. Zhu, J. An and R. S. Ruoff, Nano Lett., 2008, 8, 3498–3502 CrossRef CAS PubMed.
- L. G. Arco, Y. Zhang, C. W. Schlenker, K. Ryu, M. E. Thompson and C. Zhou, ACS Nano, 2010, 4, 2865–2873 CrossRef PubMed.
- N. Yang, J. Zhai, D. Wang, Y. Chen and L. Jiang, ACS Nano, 2010, 4, 887–894 CrossRef CAS PubMed.
- Y. H. Jang, X. Xin, M. Byun, Y. J. Jang, Z. Lin and D. H. Kim, Nano Lett., 2012, 12, 479–485 CrossRef CAS PubMed.
- X. Li, H. Zhu, K. Wang, A. Cao, J. Wei, C. Li, Y. Jia, Z. Li, X. Li and D. Wu, Adv. Mater., 2010, 22, 2743–2748 CrossRef CAS PubMed.
- T. Mueller, F. Xia and P. Avouris, Nat. Photonics, 2010, 4, 297–301 CrossRef CAS PubMed.
- F. Xia, T. Mueller, Y. Lin, A. Valdes-Garcia and P. Avouris, Nat. Nanotechnol., 2009, 4, 839–843 CrossRef CAS PubMed.
- U. A. Palnitkar, R. V. Kashid, M. A. More, D. S. Joag, L. S. Panchakarla and C. N. R. Rao, Appl. Phys. Lett., 2010, 97, 063102 CrossRef PubMed.
- M. Wang, D. Golberg and Y. Bando, ACS Nano, 2010, 4, 4396–4402 CrossRef CAS PubMed.
- R. B. Sharma, D. J. Late, D. S. Joag, A. Govindaraj and C. N. R. Rao, Chem. Phys. Lett., 2006, 428, 102–108 CrossRef CAS PubMed.
- (a) A. K. Samantara, D. K. Mishra, S. R. Suryawanshi, M. A. More, R. Thapa, D. J. Late, B. K. Jena and C. S. Rout, RSC Adv., 2015, 5, 41887–41893 RSC; (b) K. K. Naik, R. Khare, D. Chakravarty, M. A. More, R. Thapa, D. J. Late and C. S. Rout, Appl. Phys. Lett., 2014, 105, 233101 CrossRef PubMed.
- (a) R. Khare, D. B. Shinde, S. Bansode, M. A. More, M. Majumder, V. K. Pillai and D. J. Late, Appl. Phys. Lett., 2015, 106, 023111 CrossRef PubMed; (b) S. R. Suryawanshi, P. K. Bankar, M. A. More and D. J. Late, RSC Adv., 2015, 5, 65274–65282 RSC.
- (a) C. S. Rout, P. D. Joshi, R. V. Kashid, D. S. Joag, M. A. More, A. J. Simbeck, M. Washington, S. K. Nayak and D. J. Late, Sci. Rep., 2013, 3, 3282 CrossRef PubMed; (b) R. V. Kashid, D. J. Late, S. S. Chou, Y. Huang, M. De, D. S. Joag, M. A. More and V. P. Dravid, Small, 2013, 9, 2730–2734 CrossRef CAS PubMed; (c) M. B. Erande, S. R. Suryawanshi, M. A. More and D. J. Late, Eur. J. Inorg. Chem., 2015, 19, 3102–3107 CrossRef PubMed; (d) S. R. Suryawanshi, P. S. Kolhe, C. S. Rout, D. J. Late and M. A. More, Ultramicroscopy, 2015, 149, 51–57 CrossRef CAS PubMed; (e) D. J. Late, P. A. Shaikh, R. Khare, R. V. Kashid, M. Chaudhary, M. A. More and S. Ogale, ACS Appl. Mater. Interfaces, 2014, 6, 15881–15888 CrossRef CAS PubMed.
- D. Pech, M. Brunet, H. Durou, P. Huang, V. Mochalin, Y. Gogotsi, P. Taberna and P. Simon, Nat. Nanotechnol., 2010, 5, 651–654 CrossRef CAS PubMed.
- R. Borgohain, J. Li, J. P. Selegue and Y. T. Cheng, J. Phys. Chem. C, 2012, 116, 15068–15075 CAS.
- W. Liu, Y. Feng, X. Yan, J. Chen and Q. Xue, Adv. Funct. Mater., 2013, 23, 4111–4122 CrossRef CAS PubMed.
- Y. Hu, Y. Zhao, G. Lu, N. Chen, Z. Zhang, H. Li, H. Shao and L. Qu, Nanotechnology, 2013, 24, 195401 CrossRef PubMed.
- J. S. Lee, D. H. Shin, J. Jun, C. Lee and J. Jang, ChemSusChem, 2014, 7, 1676–1683 CrossRef CAS PubMed.
- (a) J. J. Yoo, K. Balakrishnan, J. Huang, V. Meunier, B. G. Sumpter, A. Srivastava, M. Conway, A. L. M. Reddy and J. Yu, et al., Nano Lett., 2011, 11, 1423–1427 CrossRef CAS PubMed; (b) A. Palkar, F. Melin, C. M. Cardona, B. Elliott, A. K. Naskar, D. D. Edie, A. Kumbhar and L. Echegoyen, Chem.–Asian J., 2007, 2, 625–633 CrossRef CAS PubMed.
- Q. Zhang, K. Scrafford, M. Li, Z. Cao, Z. Xia, P. M. Ajayan and B. Wei, Nano Lett., 2014, 14, 1938–1943 CrossRef CAS PubMed.
- J. J. Guo, G. H. Liu, X. M. Wang, T. Fujita, B. S. Xu and M. W. Chen, Appl. Phys. Lett., 2009, 95, 051920 CrossRef PubMed.
- H. W. Kroto, J. R. Heath, S. C. O'Brien, R. F. Curl and R. E. Smalley, Nature, 1985, 318, 162–163 CrossRef CAS PubMed.
- R. Taylor and D. R. M. Walton, Nature, 1993, 363, 685–693 CrossRef CAS PubMed.
- S. Iijima and T. Ichihashi, Nature, 1993, 363, 603–605 CrossRef CAS PubMed.
- R. H. Baughman, A. A. Zakhidov and W. A. de Heer, Science, 2002, 297, 787–792 CrossRef CAS PubMed.
- A. H. Castro Neto, N. M. R. Peres, K. S. Novoselov and A. K. Geim, Rev. Mod. Phys., 2009, 81, 109–162 CrossRef CAS.
- D. Ugarte, Nature, 1992, 359, 707–709 CrossRef CAS PubMed.
- S. S. Warule, N. S. Chaudhari, R. T. Khare, J. D. Ambekar, B. B. Kale and M. A. More, CrystEngComm, 2013, 15, 7475 RSC.
- V. S. Kale, R. R. Prabhakar, S. S. Pramana, M. Rao, C. H. Sow, K. B. Jinesh and S. G. Mhaisalkar, Phys. Chem. Chem. Phys., 2012, 14, 4614–4619 RSC.
- J. Svensson, A. A. Sourab, Y. Tarakanov, D. S. Lee, S. J. Park, S. J. Baek, Y. W. Park and E. E. Campbell, Nanotechnology, 2009, 20, 175204 CrossRef PubMed.
- J. Teddy, A. Falqui, A. Corrias, D. Carta, P. Lecante, I. Gerber and P. Serp, J. Catal., 2011, 278, 59–70 CrossRef CAS PubMed.
- R. Borgohain, J. Yang, J. P. Selegue and D. Y. Kim, Carbon, 2014, 66, 272–284 CrossRef CAS PubMed.
- M. V. K. Azhagan, M. V. Vaishampayan and M. V. Shelke, J. Mater. Chem. A, 2014, 2, 2152–2159 CAS.
- D. Rathod, C. Dickinson, D. Egan and E. Dempsey, Sens. Actuators, B, 2010, 143, 547–554 CrossRef CAS PubMed.
- G. Kresse and J. Hafner, Phys. Rev. B: Condens. Matter Mater. Phys., 1994, 49, 14251–14269 CrossRef CAS.
- G. Kresse and J. Furthmüller, Phys. Rev. B: Condens. Matter Mater. Phys., 1996, 54, 11169–11186 CrossRef CAS.
- G. Kresse and J. Furthmüller, Comput. Mater. Sci., 1996, 6, 15–50 CrossRef CAS.
- G. Kresse and D. Joubert, Phys. Rev. B: Condens. Matter Mater. Phys., 1999, 59, 1758–1775 CrossRef CAS.
- J. P. Perdew, K. Burke and M. Ernzerhof, Phys. Rev. Lett., 1996, 77, 3865–3868 CrossRef CAS.
- J. P. Perdew, K. Burke and M. Ernzerhof, Phys. Rev. Lett., 1997, 78, 1396 CrossRef CAS.
- B. Silvi and A. Savin, Nature, 1994, 371, 683–686 CrossRef CAS PubMed.
- A. S. Rettenbacher, B. Elliott, J. S. Hudson, A. Amirkhanian and L. Echegoyen, Chem.–Eur. J., 2005, 12, 376–387 CrossRef CAS PubMed.
- H. Lu, P. K. Eggers, C. T. Gibson, X. Duan, R. N. Lamb, C. L. Raston and H. T. Chua, New J. Chem., 2015, 2, 915–920 RSC.
- A. Prakash and D. Bahadur, ACS Appl. Mater. Interfaces, 2014, 6, 1394–1405 CAS.
- D. Santiago, G. G. Rodriguez-Calero, A. Palkar, D. Barraza-Jimenez, D. H. Galvan, G. Casilla, A. Mayoral, M. Jose-Yacaman, L. Echegoyen and C. R. Cabrera, Langmuir, 2012, 28, 17202–17210 CrossRef CAS PubMed.
- W. G. Pell, B. E. Conway and N. Marincic, J. Electroanal. Chem., 2000, 491, 9–21 CrossRef CAS.
- N. Ding, J. Xu, Y. X. Yao, G. Wegner, X. Fang, C. H. Chen and I. Lieberwirth, Solid State Ionics, 2009, 180, 222–225 CrossRef CAS PubMed.
- R. G. Forbes, J. Appl. Phys., 2008, 103, 114911 CrossRef PubMed.
- R. G. Forbes, Nanotechnology, 2012, 23, 095706 CrossRef PubMed.
Footnote |
| † Electronic supplementary information (ESI) available: HR-TEM images, X-RD pattern of CNOs and Pt–CNOs. See DOI: 10.1039/c5ra12364j |
| This journal is © The Royal Society of Chemistry 2015 |