DOI:
10.1039/C5RA12324K
(Paper)
RSC Adv., 2015,
5, 67727-67737
Synthesis, characterization, TDDFT calculation and biological activity of tetradentate ligand based square pyramidal Cu(II) complexes†
Received
25th June 2015
, Accepted 24th July 2015
First published on 24th July 2015
Abstract
Distorted square pyramidal complexes [Cu(L1)(H2O)]·ClO4 (1), [Cu(L2)(H2O)]·ClO4 (2) and [Cu(L3)(H2O)]·ClO4 (3) (HL1 = o-{[2-(2-aminoethylamino)ethylimino]methyl}phenol; HL2 = 2-{[2-(2-aminoethylamino)ethylimino]methyl}-6-methoxyphenol; HL3 = o-{1-[2-(2-aminoethylamino)ethylimino]ethyl}phenol) have been synthesized, and characterized by X-ray crystallography and spectroscopic analysis. All the complexes exhibit fluorescence at room temperature [λex = 267 nm, λem = 312, 329 and 357 nm, φ = 0.52 for 1; λex = 272 nm, λem = 312, 329 and 355 nm, φ = 0.46 for 2; λex = 265 nm, λem = 312, 356 and 377 nm, φ = 0.33 for 3]. The electronic structure and photophysical properties of the ligands and complexes were calculated by density functional theory (DFT) and time-dependent density functional theory (TD-DFT) methods using the B3LYP, B3PW91 and MPW1PW91 functionals, with 6-31G (d-p) and LanL2DZ basis sets. The results of TD-DFT calculations are functional-dependent and among the functionals, B3LYP was able to best reproduce the experimental results. Catecholase activity of 1–3 has been investigated using 3,5-di-tert butyl catechol (3,5-DTBC) as the model substrate and found that complexes are active for catalyzing the aerobic oxidation of 3,5-DTBC to 3,5-di-tert butyl benzoquinone (3,5-DTBQ). The compound with more distorted square pyramidal geometry shows a higher rate of catalytic activity. All the complexes have been tested for their anticancer activities in human breast (MCF7) cancer cell lines. Complexes show dose dependent suppression of cell viability with IC50 values 30, 68 and >100 μM for 1, 2 and 3, respectively. Anticancer activities of 1–3 and cisplatin were compared, and found that 1–3 were relatively less active than cisplatin.
Introduction
Coordination compounds of Cu(II) using chelating ligands are of immense interest in the area of catalysis,1 fluorescence,2 chemical sensors,3 etc. Cu(II) complexes are less toxic and have important cellular effects such as neurotransmission, cellular respiration, etc.4 On the other hand, Cu(II) compounds exhibit interesting anticancer activity5 and show catecholase activity.6 These coordination compounds are generally synthesized7 by adopting self-assembly techniques and depending on chelating ligands, Cu(II) exhibit several coordination geometries.8 Adjustment of reaction conditions, which control the metal–ligand aggregation process, is also a vital factor in the design and synthesis of Cu(II) compounds.
Quantum chemical calculations using density functional theory (DFT) and time dependent density functional theory (TD-DFT)9 have been widely used to study the structural, electronic and spectroscopic properties of different compounds. The results of DFT/TD-DFT computation depends on the choice of different DFT functionals.10 It is of note that the use of DFT/TD-DFT computation to explore the electronic properties of Cu(II) compounds are less documented in the literature.11
Over the last few years we have been actively engaged in designing and synthesis of Cu(II) coordination compounds. Here we have chosen tetradentate (O,N,N,N donor) Schiff bases o-{[2-(2-aminoethylamino)ethylimino]methyl}phenol (HL1), 2-{[2-(2-aminoethylamino)ethylimino]methyl}-6-methoxyphenol (HL2) and o-{1-[2-(2-aminoethylamino)ethylimino]ethyl}phenol (HL3), and synthesized [Cu(L1)(H2O)]·ClO4 (1), [Cu(L2)(H2O)]·ClO4 (2) and [Cu(L3)(H2O)]·ClO4 (3). The IR and electronic spectral properties of the ligands and complexes were explained by DFT/TD-DFT computation using different functionals. Anticancer activities in human breast (MCF7) cancer cell and catecholase activities of complexes have been investigated.
Experimental
Materials
High purity diethylenetriamine (Aldrich), 2-hydroxybenzaldehyde, 2-hydroxy-3-methoxybenzaldehyde and 2′-hydroxyacetophenone (Spectrochem-India) were purchased and used as received. All other chemicals used were of analytical grade. Solvents used for spectroscopic studies were purifies and dried by standard procedures before use.12
Physical measurements
Elemental analyses (carbon, hydrogen and nitrogen) were performed using a Perkin-Elmer 240C elemental analyzer. IR spectra were recorded as KBr pellets on a Bruker Vector 22 FT IR spectrophotometer operating from 400 to 4000 cm−1. ESI-MS spectra were recorded on a JEOL MS 700 mass spectrometer in fast atom bombardment (FAB) mode. NMR spectra of ligands recorded on Bruker 200 MHz instrument. Electronic absorption spectra were obtained with Shimadzu UV-1601 UV-vis spectrophotometer at room temperature. Quartz cuvettes with a 1 cm path length and a 3 cm3 volume were used for all measurements. Emission spectra were recorded on a Hitachi F-7000 spectrofluorimeter. Room temperature (300 K) spectra were obtained in methanol solution using a quartz cell of 1 cm path length. The slit width was 2.5 nm for both excitation and emission.
The fluorescence quantum yield was determined using phenol as a reference and water [refractive index (η), 1.333] medium for phenol. The solvent used for complexes is methanol (η, 1.329). Emission spectra were recorded by exciting the complex and the reference phenol at the same wavelength, maintaining nearly equal absorbance (∼0.1). The area of the emission spectrum was integrated using the software available in the instrument and the quantum yield was calculated13 according to the following equation:
where
Φs and
Φr are the fluorescence quantum yield of the sample and reference, respectively.
As and
Ar are the respective optical densities at the wavelength of excitation,
Is and
Ir correspond to the areas under the fluorescence curve; and
ηs and
ηr are the refractive index values for the sample and reference, respectively.
Synthesis of the ligands
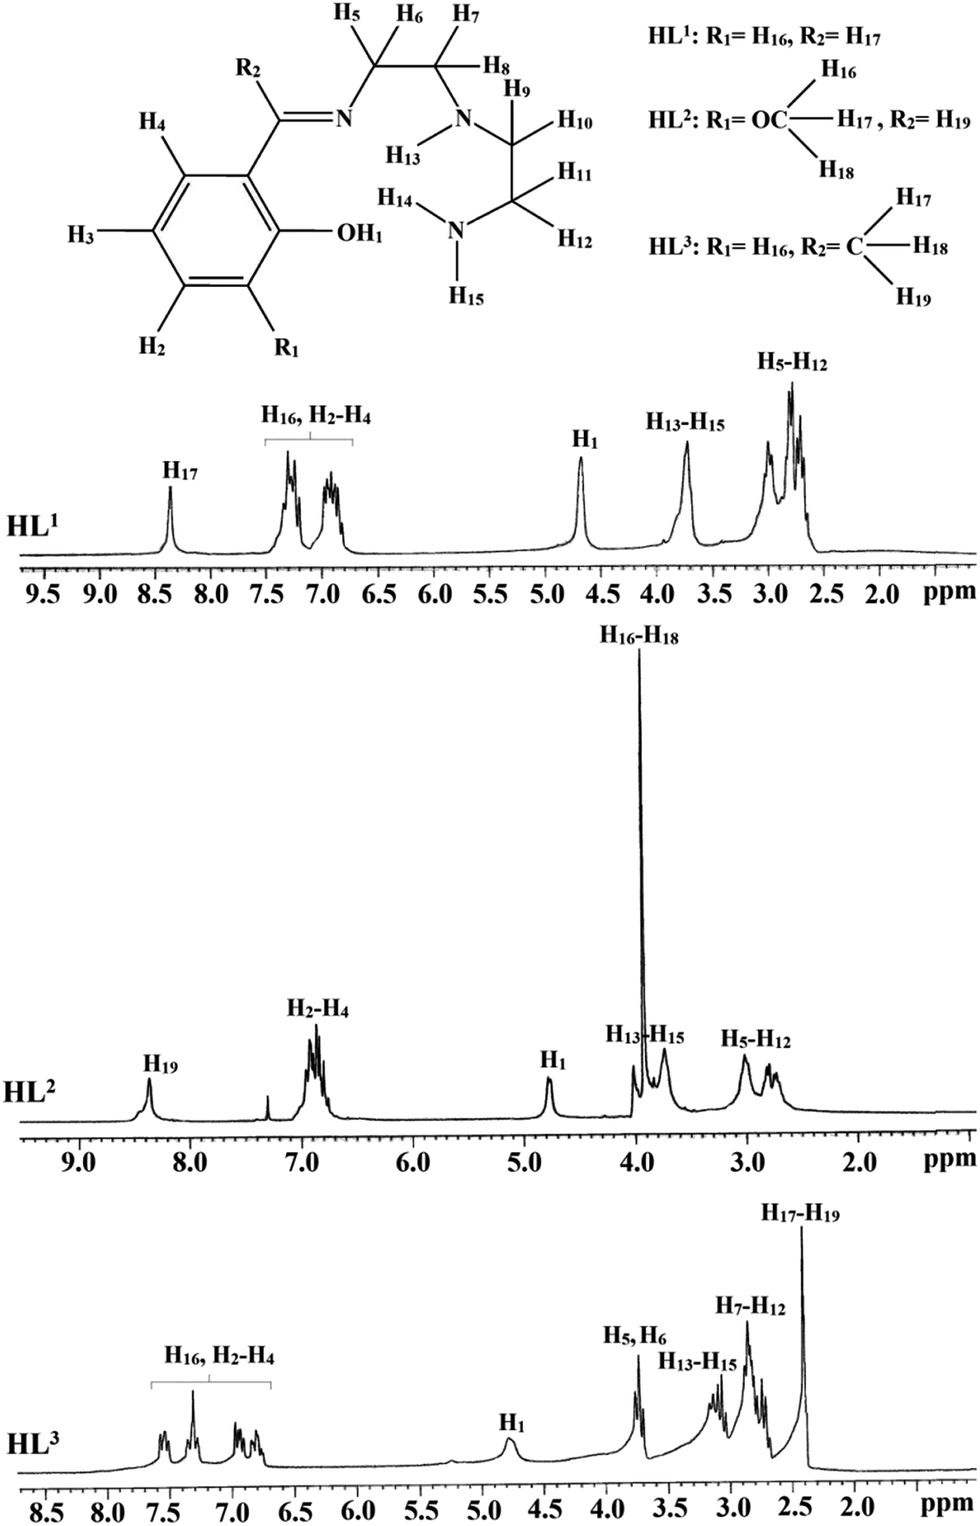
The ligands o-{[2-(2-aminoethylamino)ethylimino]methyl}phenol (HL1), 2-{[2-(2-aminoethylamino)ethylimino]methyl}-6-methoxyphenol (HL2) and o-{1-[2-(2-aminoethylamino)ethylimino]ethyl}phenol (HL3) were prepared by condensation reaction of diethylenetriamine and related aldehydes/ketones. Details of synthesis and characterization of ligands are given in ESI.† 1H NMR spectra of HL1, HL2 and HL3 in CDCl3 is shown in Fig. 1.
 |
| | Fig. 1 1H NMR spectra of HL1, HL2 and HL3 in CDCl3. | |
Synthesis of complexes
Caution! Perchlorate salts of metal complexes with organic ligands are potentially explosive. Only a small amount of material should be prepared, and it should be handled with care.
The complexes have been synthesized by adopting the procedures schematically given in Scheme 1.
 |
| | Scheme 1 Synthesis of 1, 2 and 3. | |
Synthesis of [Cu(L1)(H2O)]·(ClO4) (1). A methanolic solution (5 mL) of triethylamine (1 mmol, 0.10 g) was added dropwise to a methanolic solution (10 mL) of HL1 (1 mmol, 0.20 g) with constant stirring for 5 min. To this resulting mixture, dropwise addition of methanolic solution (10 mL) of copper perchlorate hexahydrate (1 mmol; 0.370 g) yielding a reddish brown solution. The whole reaction mixture was stirred for 2 hours and filtered. Blue single crystals suitable for X-ray diffraction quality were obtained after a few days on keeping the solution in a refrigerator. Yield 0.302 g (78%). C11H18CuN3O6Cl (387.27): C, 34.11; H, 4.68; N, 10.84%. Found: C, 34.09; H, 4.65; N, 10.85 (%). IR (cm−1): 3200–3500 (br,vs), 3102 (s), 2972 (s), 2943 (s), 1649 (s), 1561 (vs), 1460 (s), 1418 (s), 1372 (s), 1300 (s), 1115 (s), 1072 (s), 818 (w), 782 (w), 670 (w), 561 (s), 515 (s).
Synthesis of [Cu(L2)(H2O)]·(ClO4) (2) and [Cu(L3)(H2O)]·(ClO4) (3). These complexes were synthesized by following the same procedure as adopted for complex 1, using HL2 (1 mmol, 0.24 g) and HL3 (1 mmol, 0.22 g) for 2 and 3, respectively, instead of HL1. For 2: yield 0.333 g (80%). C12H20CuN3O7Cl (417.30): C, 34.53; H, 4.83; N, 10.06%. Found: C, 34.52; H, 4.85; N, 10.07 (%). IR (cm−1): 3200–3500 (br,vs), 2975 (s), 2943 (s), 1639 (vs), 1558 (vs), 1467 (s), 1418 (vs), 1372 (s), 1297 (s), 1124 (w), 1079 (s), 883 (w), 815 (w), 782 (w), 629 (s), 515 (s). For 3: yield 0.305 g (76%). C12H20CuN3O6Cl (401.30): C, 35.88; H, 5.02; N, 10.46%. Found: C, 35.87; H, 5.00; N, 10.49 (%). IR (cm−1): 3200–3500 (br,vs), 3094 (s), 2982 (s), 2943 (s), 1643 (vs), 1561 (vs), 1467 (vs), 1414 (vs), 1372 (s), 1300 (s), 1124 (s), 1108 (s), 1082 (s), 883 (w), 779 (s), 639 (s), 551 (s).
Crystallographic data collection and refinement
Data collection of complexes 1, 2 and 3 were carried out by using a Nonius Kappa CCD diffractometer with graphite monochromated Mo-Kα radiation, at room temperature. The data sets were integrated with the Denzo-SMN package14 and corrected for Lorentz, polarization and absorption effects (SORTAV).15 The structures were solved by direct methods using SIR97 (ref. 16) system of programs and refined using full-matrix least-squares with all non-hydrogen atoms anisotropically and hydrogens included on calculated positions, riding on their carrier atoms. All calculations were performed using SHELXL-97 (ref. 17) and PARST18 implemented in WINGX19 system of programs. Graphical programs used are those included in the WinGX System,19 and Diamond.20 Crystal data and details of refinements are given in Table 1 and ESI.†
Table 1 Crystal data and structure refinement for complexes 1–3
| Complex |
1 |
2 |
3 |
| R1(Fo) = ∑||Fo| − |Fc||/∑|Fo|, wR2(Fo2) = [∑w(Fo2 − Fc2)2/∑w(Fo2)2]1/2. |
| Empirical formula |
C11H18CuClN3O6 |
C12H20CuClN3O7 |
C12H20CuClN3O6 |
| Formula mass (g mol−1) |
387.27 |
417.30 |
401.30 |
| Space group |
P21/c |
P3121 |
P21/c |
| Crystal system |
Monoclinic |
Trigonal |
Monoclinic |
| a (Å) |
9.9206(3) |
12.3073(5) |
10.0150(10) |
| b (Å) |
14.4822(4) |
12.3073(5) |
14.9210(10) |
| c (Å) |
10.9734(3) |
19.1117(6) |
11.0160(10) |
| α (°) |
90 |
90 |
90 |
| β (°) |
100.5371(15) |
90 |
107.720(10) |
| γ (°) |
90 |
120 |
90 |
| V (Å3) |
1549.98(8) |
2507.01(16) |
1568.1(3) |
| Z |
4 |
6 |
4 |
| T (K) |
295 |
295 |
295 |
| Dcalc (g cm−3) |
1.660 |
1.658 |
1.700 |
| F(000) |
796 |
1290 |
828 |
| μ (Mo-Kα) (cm−1) |
16.13 |
15.07 |
15.97 |
| Meas. refl. |
6745 |
6036 |
12![[thin space (1/6-em)]](https://www.rsc.org/images/entities/char_2009.gif) 909 909 |
| Unique refl. |
3721 |
3265 |
3063 |
| Rint |
0.0192 |
0.029 |
0.0338 |
| Obs. refl. [I ≥ 2σ(I)] |
3074 |
2732 |
2324 |
| θmin–θmax/° |
3.78–28.00 |
3.8–26.00 |
2.13–26.00 |
| hkl ranges |
−13, 13; −19, 17; −14, 14 |
−15, 15; −12, 12; −22, 23 |
−12, 9; −18, 18; −13, 13 |
| R1 [I ≥ 2σ(I)]a |
0.0424 |
0.0420 |
0.0472 |
| wR2 [I ≥ 2σ(I)]a |
0.1223 |
0.1080 |
0.1409 |
| No. variables/constraints |
219/5 |
238/5 |
229/5 |
| Goodness of fit |
1.046 |
1.030 |
1.051 |
| Δρmax; Δρmin (e Å−3) |
0.745; −0.452 |
0.43; −0.44 |
0.999; −0.574 |
Theory and computational methods
All computations were performed using the Gaussian 09 (G09) software package,21 by using the Becke's three-parameter hybrid exchange functional and the Lee–Yang–Parr non-local correlation functional (B3LYP),10a Becke's three-parameter Perdew–Wang 1991 functional (B3PW91),10b and Barone's modified Perdew–Wang 1991 exchange functional and Perdew and Wang's 1991 correlation functional (MPW1PW91).10c In the calculation 6-31G (d-p) basis set was assigned to all elements with the exception of copper, for which the Los Alamos effective core potentials plus the Double Zeta (LanL2DZ)22 basis set were employed. The geometric structures of the complexes in the ground state (doublet) were fully optimized at the B3LYP, B3PW91 and MPW1PW91 levels. The vibration frequency calculations were performed to ensure that the optimized geometries represent local minima associated with positive eigen values only.
For the purpose of comparison of ground state (S0) stability of keto and enol tautomeric forms of the ligands, potential energy scan were performed indicating the reaction coordinates corresponding to the change of location of the proton from Ndonor to Oacceptor. During potential energy scan all other degrees of freedom were remain undisturbed without imposing any symmetry limit for the ground S0 state.23
Vertical electronic excitations based on B3LYP, B3PW91 and MPW1PW91 functionals were obtained with the time-dependent density functional theory (TD-DFT) formalism24 in methanol using the conductor-like polarizable continuum model (CPCM).25 GaussSum26 was used to calculate the fractional contributions of various groups to each molecular orbital. Calculated coordination geometries of methanol solvated complexes are shown in Tables 2 and 1S.†
Table 2 Experimental and calculateda coordination bond lengths (Å) and angles (°) for complexes 1–3
| Complex |
1 |
2 |
3 |
| Exp |
Calcd |
Exp |
Calcd |
Exp |
Calcd |
| Using conductor-like polarizable continuum model (CPCM) in methanol; basis set, LanL2DZ; B3LYP functional. |
| Bond lengths |
| Cu1–O1 |
1.922(2) |
1.940 |
1.908(3) |
1.940 |
1.862(3) |
1.911 |
| Cu1–O2 |
2.394(2) |
2.328 |
2.428(3) |
2.330 |
2.465(3) |
2.353 |
| Cu1–N1 |
1.939(2) |
1.977 |
1.935(6) |
1.973 |
1.924(3) |
1.994 |
| Cu1–N2 |
2.009(2) |
2.061 |
2.029(4) |
2.060 |
1.960(3) |
2.041 |
| Cu1–N3 |
2.010(3) |
2.065 |
1.988(5) |
2.062 |
2.029(4) |
2.073 |
|
| Bond angles |
| O1–Cu1–O2 |
96.40(1) |
100.86 |
90.22(12) |
100.71 |
94.90(1) |
100.54 |
| O1–Cu1–N1 |
94.20(1) |
93.62 |
94.61(18) |
93.39 |
89.00(1) |
93.72 |
| O1–Cu1–N2 |
172.90(1) |
172.83 |
178.26(14) |
173.09 |
176.80(2) |
173.45 |
| O1–Cu1–N3 |
95.00(1) |
94.71 |
96.02(18) |
94.85 |
99.50(1) |
93.60 |
| O2–Cu1–N1 |
101.80(1) |
98.50 |
107.66(14) |
98.64 |
102.30(1) |
96.13 |
| O2–Cu1–N2 |
90.70(1) |
86.28 |
88.40(14) |
86.15 |
88.10(1) |
85.94 |
| O2–Cu1–N3 |
89.10(1) |
96.28 |
90.94(15) |
96.25 |
88.40(2) |
96.52 |
| N1–Cu1–N2 |
84.60(1) |
84.71 |
84.80(2) |
84.81 |
91.40(2) |
86.33 |
| N1–Cu1–N3 |
164.90(1) |
161.32 |
158.52(17) |
161.30 |
165.80(2) |
163.95 |
| N2–Cu1–N3 |
84.70(1) |
84.94 |
85.10(2) |
84.98 |
79.50(2) |
84.77 |
| τ5 parameter33 |
0.133 |
0.191 |
0.329 |
0.196 |
0.183 |
0.158 |
Cell culture
Breast cancer cell line MCF7 was cultured in DMEM medium as monolayers supplemented with 10% FBS, 100 U per ml penicillin and 100 μg ml−1 streptomycin at 37 °C in a humid condition with 5% CO2 atmosphere.
In vitro cytotoxicity assay
The cytotoxicity of the compounds was determined by the MTT (3-(4,5-dimethylthiazol-2-yl)-2-5-diphenyltetrazolium bromide) assay. Cells were seeded at 5 × 10³ cells per well in 96-well plates. Next day, cells were treated with different concentrations (0.01–100 μM) of the compounds for 48 hour. Then, MTT solution was added to each well and further incubated for 3.5 h at 37 °C in a humid, 5% CO2 atmosphere. Finally, medium containing MTT solution was replaced by MTT solvent (4 mM HCl and 0.1% Triton X-100) and incubated for 15 minute at room temperature. The absorbance was read in Thermo Pierce Elisa plate reader at 570 nm. The percentage of growth inhibition was calculated with respected to vehicle (DMSO) treated cells. All the experiments were repeated for three times.
Results and discussion
Crystal structure description
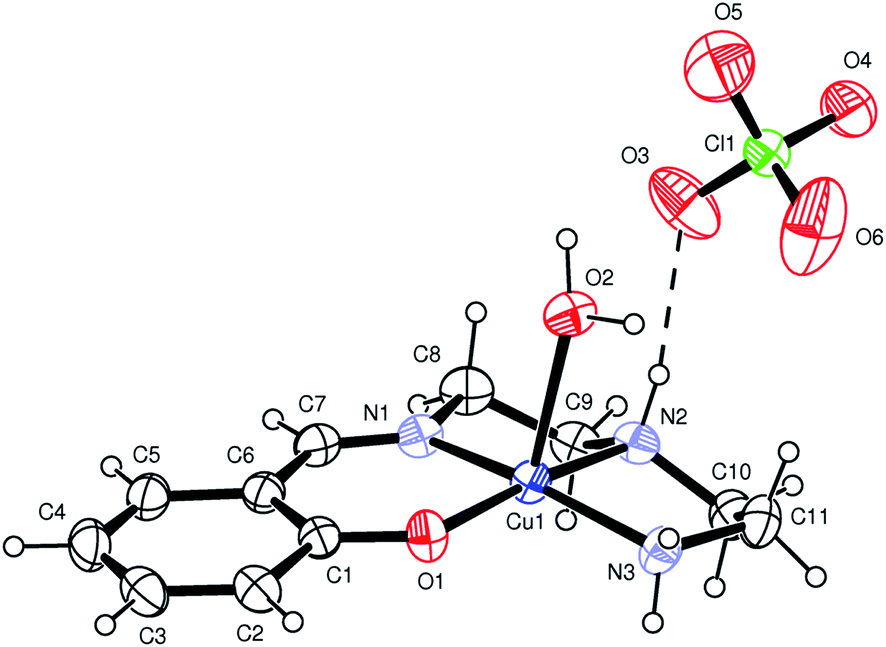
[Cu(L1)(H2O)]·(ClO4) (1), [Cu(L2)(H2O)]·(ClO4) (2) and [Cu(L3)(H2O)]·(ClO4) (3). X-ray structural analysis of complexes 1–3 revealed that the crystals comprise almost identical mononuclear cationic species and Ortep27 views of these complexes are shown in Fig. 2, 1S and 2S.† In each case, the complex is counter balanced by perchlorate anion. The metal has a five coordinate distorted square pyramidal coordination environment where three nitrogen and one oxygen donor from chelating Schiff base form the basal plane, while an aqua ligand occupy the apical position. In the basal plane the coordination bond distances fall in a ranges 1.922(2)–2.010(3) Å (for 1), 1.908(3)–2.029(4) Å (for 2), 1.862(3)–2.029(4) Å (for 3), while the apical Cu(1)–O(2) bond is significantly longer [2.394(2) Å (for 1); 2.428(3) Å (for 2); 2.465(3) Å (for 3)] (Table 2). For all complexes, Cu(1)–O(2)water and Cu(1)–(1)phenolic bond distances are largest and smallest bond distances, respectively. The largest bond angle in all the complexes is O(1)–Cu(1)–N(2) [172.9(1)°, 178.26(14)°, 176.8(2)°], whereas smallest bond angle in 1 and 2 is N(1)–Cu(1)–N(2) [84.6 (1)°, 84.8(2)°], and in 3 is N(2)–Cu(1)–N(3) [79.5(2)°].
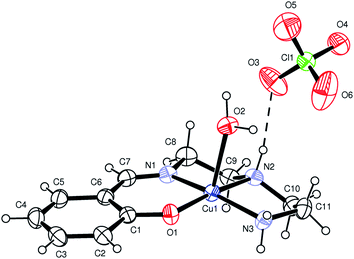 |
| | Fig. 2 ORTEP diagram (ellipsoids at 30% probability) of 1. | |
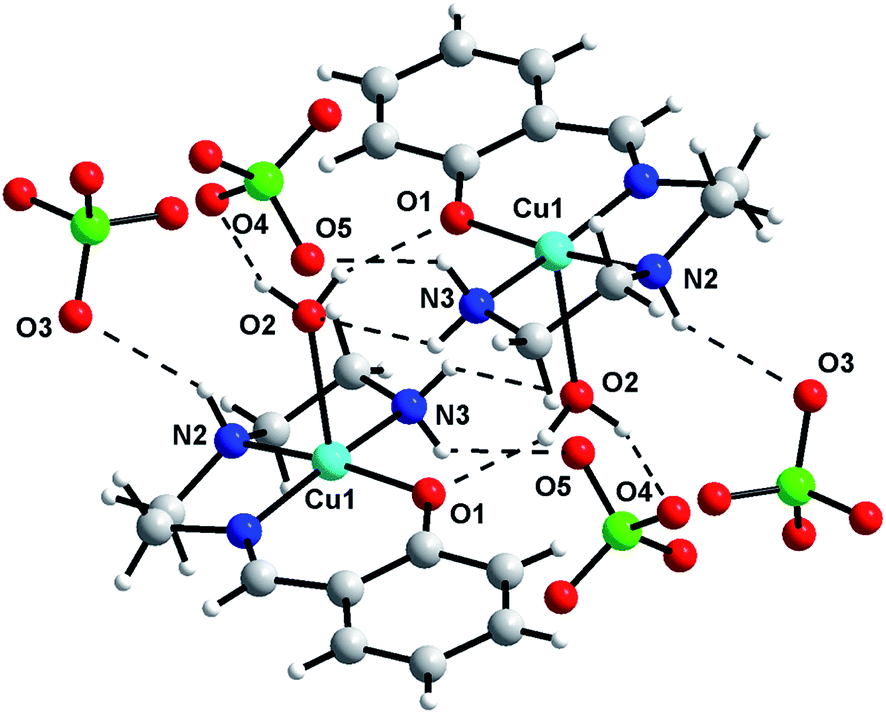
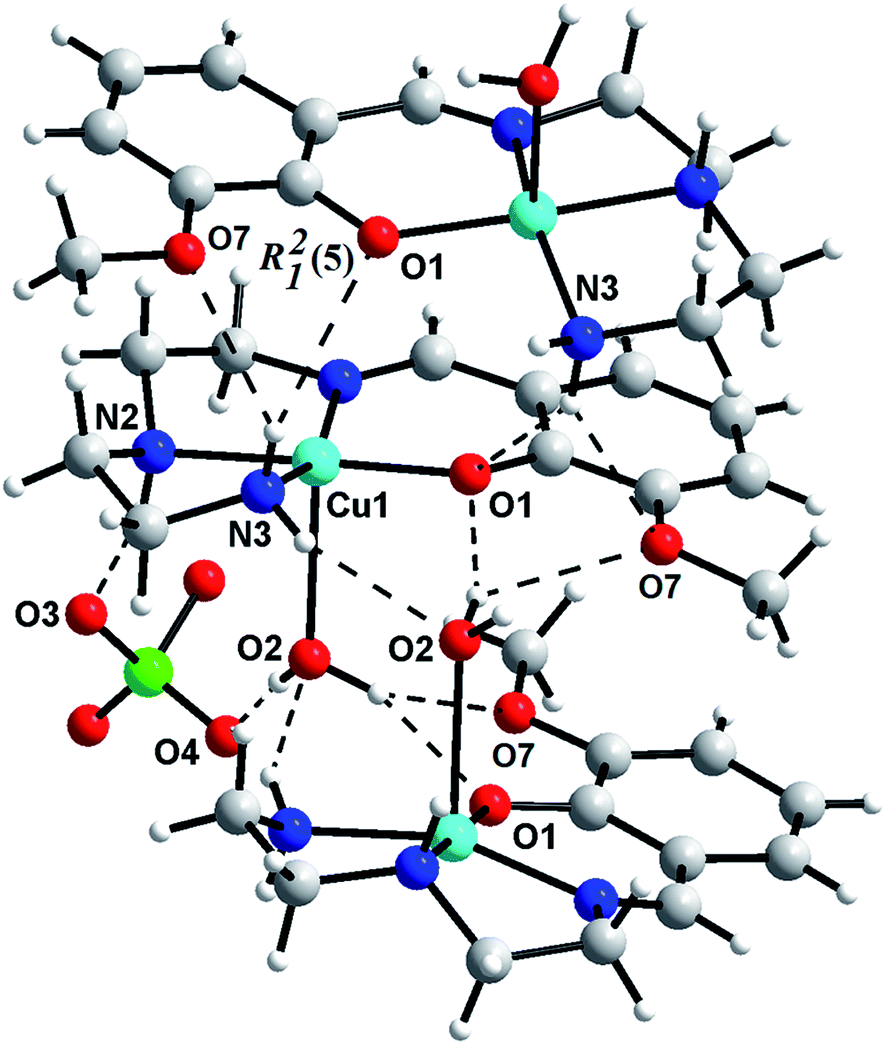
Hydrogen bonding interactions (Table 2S†) results the formation of supramolecular dimer for 1 (Fig. 3) and 3 (Fig. 5), and supramolecular trimer for 2 (Fig. 4). R22(8) H-bonding synthons28 [Fig. 3S–5S†] between phenolic oxygen (O1) and coordinated water helps the formation of supramolecular dimeric structure of all the complexes. Additional R12(5) supramolecular synthon [formed among methoxy oxygen (O7), phenoxy oxygen (O1) and amine (N3) hydrogen] in 2 produces supramolecular trimeric unit of 2 (Fig. 4). Finally, C–H⋯π interactions29 [Table 3S;† C(9)–H(9A)⋯Cg(4), 2.73 Å for 1; C(9)–H(9A)⋯Cg(4), 2.64 Å for 2; C(8)–H(8A)⋯Cg(4), 3.14 Å and C(10)–H(10A)⋯Cg(4), 2.76 Å for 3] favor the formation of 2D networks of 1 (Fig. 6S†) and 3 (Fig. 7S†), whereas 1D chain of 2 (Fig. 8S†).
 |
| | Fig. 3 Supramolecular dimeric assembly of 1. | |
 |
| | Fig. 4 Supramolecular trimeric assembly of 2. | |
 |
| | Fig. 5 Supramolecular dimeric assembly of 3. | |
We have calculated Puckering parameters30 for detail study of ring conformations of complexes. Conformations of ring 1 (Cu1,N1,C8,C9,N2) and ring 2 (Cu1,N2,C10,C11,N3) are given in the Table 3. Ring 1 is envelope (E4) in complex 1, whereas twisted/envelope in complex 2 (5T4/E4) and complex 3 (3T4/E4). On the other hand ring 2 possess twisted/envelope conformation in complex 1 (4T3/E3) and complex 2 (4T3/4E), but envelope (E3) in complex 3. In all complexes phase angle (φ2) values are positive for ring 1 and negative in ring 2 i.e. specular. Two structures with same cationic unit as in 1 were reported by Zhu et al.31a and Cusmano et al.31b Comparison of structural parameters (Table 4S†) of reported compounds with 1 reveals that coordination geometry of Cu in 1 is more close to ideal square pyramidal than reported compounds.
Table 3 Ring conformations: Puckering parameters for complexes 1–3
| Complex |
Ring 1 (Cu1,N1,C8,C9,N2) |
Ring 2 (Cu1,N2,C10,C11,N3) |
| q2/Å |
φ2/° |
Conformation |
q2/Å |
φ2/° |
Conformation |
| 1 |
0.415(3) |
106.8(3) |
Envelope: E4 |
0.431(3) |
−101.0(4) |
Twisted/envelope: 4T3/E3 |
| 2 |
0.406(4) |
120.0(6) |
Twisted/envelope: 5T4/E4 |
0.410(5) |
−79.0(5) |
Twisted/envelope: 4T3/4E |
| 3 |
0.403(5) |
101.6(5) |
Twisted/envelope: 3T4/E4 |
0.425(5) |
−105.4 |
Envelope: E3 |
Geometrical optimization and electronic structure
DFT and TD-DFT computations of optimized structures of ligands [HL1, HL2, HL3] and complexes 1–3 were performed to establish their electronic structure and spectral transitions. The geometric structures of the isolated ligands and complexes 1–3 (excluding perchlorate anion) were fully optimized at the Becke's three-parameter hybrid exchange functional and the Lee–Yang–Parr non-local correlation functional (B3LYP) level in the ground state (singlet for ligands and doublet for complexes 1–3). The optimized structures of ligands are shown in Fig. 9S.† The potential energy scan of the ligands in the singlet ground state shows that the keto-tautomeric forms (Chart 1S, ESI†) were more stable by an amount of energy of 5.02 and 0.628 kcal mol−1, for HL1 and HL2, respectively, than the corresponding enol form (Fig. 6 and 10S†). On the other hand for HL3, both keto and enol-tautomeric forms have comparable stability (Fig. 11S†).
 |
| | Fig. 6 Potential energy curve at the ground S0 state for HL1 calculated at the DFT/B3LYP level. | |
The optimized structures of complexes 1–3 along with their Mulliken charge distribution are depicted in Fig. 12S–14S.† The comparison of bond lengths and angles between calculated and X-ray structure shows an ample agreement (Tables 2 and 1S†). The orbital diagram along with their energies and contributions from the ligands and metal are given in Fig. 15S,† and a correlation of MOs are given in Fig. 16S and 17S.† For 1, the energies of highest occupied molecular orbital (HOMO) and lowest unoccupied molecular orbital (LUMO) are −5.97 eV and −1.96 eV, respectively. For 2, energies of HOMO and LUMO orbitals are −5.68 eV and −1.92 eV, respectively. Whereas for 3, the corresponding values are −5.90 eV and −1.85 eV, respectively. As a matter of fact, the HOMO–LUMO energy difference in 3 is larger (ΔE = 4.05 eV) compared to the values of 1 (ΔE = 4.01 eV) and 2 (ΔE = 3.76 eV), indicating a lower kinetic stability32 of 2 with respect to 1 and 3. Contribution of Schiff base, water and copper to HOMO [97% L1, 0% H2O, 3% Cu for 1; 98% L2, 0% H2O, 2% Cu for 2; 97% L3, 0% H2O, 3% Cu for 3] and LUMO [99% L1, 0% H2O, 1% Cu for 1; 99% L2, 0% H2O, 1% Cu for 2, 99% L1, 0% H2O, 1% Cu for 3] indicate that these orbitals are characterized by the ligand orbitals (≥97%).
TD-DFT calculations in methanol using conductor-like polarizable continuum model (CPCM) were performed and theoretically possible spin-allowed doublet–doublet electronic transitions with their assignment are listed in Tables 4 and 5S.† The TD-DFT results show that [HOMO−1 (β) → LUMO+2 (β); HOMO−1 (β) → LUMO+3 (β)], [HOMO−12 (β) → LUMO (β); HOMO−9 (β) → LUMO (β)] and HOMO−1 (α) → LUMO+6 (α) are the possible highest energy electronic transitions, for complexes 1, 2 and 3 respectively. On the other hand, HOMO−3 (β) → LUMO (β) and HOMO (β) → LUMO (β) electronic transitions represent possible lowest energy electronic transitions for all the complexes. The highest energy electronic transitions for 1 are ILCTθ (intra ligand charge transfer in L1) and LMCTδ (L1 to metal charge transfer) in nature, and the lowest energy electronic transitions are IMCT (intra metal charge transfer) and LMCTδ in nature. For 2, the highest energy transition is LMCTΓ (L2 to metal charge transfer) and the lowest energy transitions have IMCT and LMCTΓ character. Whereas for 3, the highest energy transition is LMCTΩ (L3 to metal charge transfer) and the lowest energy transitions are IMCT and LMCTΩ in nature.
Table 4 Selected UV-vis energy transition at the TD-DFT/B3LYP level for 1, 2 and 3 in methanol
| Complex |
Excited state |
λcal (nm), εcal (M−1 cm−1), (eV) |
Oscillator strength (f) |
λexp (nm), εexp (M−1 cm−1), (eV) |
Key transition |
Charactera |
| ILCTθ = intra ligand charge transfer transition in L1; ILCTψ = intra ligand charge transfer transition in L2; ILCTΦ = intra ligand charge transfer transition in L3; LMCTδ = L1 to metal charge transfer transition; LMCTΓ = L2 to metal charge transfer transition and LMCTΩ = L3 to metal charge transfer transition. |
| 1 |
D8 |
364.07, 4512, (3.40) |
0.0508 |
361, 7217, (3.43) |
HOMO−1 (α) → LUMO (α) (11%), HOMO (α) → LUMO (α) (36%), HOMO (β) → LUMO+1 (β) (36%) |
ILCTθ |
| ILCTθ |
| ILCTθ |
| D9 |
359.35, 4557, (3.45) |
0.0097 |
|
HOMO−1 (α) → LUMO (α) (81%) |
ILCTθ |
| D15 |
260.20, 27361, (4.76) |
0.2766 |
267, 22565, (4.64) |
HOMO−2 (α) → LUMO (α) (20%), HOMO−4 (β) → LUMO (β) (12%), HOMO−1 (β) → LUMO+1 (β) (17%) |
ILCTθ |
| LMCTδ |
| ILCTθ |
| D19 |
243.92, 18615, (5.08) |
0.0455 |
241.50, 29043, (5.13) |
HOMO (α) → LUMO+1 (α) (19%), HOMO−7 (β) → LUMO (β) (18%) |
ILCTθ |
| LMCTδ |
| D31 |
222.10, 7183, (5.58) |
0.0003 |
224, 27086, (5.53) |
HOMO−1 (α) → LUMO+1 (α) (10%), HOMO−1 (α) → LUMO+2 (α) (82%) |
ILCTθ |
| LMCTδ |
| D41 |
204.90, 18843, (6.05) |
0.0015 |
205, 13434, (6.04) |
HOMO (β) → LUMO+7 (β) (43%) |
LMCTδ |
| D42 |
204.46, 18661, (6.06) |
0.0017 |
|
HOMO−2 (β) → LUMO+2 (β) (50%), HOMO (β) → LUMO+7 (β) (13%) |
ILCTθ |
| LMCTδ |
| 2 |
D9 |
373.06, 3778, (3.32) |
0.0063 |
375, 4242, (3.30) |
HOMO−1 (β) → LUMO (β) (69%) |
LMCTΓ |
| D27 |
232.29, 21528, (5.33) |
0.1648 |
236.50, 27333, (5.24) |
HOMO (α) → LUMO+2 (α) (28%), HOMO (β) → LUMO+3 (β) (24%) |
ILCTψ |
| ILCTψ |
| D45 |
206.87, 11734, (5.99) |
0.0263 |
206, 19727, (6.01) |
HOMO−2 (α) → LUMO+1 (α) (17%), HOMO−1 (β) → LUMO+2 (β) (43%) |
LMCTΓ |
| LMCTΓ |
| 3 |
D9 |
353.62, 5498, (3.50) |
0.0247 |
355, 3125, (3.49) |
HOMO−1 (α) → LUMO (α) (70%) |
ILCTΦ |
| D27 |
230.04, 11542, (5.38) |
0.0047 |
224.50, 21812, (5.52) |
HOMO−1 (α) → LUMO+1 (α) (51%), HOMO−1 (α) → LUMO+2 (α) (14%) |
LMCTΩ |
| ILCTΦ |
| D42 |
206.36, 6460, (6.00) |
0.0189 |
204.50, 27625, (6.06) |
HOMO (α) → LUMO+6 (α) (46%), HOMO (β) → LUMO+7 (β) (26%) |
LMCTΩ |
| LMCTΩ |
| D44 |
202.09, 1491, (6.13) |
0.0018 |
|
HOMO−1 (α) → LUMO+4 (α) (46%) |
LMCTΩ |
In 1 the experimental electronic transitions (Fig. 7) at 241 nm may be assign to a combination of ILCTθ [HOMO (α) → LUMO+1 (α)] and LMCTδ [HOMO−7 (β) → LUMO (β)] transitions, and the transition at 361 nm is ILCTθ [HOMO−1 (α) → LUMO (α); HOMO (α) → LUMO (α); HOMO (β) → LUMO+1 (β)] in nature. The experimental transition of 2, at 206 nm (Fig. 18S†) assigned as LMCTΓ [HOMO−2 (α) → LUMO+1 (α); HOMO−1 (β) → LUMO+2 (β)] and for 3, transition at 355 nm (Fig. 19S†) may be attributed to ILCTϕ (intra ligand charge transfer in L3) [HOMO−1 (α) → LUMO (α)].
 |
| | Fig. 7 Theoretical (red line) and experimental (black line) electronic spectra (left) of 1. The most prominent MOs involving transitions (right) and their diagrams. | |
The geometric data of complexes 1–3 derived from X-ray experimental and theoretical calculations (Tables 2 and 1S†) show a good agreement. The trigonality τ parameter33 for five-coordinated complexes calculated as (α–β)/60, where α and β are the two largest coordination bond angles. For a regular trigonal bipyramidal structure with D3h symmetry has τ = 1 and for a regular C4v square pyramidal geometry τ = 0. The τ is calculated from experimental X-ray [0.133 for 1, 0.329 for 2, and 0.183 for 3] and theoretical data [0.191 for 1, 0.196 for 2, and 0.158 for 3]. These values indicate a different distortion in the square pyramidal (SPY-5) geometries and form these τ values it is clear that structure of 1 is more close to ideal square pyramidal geometry, whereas more deviation from ideal square pyramidal geometry observed in 2.
We also performed DFT and TD-DFT computations using B3PW91 (ref. 10b) and MPW1PW91 (ref. 10c) functionals, and compared the results with the results obtained using B3LYP functional. It is found that B3LYP functional produced structural (Table 1S†) and spectroscopic data (Tables 6S and 7S†) which are more close to experimental results than B3PW91 and MPW1PW91 functionals.
Ligand photophysical study
The spectrum of HL1 shows (Fig. 20S†) significant transitions at 215 nm (ε ∼ 28.85 × 10⁴ liter mol−1 cm−1), 255 nm (ε ∼ 13.57 × 10⁴ liter mol−1 cm−1), 279 nm (ε ∼ 4.5 × 10⁴ liter mol−1 cm−1), 316 nm (ε ∼ 4.1 × 10⁴ liter mol−1 cm−1) and 400 nm (ε ∼ 1.7 × 10⁴ liter mol−1 cm−1). HL2 shows (Fig. 21S†) significant transitions at 207 nm (ε ∼ 17.51 × 10⁴ liter mol−1 cm−1), 220 nm (ε ∼ 19.06 × 10⁴ liter mol−1 cm−1), 263 nm (ε ∼ 8.41 × 10⁴ liter mol−1 cm−1), 296 nm (ε ∼ 5.04 × 10⁴ liter mol−1 cm−1) and 422 nm (ε ∼ 1.90 × 10⁴ liter mol−1 cm−1). On the other hand HL3 shows (Fig. 22S†) transitions at 206 nm (ε ∼ 27.81 × 10⁴ liter mol−1 cm−1), 275 nm (ε ∼ 6.69 × 10⁴ liter mol−1 cm−1), 316 nm (ε ∼ 2.63 × 10⁴ liter mol−1 cm−1) and shows bands at 389 nm (ε ∼ 3.66 × 10⁴ liter mol−1 cm−1). Results of TD-DFT calculations and details of spectral assignments (Tables 8S–13S†) indicate that the electronic transitions are mainly n → π* and/or π → π* in nature.
Electronic absorption spectra of complexes
The electronic absorption spectrum of 1 (Fig. 7) shows significant transitions at 205 nm (ε ∼ 13.43 × 10⁴ liter mol−1 cm−1), 224 nm (ε ∼ 2.7 × 10⁴ liter mol−1 cm−1), 241 nm (ε ∼ 2.90 × 10⁴ liter mol−1 cm−1), 249 nm (ε ∼ 21.86 × 10⁴ liter mol−1 cm−1) 267 nm (ε ∼ 2.25 × 10⁴ liter mol−1 cm−1), and 361 nm (ε ∼ 7.21 × 10³ liter mol−1 cm−1). Transitions of 2 occur (Fig. 18S†) at 206 nm (ε ∼ 19.72 × 10³ liter mol−1 cm−1), 236 nm (ε ∼ 2.73 × 10⁴ liter mol−1 cm−1), 272 nm (ε ∼ 1.63 × 10⁴ liter mol−1 cm−1) and 375 nm (ε ∼ 4.24 × 10³ liter mol−1 cm−1). On the other hand the spectrum of 3 shows significant transitions (Fig. 19S†) at 204 nm (ε ∼ 2.76 × 10⁴ liter mol−1 cm−1), 224 nm (ε ∼ 2.18 × 10⁴ liter mol−1 cm−1), 266 nm (ε ∼ 1.13 × 10⁴ liter mol−1 cm−1) and 355 nm (ε ∼ 3.12 × 10³ liter mol−1 cm−1). Results of TD-DFT calculation along with details of spectral assignments (Tables 4, 5S and 6S†) reveal that experimental spectral bands are mainly due to intra ligand charge transfer (ILCT) i.e., π → π* or n → π* transitions. Spectral bands of 2 appear at higher wavelength in compare to bands of 1, this is due to the presence of electron donating –OMe group which reduces the energy gap among the electronic energy levels. On the other hand spectral bands of 3 appear at shorter wavelength compare to 1 and 2, this may cause for the presence of –CH3 group which inhibit the conjugation due to steric crowding and results higher energy transitions.
Fluorescent properties of the complexes
Results of the study of luminescence properties (Fig. 8) are summarized in Table 5. Complexes 1–3 exhibit red shifted emission with a large Stokes shift (40–112 nm). On excitation at 267 nm complex 1 exhibits luminescence bands at 312, 329 and 357 nm with a fluorescence quantum yield Φs = 0.52. For 2, λex, 272 nm; λem, 312, 329, 355 nm and Φs = 0.46. For 3, λex, 265 nm; λem, 312, 356, 377 nm and Φs = 0.33. The positions of emission bands remain unchanged when λex is varied between (λex − 10) and (λex + 10) nm.
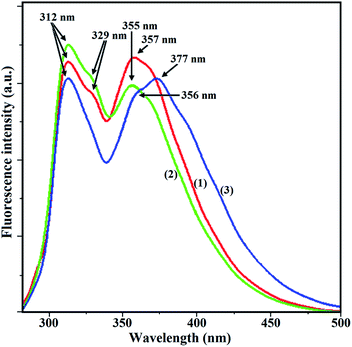 |
| | Fig. 8 Fluorescence spectra of complexes [for 1, red line, λex = 267 nm; for 2, green line, λex = 272 nm; for 3, blue line, λex = 265 nm; excitation and emission slit width = 2.5 nm]. | |
Table 5 Photophysical parameters of complexes 1, 2 and 3
| Complex |
λex (nm), εexp (M−1 cm−1), (eV) |
λem (nm) |
Δνa (nm) |
φ |
| Stoke shift. |
| 1 |
267, 22478, (4.64) |
312, 329, 357 |
45, 62, 90 |
0.52 |
| 2 |
272, 16455, (4.56) |
312, 329, 355 |
40, 57, 83 |
0.46 |
| 3 |
266, 11312, (4.67) |
312, 356, 377 |
47, 91, 112 |
0.33 |
Catechol oxidase studies of complexes
Catalytic oxidation of 3,5-di-tert-butylcatechol (3,5-DTBC) to 3,5-di-tert-butylquinone (3,5-DTBQ) was carried out based on the following reaction,34 where complexes 1–3 were used as catalyst.
Catecholase activities of 1–3 were tested by adding their 1 × 10⁻⁴ M methanolic solution to a 1 × 10⁻² M solution of 3,5-DTBC at 30 °C under aerobic condition and the progress of the reaction were studied based on the UV-vis spectra of the mixture at five minute interval for up to 90 min. A band at 400 nm corresponding to 3,5-DTBQ was gradually increased (Fig. 9, 23S and 24S†) after addition of complex to the solution of 3,5-DTBC.35 Kinetics of the oxidation of 3,5-DTBC were determined by examining the growth of the 3,5-DTBQ band at 400 nm as function of time (t).34 From the  versus time (t) plot (Fig. 10) (where A∞ and At are the absorbance at infinite time and at t time, respectively, corresponding to the band at 400 nm), the rate constants for complex–substrate mixtures were determined and the calculated values were 1.33 × 10⁻² min−1, 1.78 × 10⁻² min−1 and 1.42 × 10⁻² min−1 for 1, 2 and 3, respectively. Different rate of catalytic activities of 1–3 may be explained by considering their geometries. The compound having more distorted square pyramidal (SPY-5) geometry shows higher rate of catalytic activity. Trigonality τ parameters (vide supra) indicate the order of deviation from regular geometries as 2 > 3 > 1, which corroborate the order of rate of catalytic reactions.
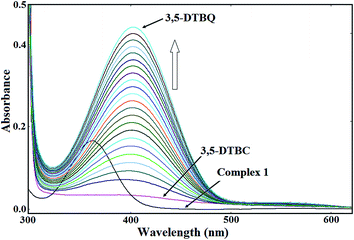 |
| | Fig. 9 Increase in the 3,5-di-tert-butylquinone (3,5-DTBQ) band at 400 nm after addition of 10−4 M methanolic solution of complex 1 to 100 fold methanolic solution of 3,5-DTBC. The spectra were recorded at an interval of 5 min. | |
 |
| | Fig. 10 Change in absorption maxima at 400 nm with time after addition of 10−4 M methanolic solution of complex to 100 fold methanolic solution of 3,5-DTBC. Circle (1), square (2) and triangle (3). | |
We have added the solution of complexes to the various concentration of 3,5-DTBC (from 1 × 10⁻³ M to 10 × 10−3 M) under aerobic condition to realize the dependence of the reaction rate on substrate concentration. But we did not observe saturation kinetics even at higher concentration of 3,5-DTBC (Fig. 25S†). ESI MS spectral studies of solution containing complexes and 3,5-DTBC were performed to establish the possible mechanism. Unfortunately we were unable to characterize the intermediates. However, when a mixture of starch–potassium iodide solution was added to a mixture of complex and 3,5-DTBC, blue coloration developed, which indicates that hydrogen peroxide was produced during the course of reaction. It is interesting to note that no blue coloration was observed in absence of 3,5-DTBC. Possible mechanistic path of the formation of H2O2 as by-product during the oxidation of 3,5-DTBC to 3,5-DTBQ catalyzed by copper(II) compound was suggested by Chyn and Urbach.36 Considering the formation of hydrogen peroxide during the reaction we have proposed a probable mechanism (Scheme 1S, ESI†), where catalytic reaction started with the formation of intermediate I, where two copper complexes are bridged by 3,5-DTBC. Copper complexes then gain one electron each from 3,5-DTBC and from intermediate II, where two reduced copper compounds are bridged with 3,5-DTBQ. Molecular oxygen then oxidizes complexes and form peroxide (O22−) bridged intermediate III. In presence of proton, H2O2 and 3,5-DTBQ are liberated and complexes are regenerated.
Cytotoxicity assay
The antiproliferative activity of the complexes was tested by standard MTT assay using MCF7 cells. All the complexes show dose dependent suppression of cell viability (Fig. 11)†.37 The half maximal inhibitory concentration (IC50) values of complexes are 30 ± 2.7 μM, 68 ± 6.6 μM, and >100 μM for complexes 1, 2 and 3, respectively. Results reveal that complex 1 has more potent cytotoxic effect on breast cancer cell line MCF7 as compared to complexes 2 and 3. More cytotoxic effect of 1 probably due to its smaller size, which favors its incorporation to the active site of the cancer cell and destroys the cancer cells easily. On the other hand the presence of nonpolar group in the R2 position suppresses the anti-proliferative effect of compound 3. Anticancer activities of 1–3 have been compared (Fig. 11) with the anticancer activity of cisplatin on breast cancer cell line MCF7 and result shows that complexes 1–3 are less efficient than cisplatin (Table 6).
 |
| | Fig. 11 Dose dependent suppression of cell viability of human breast cancer cell line MCF7 by cisplatin and complexes 1–3. | |
Table 6 Anticancer activity of complexes 1–3 and cisplatin against breast cancer cell line MCF7
| Compound |
1 |
2 |
3 |
Cisplatin |
| IC50 (μM) |
31.07 ± 6.67 |
42.63 ± 7.13 |
>100 |
6.83 ± 1.40 |
Conclusion
We have presented here the synthesis, characterization and photophysical studies of three N,N,N,O donor tetradentate ligands. The geometry optimization of the ligands shows that two ligands are stable in their ketotautomeric form whereas other ligand has comparable stability in keto and enol tautomeric forms in the ground state. Three square pyramidal Cu(II) complexes have been synthesized using these ligands and in the solid state all the complexes are stabilized by weak interactions. The DFT computations of the isolated complexes are in good agreement with the structural results obtained by X-ray diffraction. Results of TD-DFT calculations have been discussed in term of theoretically possible spin allowed doublet–doublet electronic transitions along with their assignments. The influence of different functionals used in geometry optimization and excite state TD-DFT calculations of complexes reveals that among the B3LYP, B3PW91 and MPW1PW91 functionals, B3LYP was able to best reproduce the experimental results. Complexes 1–3 are active in catalyzing the aerobic oxidation of 3,5-DTBC to 3,5-DTBQ and catalytic activity increases with increasing distortion in geometries of complexes. Cytotoxic activity of the complexes towards human breast (MCF7) cancer cell lines follow the order of 1 > 2 > 3, and cytotoxic effect of 1–3 are relatively low compare to cytotoxic effect of cisplatin.
Acknowledgements
The authors gratefully acknowledge the financial assistance given by the CSIR, Government of India, to Dr Subal Chandra Manna (Project No. 01 (2743)/13/EMR-II). M. K. S thankful to DBT, Govt. of India, for Ramalingaswami fellowship.
References
- M. G. Gichinga and S. Striegler, J. Am. Chem. Soc., 2008, 130, 5150 CrossRef CAS PubMed.
- M. Barwiolek, E. Szlyk, A. Berg, A. Wojtczak, T. Muziol and J. Jezierska, Dalton Trans., 2014, 9924 RSC.
- K. Dhara, U. C. Saha, A. Dan, S. Sarkar, M. Manassero and P. Chattopadhyay, Chem. Commun., 2010, 46, 1754 RSC.
- P. Kumar, S. Gorai, M. K. Santra, B. Mondal and D. Manna, Dalton Trans., 2012, 7573 RSC.
-
(a) B. Duff, V. R. Thangella, B. S. Creaven, M. Walsh and D. A. Egan, Eur. J. Pharmacol., 2012, 689, 45 CrossRef CAS PubMed;
(b) A. T. Chaviara, P. C. Christidis, A. Papageorgiou, E. Chrysogelou, D. J. Hadjipavlou-Litina and C. A. Bolos, J. Inorg. Biochem., 2005, 99, 2102 CrossRef CAS PubMed.
- K. S. Banu, T. Chattopadhyay, A. Banerjee, S. Bhattacharya, E. Suresh, M. Nethaji, E. Zangrando and D. Das, Inorg. Chem., 2008, 47, 7083 CrossRef CAS PubMed.
- M. S. Ray, S. Chattopadhyay, M. G. B. Drew, A. Figuerola, J. Ribas, C. Diaz and A. Ghosh, Eur. J. Inorg. Chem., 2005, 4562 CAS.
-
(a) B. Sarkar, S. Konar, C. J. G. mez-García and A. Ghosh, Inorg. Chem., 2008, 47, 11611 CrossRef CAS PubMed;
(b) B. Sarkar, M. S. Ray, Y.-Z. Li, Y. Song, A. Figuerola, E. Ruiz, J. Cirera, J. Cano and A. Ghosh, Chem.–Eur. J., 2007, 13, 9297 CrossRef CAS PubMed.
-
(a) Recent Advances in Density Functional Methods, Part I, ed. M. K. Casida and D. P. Chong, World Scientific, Singapore, 1995 Search PubMed;
(b) R. E. Stratmann, G. E. Scuseria and M. J. Frisch, J. Chem. Phys., 1998, 109, 8218 CrossRef CAS PubMed.
-
(a) C. Lee, W. Yang and R. G. Parr, Phys. Rev. B: Condens. Matter Mater. Phys., 1988, 37, 785 CrossRef CAS;
(b) H. Ihee, J. Kua, W. A. Goddard III and A. H. Zewail, J. Phys. Chem. A, 2001, 105, 3623 CrossRef CAS;
(c) J. P. Safko, J. E. Kuperstock, S. M. McCullough, A. M. Noviello, X. Li, J. P. Killarney, C. Murphy, H. H. Patterson, C. A. Bayse and R. D. Pike, Dalton Trans., 2012, 11663 RSC.
-
(a) S. Mistri, S. García-Granda, E. Zangrando and S. C. Manna, Polyhedron, 2013, 50, 333 CrossRef CAS PubMed;
(b) S. Mistri, E. Zangrando and S. C. Manna, Inorg. Chim. Acta, 2013, 405, 331 CrossRef CAS PubMed.
- D. D. Perrin, W. L. F. Armarego and D. R. Perrin, Purification of Laboratory Chemicals, Pergamon Press, Oxford, U.K., 1980 Search PubMed.
- J. R. Lakowicz, Principles of Fluorescence Spectroscopy, Springer, New York, USA, 3rd edn, 2006 Search PubMed.
- Z. Otwinowski and W. Minor, Methods in Enzymology, Part A, ed. C. W. Carter and R. M. Sweet, Academic Press, London, 1997, vol. 276, p. 307 Search PubMed.
- R. H. Blessing, Acta Crystallogr., Sect. A: Found. Crystallogr., 1995, 51, 33 CrossRef.
- A. Altomare, M. C. Burla, M. Camalli, G. L. Cascarano, C. Giacovazzo, A. Guagliardi, A. G. Moliterni, G. Polidori and R. Spagna, J. Appl. Crystallogr., 1999, 32, 115 CrossRef CAS.
- G. M. Sheldrick, SHELX-97, Program for Crystal Structure Refinement, University of Gottingen, Germany, 1997 Search PubMed.
- M. Nardelli, J. Appl. Crystallogr., 1995, 28, 659 CrossRef CAS.
- L. J. Farrugia, J. Appl. Crystallogr., 1999, 32, 837 CrossRef CAS.
- K. Brandenburg, DIAMOND (version 3.2i), Crystal Impact GbR, Bonn, Germany, 1999 Search PubMed.
- Gaussian 09, revision A.02, Gaussian, Inc., Wallingford, CT, 2009 Search PubMed.
- P. J. Hay and W. R. Wadt, J. Chem. Phys., 1985, 82, 270 CrossRef CAS PubMed.
-
(a) A. Douhal, F. Lahmani and A. Zewail, Chem. Phys., 1996, 207, 477 CrossRef CAS;
(b) J. Catalan and J. L. P. de Paz, J. Phys. Chem. A, 2001, 105, 7315 CrossRef CAS.
-
(a) R. E. Stratmann, G. E. Scuseria and M. J. Frisch, J. Chem. Phys., 1998, 109, 8218 CrossRef CAS PubMed;
(b) M. E. Casida, C. Jamorski, K. C. Casida and D. R. Salahub, J. Chem. Phys., 1998, 108, 4439 CrossRef CAS PubMed.
- M. Cossi, N. Rega, G. Scalmani and V. Barone, J. Comput. Chem., 2003, 24, 669 CrossRef CAS PubMed.
- N. M. O'Boyle, A. L. Tenderholt and K. M. Langner, J. Comput. Chem., 2008, 29, 839 CrossRef PubMed.
- M. N. Burnett and C. K. Johnson, ORTEP III, Report ORNL-6895, Oak Ridge National Laboratory, Oak Ridge, TN, 1996 Search PubMed.
- M. C. Etter and J. C. MacDonald Bernstein, Acta Crystallogr., Sect. B: Struct. Sci., 1990, 46, 256 CrossRef.
- M. Nishio, M. Hirota and Y. Umezawa, The C–H⋯π Interaction: Evidence, Nature and Consequences, Wiley-VCH, New York, 1998 Search PubMed.
- D. Cremer and J. A. Pople, J. Am. Chem. Soc., 1975, 97, 1354 CrossRef CAS.
-
(a) H.-L. Zhu, S.-Y. Li, Z.-D. Wang and F. Yang, J. Chem. Crystallogr., 2004, 34, 203 CrossRef CAS;
(b) F. Cusmano Priolo, E. Rotondo, G. Rizzardi, G. Bruno and G. Bombieri, Acta Crystallogr., Sect. C: Cryst. Struct. Commun., 1983, 39, 550 CrossRef.
- J. Aihara, J. Phys. Chem. A, 1999, 103, 7487 CrossRef CAS.
- A. W. Addison, T. N. Rao, J. Reedijk, J. V. Rijn and G. C. Verschoor, J. Chem. Soc., Dalton Trans., 1984, 1349 RSC.
-
(a) P. Seth, L. K. Das, M. G. B. Drew and A. Ghosh, Eur. J. Inorg. Chem., 2012, 2232 CrossRef CAS PubMed;
(b) P. Kar, R. Haldar, C. J. Gómez-García and A. Ghosh, Inorg. Chem., 2012, 51, 4265 CrossRef CAS PubMed.
-
(a) F. Zippel, F. Ahlers, R. Werner, W. Haase, H.-F. Nolting and B. Krebs, Inorg. Chem., 1996, 35, 3409 CrossRef CAS PubMed;
(b) A. Biswas, L. K. Das, M. G. B. Drew, C. Diaz and A. Ghosh, Inorg. Chem., 2012, 51, 10111 CrossRef CAS PubMed.
- J.-P. Chyn and F. L. Urbach, Inorg. Chim. Acta, 1991, 189, 157 CrossRef CAS.
- L. Tavares, S. Johann, T. Alves, J. Guerra, E. Souza-Fagundes, P. Cisalpino, A. J. Bortoluzzi, G. F. Caramori, R. Piccoli, H. T. S. Braibante, M. E. F. Braibante and M. G. Pizzolatti, Eur. J. Med. Chem., 2011, 46, 4448 CrossRef CAS PubMed.
Footnote |
| † Electronic supplementary information (ESI) available: X-ray crystallographic data in CIF format, details of synthesis of ligands, IR spectra, figures of electronic spectra and results of DFT/TDDFT calculation of HL1, HL2, HL3 and complexes 1–3 are provided as ESI. CCDC 1060158–1060160. For ESI and crystallographic data in CIF or other electronic format see DOI: 10.1039/c5ra12324k |
|
| This journal is © The Royal Society of Chemistry 2015 |
Click here to see how this site uses Cookies. View our privacy policy here. 


 versus time (t) plot (Fig. 10) (where A∞ and At are the absorbance at infinite time and at t time, respectively, corresponding to the band at 400 nm), the rate constants for complex–substrate mixtures were determined and the calculated values were 1.33 × 10⁻² min−1, 1.78 × 10⁻² min−1 and 1.42 × 10⁻² min−1 for 1, 2 and 3, respectively. Different rate of catalytic activities of 1–3 may be explained by considering their geometries. The compound having more distorted square pyramidal (SPY-5) geometry shows higher rate of catalytic activity. Trigonality τ parameters (vide supra) indicate the order of deviation from regular geometries as 2 > 3 > 1, which corroborate the order of rate of catalytic reactions.

