Triphenylamine-decorated BODIPY fluorescent probe for trace detection of picric acid

Ma Hengchang*, Zhang Zhongwei, Jin Yuanyuan, Zha Lajia, Qi Chunxuan, Cao Haiying, Yang Zengming, Yang Zhiwang and Lei Ziqiang*
College of Chemistry and Chemical Engineering, Northwest Normal University, Lanzhou, Gansu, China. E-mail: leizq@nwnu.edu.cn

Received 24th June 2015 , Accepted 30th September 2015

First published on 30th September 2015


Abstract

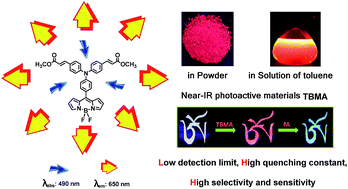
Triphenylamine-decorated BODIPY derivative TBMA was designed and synthesized. Luminogen aggregation was developed by taking advantage of twisted intramolecular charge transfer (TICT) and aggregation-induced emission (AIE) processes. In non-polar solvents, the locally excited (LE) states of BODIPY luminogens emitted intense yellow light. Increasing solvent polarity brought the luminogens from an LE to a TICT state, causing a large bathochromic shift in the emission color and a dramatic decrease in emission efficiency. The red emission was greatly boosted by aggregate formation or AIE effect. We also discovered that TBMA could be applied as an efficient chemical sensor for picric acid (PA) detection. The detection limit and quenching constant (KSV) were determined as 30 ppb and 2.1 × 10⁻⁶ M−1 respectively. 19F NMR and 1H NMR titration analysis verified that F⋯H hydrogen bonding is demonstrated as the mode of interaction, which possibly facilitates effective exciton migration.

Introduction

4,4-Difluoro-4-bora-3a,4a-diaza-s-indacene1,2 or borondipyrromethene (BODIPY) derivatives are a group of luminogenic molecules that usually emit in the long wavelength region (λem up to near-IR) in high fluorescence quantum yields (ΦF up to unity).3–6 Extensive studies have documented that the emission behaviors of BODIPY luminogens are sensitive to the intramolecular rotations and the interactions of their chromophoric segments.7 However, it is painstaking work to synthesize BODIPY derivatives with desirable fluorescent properties from chemical decoration.8 Multiple synthetic steps and moderate or low isolated yields mean that these materials cannot be used for real applications. It would be really useful if the intramolecular rotations could be restricted by simple physical processes, if possible, rather than by multi-step chemical modifications. Tang’s group has explored the notable aggregation-induced emission (AIE) and aggregation-induced enhancement emission (AIEE).9,10 As the terms imply, some luminogenic molecules, for instance in particular triphenylamine (TPA) and tetraphenylethene (TPE), with great freedom of intramolecular rotation are non-emissive when dissolved in good solvents but become highly luminescent when aggregated in poor solvents due to the physical restriction of intramolecular rotation in the aggregates.11–14 In our previous work, we have been interested in exploring efficient fluorescent materials with intriguing AIE characteristics, and several luminescent molecules have been efficiently prepared and utilized as chemical sensors and smart soft matter.15,16

Picric acid (PA) is a potential explosive due to its high energy release power.17 In addition, PA is highly water soluble, and is estimated as a major contaminant of groundwater. PA has also been widely used in the dye industry, rocket fuel manufacturing, and the pharmaceutical industry. Thus, for social and environmental safety, effective monitoring and detection of trace amounts of PA is really important.18

The signal amplification effect, which was discovered for detection of trace amounts of explosives in the solution phase by conjugated polymers,19–22 has been applied as the traditional monitoring technology. However, a delayed effect is inevitable because polymers, owing to their very high molecular weight, have less good solubility in common organic solvents, leading to reduction of their sensitivity and specificity.23 In recent years, supramolecular polymers employed as chemical sensors turned out to be a potential alternative in this regard. Because low-weight molecules can easily be fabricated and diversely modified, such design is greatly beneficial to successful exciton migration. Although there are numerous reports on luminescent supramolecular chemosensors for PA detection,24–26 most detection systems are either less selective or exhibit low-to-moderate Stern–Volmer constants. Furthermore, ppb level detection in organic solvents is a crucial but very difficult task. Herein, we report the synthesis and characterization of a TPA decorated BODIPY derivative of TBMA (Scheme 1), which was proven to be a potential candidate for picric acid sensing with high sensitivity and selectivity.


image file: c5ra12154j-s1.tif
Scheme 1 Synthetic procedures for TBMA (V) and TB (VI), and the photographs of III, TB, TBMA in powder form under room light (top) and UV light illumination at 365 nm (bottom).

Results and discussion

Design and synthesis of target molecules

To enhance the fluorescence response capability of the probes, especially in the visible light region, the target molecule V (abbreviated as TBMA) was designed and synthesized (Scheme 1). There was a triphenylamine (TPA) core with two tentacle-like methyl acrylate functional groups from (III), which was synthesized from intermediate II by Heck reaction in 85% yield. Importantly, the two tentacles are able to endow the TPA core with stronger fluorescent emission due to the formation of a conjugated electron donor–accept system. It is also well known that TPA derivatives typically display AIE properties, and that methyl acrylate groups could provide stronger intermolecular forces as has been reported.17 Thanks to the better aggregation ability of the intermediate III, it could emit the desirable green-yellow light under UV light (Scheme 1). Dyes bearing building blocks of BF2 complexes of dipyrrin ligands (BODIPYs) have diverse applications as biolabels, artificial light harvesters, sensitizers for solar cells,27–34 fluorescent sensors,35,36 molecular photonic wires, and laser dyes.37,38 This popularity of BODIPY dyes is presumably because of their advantageous spectroscopic properties such as high molar absorption coefficients, narrow band shapes with tunable wavelengths, excitation/emission wavelengths above 500 nm, large Stokes shifts (SS), high fluorescence quantum yields, and significantly high photostability.39 Therefore, the rigid BODIPY segment was introduced into the TPA core according to Lindsey’s procedure by condensing compound III with excess pyrrole in the presence of a catalytic amount of trifluoroacetic acid at room temperature.40 Afterwards, the dehydration was carried out in dichloromethane with DDQ for 30 min, followed by treatment with triethylamine and BF3·OEt2 at room temperature for 10 min.41 Thin-layer chromatographic analysis showed a fluorescent red spot of the desired compound. The crude TBMA was subjected to flash silica gel column chromatographic purification and afforded the stable product V as a dark-red solid in 26% yield. Meanwhile, compound VI (abbreviated as TB) was synthesized from intermediate I following the above mentioned method. 1H, 13C, MS and IR spectroscopies have been used to characterize compounds III, TB and TBMA in detail.

Photophysical properties

Solvent effect. TBMA shows a wavelength band that changes only slightly with the variation in solvent (Fig. 1a). Due to the π–π* transition of the BODIPY unit, a sharp absorption peak (λabs) appears around at 500–520 nm. It is documented that BODIPY derivatives with a phenyl ring at the 8 position are much less luminescent (ΦF = 19%, EtOH), which is due to the rotational movement of the phenyl ring around the single bond non-radiatively deactivating its excited state to a large extent.42–45 That is to say, the less the rotatable junctions, the higher the emission efficiency. Accordingly, we propose that the bulk of the substituent at the 8 position exerts a steric effect on the rotational motion of the phenyl ring; such an effect originates from the propeller-shaped TPA core and the methyl acrylate groups with a strong aggregation ability. Thus, the resulting BODIPY derivative TBMA became more emissive in some cases (as shown in Fig. 1b). The emission study of TBMA in different solvents indicated that the luminescent properties are greatly affected by solvent polarity. The emission band is red-shifted and its intensity is reduced with an increase in the solvent polarity (Fig. S1 and Table S1). For instance, fluorescence was almost quenched in the polar solvent of MeOH. However, TBMA showed strong emission and dramatic blue-shift in less polar solvents like toluene (ΦF = 52%).46–48
image file: c5ra12154j-f1.tif
Fig. 1 (a) Normalized absorption spectra of TBMA in different solvents. Solution concentration: 10 μM. (b) Photographs of TBMA in different solvents taken under UV illumination at 365 nm.
TICT process. To have a deep insight into the twisted intramolecular charge transfer (TICT) phenomenon, we serially changed the solvent ratio by mixing polar THF and non-polar hexane together. Afterwards, we measured the emission properties of TBMA. As can be seen from Fig. 2, when the hexane fraction (fh) in the THF/hexane mixture was increased from 0 to 90%, the emission color was changed from red to yellow. Meanwhile, the emission gradually intensified and narrowed into a sharper band. According to the previous statements, in the locally excited (LE) state TBMA may take a more planar conformation. In a non-polar solvent, the excited luminogen is in equilibrium with solvent molecules and its planar conformation is stabilized by better electronic conjugation giving a sharp emission band. In contrast, in a polar solvent, intramolecular rotation brings the luminogen from the LE state to a TICT state, and in the new equilibrium state, the twisted molecular conformation is stabilized by the polar solvent. Each luminogen molecule has a different twisting angle and hence emission characteristic, the collection of which thus gives rise to a broad emission band.49 This result could also be verified by the temperature-dependent emission properties in the polar solvent THF, because the emission of a TICT luminogen is sensitive to temperature variations.7 From Fig. S2, we can see that the emission spectrum gradually becomes a broader band, and the intensity is reduced obviously when the temperature is decreased from 65 to 0 °C. 1H NMR measurements demonstrated very different chemical shifts of TBMA in polar and non-polar deuterium solvents (Fig. 3). It can be seen that in non-polar toluene-d8, the overlapping peaks in the range 6.7–7.1 ppm verify the existence of the hydrogen atoms in the C[double bond, length as m-dash]C double bonds. However, in the solvent CDCl3, all of them shift downfield and separate clearly into two clusters of peaks. With increasing the polarity of solvent (for instance in CD3CN) the two clusters of peaks separate further, shifting up and downfield. Such results clearly confirm that in the non-polar solvent toluene-d8, better electronic conjugation gives the TPA core almost uniform electron density, thus the nearly equal chemical environments mean that all the hydrogen atoms in the C[double bond, length as m-dash]C double bonds have only slight differences in their NMR signals. Further, we can see that TBMA preferentially aggregates rather than remaining mono-disperse in the non-polar solvent toluene, because all the peaks can be seen to shift up-field. However, in polar solvents, a D–A electron system forms and a drastically different chemical environment generates two clusters of NMR signals, which split further with increasing solvent polarity. As we discussed above, TBMA is more likely to take a more twisted conformation in polar solvents, therefore, a better electronic conjugation is hard to form, which brings about a great difference in the NMR signals. These findings agree well with the previous research reports.7
image file: c5ra12154j-f2.tif
Fig. 2 (a) Emission spectra of TBMA in THF/hexane mixtures. (b) Plots of maximum emission intensity (Imax) and wavelength (λem) of TBMA versus hexane fraction (fh) in the THF/hexane mixture. Solution concentration: 10 μM. Excitation wavelength: 490 nm.

image file: c5ra12154j-f3.tif
Fig. 3 1H NMR spectrum (400 MHz, room temperature) of a solution of TBMA in CD3CN, CDCl3, toluene-d8.
AIE phenomenon. It is also well known that TPA derivatives typically display AIE properties.50–52 Afterwards, we investigated this physical property in THF/water mixtures according to the documented method. Since TBMA is insoluble in water, it must aggregate in the aqueous mixtures with high water fractions (fw). And as shown in Fig. 4, the absorption intensity was weakened as the water fraction increases, and when the water fraction was up to 80% in volume, this absorption peak gradually generated two shoulders bathochromically and hypsochromically. Those shoulders, designated as H- and J-bands, correspond to the different intermolecular packing modes H- and J-aggregation.53,54 From the emission spectrum (Fig. 6a), we can see that TBMA is almost non-emissive in pure THF. However, TBMA could emit an intensified red color when in a mixture containing 80% water. To really understand the AIE properties and the soft interaction between TBMAs, we carried out 1H NMR titration studies in a mixture of CD3CN/D2O (4[thin space (1/6-em)]:[thin space (1/6-em)]1, v/v) and CD3CN respectively (Fig. 5). Evidently, all the proton resonance signals shifted up-field with different values, which verified the formation of aggregates with increasing fraction of D2O. The changes in chemical shift of the proton resonances of (Ha and Hb) in the double bond displayed the largest Δ value (Δ = 0.04 ppm), and the other identifiable peak of “Hc” demonstrated a smaller Δ value (Δ = 0.02 ppm); such results indicate that detectable interactions may take place between the interlaced tentacles like the methyl acrylate functional group. More than that, the obvious H–H NOESY correlations of TBMA could be detected as shown in Fig. 6b; such correlations originate from an attractive interaction between the superimposed phenyl and carbonyl groups of the methyl ester. Therefore, it could be confirmed that in the mixture of CH3CN/H2O = 1[thin space (1/6-em)]:[thin space (1/6-em)]4, well-organized aggregates are formed in H- and J-packing modes by C[double bond, length as m-dash]O⋯π interactions, which results in AIE. All the mixed solutions were macroscopically homogeneous and transparent with visible Tyndall effect, suggesting that the aggregates are nanosized. The formation of nanoaggregates was supported by SEM images showing that when fw = 20%, uniform nano-spheres were scattered on the silicon wafer, whereas fibres as long as several micrometers enlaced each other in the case of fw = 80% (Fig. 6c). Accordingly, reversible macro-gels could be easily formed. In comparison, if TBMA doesn’t possess two tentacles such as methyl acrylate groups (for instance compound TB), no fibres, let alone gel formation, could be seen (Fig. S6). The details of gelation ability can be seen in the ESI.
image file: c5ra12154j-f4.tif
Fig. 4 (a) Normalized absorption spectra of TBMA in THF/water mixtures. Solution concentration: 10 μM. (b) Normalized absorption spectra of TBMA (10 μM) in fw = 0 and 80%.

image file: c5ra12154j-f5.tif
Fig. 5 1H NMR spectrum (400 MHz, room temperature) of a solution of TBMA in CD3CN, and CD3CN/D2O (v/v = 4[thin space (1/6-em)]:[thin space (1/6-em)]1).

image file: c5ra12154j-f6.tif
Fig. 6 (a) Emission spectra of TBMA in the THF/water mixtures. Solution concentration: 10 μM. Excitation wavelength: 500 nm. (b) The NOESY NMR spectrum (400 MHz, room temperature) of a solution of TBMA in CDCl3. (c) SEM image of TBMA in different water fractions (fw).

In order to verify the interactions between TBMA and solvent, we prepared the TBMA gel in CH3CN & CH3CH2OH, then cast it on a quartz plate. The real-time FT-IR spectra were recorded during solvent vaporization, which clearly displayed that two identical absorption bands around 1710 cm−1 are narrowed into one sharp peak after less than 30 min, which was recognized as a C[double bond, length as m-dash]O absorption peak. This transformation confirmed hydrogen bond formation between the C[double bond, length as m-dash]O of TBMA and CH3CH2OH. Additionally, in contrast with powdered TBMA, the xerogel of TBMA demonstrated sharper resonance peaks in the IR spectrum (Fig. S7). This difference possibly implies that in the xerogel state (Fig. S8), TBMAs are better-organized than in the powdered state, and therefore, more uniform aggregation modes bring about the narrowly distributed resonance energy of C[double bond, length as m-dash]O.

We performed density functional theory (DFT) calculations to gain a better understanding of the geometric and electronic structure and optical properties of the molecules presented in this study. Thus, quantum chemical optimization on their energy levels based on DFT/B3LYP/6-31G(d,p) using Gaussian 09 was conducted. Fig. 7 displays the highest occupied molecular orbital (HOMO) and lowest unoccupied molecular orbital (LUMO) diagrams of TBMA and TB. According to Fig. 7, both HOMOs of these compounds were basically distributed over the TPA cores, and the LUMOs of TBMA and TB extended across the BODIPY frames, which indicated that these derivatives have an obvious tendency to ICT.55 This result was also consistent with the observed stronger solvent dependence of the fluorescence behaviours of TBMA and TB. Compared with TB, TBMA has a lower HOMO energy (−5.58 eV), which is due to the existence of the electron-withdrawing methyl acrylate groups, and a lower LUMO energy (−2.85 eV), because the less distorted structure is favorable for decreasing the LUMO energy.


image file: c5ra12154j-f7.tif
Fig. 7 The optimized molecular orbital amplitude plots of HOMO and LUMO energy levels of TBMA (left), TB (right).

Detection of nitroaromatic explosives in solution

Quenching studies. In the sensing behaviors of PA toward TBMA, the fluorescence titration for the sensor with PA revealed that fluorescence emission intensity rapidly dies down upon addition of increasing amounts of PA solution (Fig. 8 and S9); the quenching efficiency was found to be 95%. SEM images (Fig. 8b) clearly demonstrated that the long fibres are disrupted into disorganized sticks in the presence of PA. These results demonstrated the interactions of TBMA with PA possibly occurs.
image file: c5ra12154j-f8.tif
Fig. 8 (a) Fluorescence spectrum of TBMA on addition of PA (0–500 eq.) in toluene. Insets show the quenching of fluorescence of TBMA after addition of PA. Solution concentration: 10 μM. Excitation wavelength: 500 nm. All images are taken under 365 nm UV lamp. (b) SEM images of TBMA (A) and TBMA & PA (B).

To check the portable application of the sensor in more convenient manner, we prepared some easily available filter paper as the substrate material. For better visualization (Fig. 9), the filter paper was cut into the shape of a Tibetan language word, then was moistened by TBMA solution (10−4 M in toluene). After evaporating the solvents, the test paper is immersed into the solution of PA (10−4 M in toluene). It can be seen that the luminescence decayed once the test paper was dipped into the solution of PA. These results clearly displayed the practical applicability of TBMA for the instant visualization of traces of PA.


image file: c5ra12154j-f9.tif
Fig. 9 Paper strips of compound TBMA (10−4 M) for PA (10−4 M) detection.
Quenching mechanism. We explored the interaction models of TBMA with PA, investigating by 19F NMR spectroscopic analysis carried out in CDCl3 (Fig. 10). In several recently reported BODIPY compounds the fluorines were found to be inequivalent and showed two sets of multiplets at −140 ppm.41,56 However, in the mixture of TBMA with PA, we observed only one quartet in the 19F NMR, indicating that the fluorines are in a chemically equivalent environment. Notably, in the presence of PA, the 19F NMR signal of TBMA exhibits an obvious downfield shift. This unusual downfield shift was probably due to the presence of hydrogen bonding between the fluoride ions and PA. Such an observation was also consistent with the reported dipyrromethene dyes.57 Meanwhile, TBMA possibly disfavored the formation of aggregates in the presence of PA due to the huge steric hindrance after producing complex VII. Thus, the AIE process was suppressed, leading to the disappearance of the emission color. Additionally, the significant emissive performances represent two different “states”, where the fluorescence is “switched on” (state I) without PA and “switched off” (state II) with PA, as shown in Scheme 2. In the presence of PA, the intermolecular photoinduced electron transfer (PET) could be potentially enhanced after capturing the more acidic molecules of PA, because the BODIPY core turns into a more electron-deficient center. Alternatively, PA or picrate (P) ions promotes the PET quenching of the TPA excited state effectively. Furthermore, the intermolecular bonding models were verified by 1H NMR titration analysis. From Fig. 11, we can see that the signals of the hydrogen atom in the –OH group of PA shifted up-field and became gradually broader with increasing the concentration of TBMA sensor. Comparably, all the rest of the peaks displayed negligible changes in their chemical shifts. Therefore, these results confirmed the formation of complex VII by definite interacting patterns of F⋯H hydrogen bonding. Furthermore, this conclusion also suggested to us that dipyrromethene dyes possibly could be applied as specific chemical sensors for phenol derivatives. In particular, the more acidic the analytes, the more sensitive the BODIPY sensors.
image file: c5ra12154j-f10.tif
Fig. 10 19F NMR spectra of TBMA and the mixture of TBMA with PA in selected regions recorded in CDCl3.

image file: c5ra12154j-s2.tif
Scheme 2 Schematic representation of the fluorescence quenching.

image file: c5ra12154j-f11.tif
Fig. 11 1H NMR spectra of TBMA and PA with different mol ratio in CDCl3 (B is A partial enlarged images).
Finding the detection limit and selective detection of nitroaromatics. We next investigated the fluorescence response of several other electron-deficient nitro compounds. Obviously, except PA, all the other compounds showed insignificant quenching of the emission intensity, and the quenching efficiency was less than 30% (Fig. 12). According to the above results, the BODIPY analogue of TBMA was proved as an effective and selective sensor for the detection of PA in solution. To determine the detection limit, fluorescence titration of TBMA in toluene with picric acid was carried out by adding picric acid solution and the fluorescence intensity as a function of picric acid added is then plotted. From this graph the concentration at which there is a sharp change in the fluorescence intensity multiplied by the concentration of TBMA gave the detection limit.58 Equation used for calculating detection limit (DL): DL = CL × CT, CL = conc. of TBMA (1 × 10⁻⁶ M L−1); the datum of CT (0.03 equiv.) from Fig. S10. Thus, detection limit for picric acid DL = 1 × 10⁻⁶ M L−1 × 0.03 equiv. = 3 × 10⁻⁸ M L−1. The quenching results could be quantitatively treated with the Stern–Volmer equation, I0/I = 1 + KSV[PA],26,59–61 where I0 and I stand for the fluorescence intensity of TBMA in the absence and presence of PA, respectively, [PA] is concentration of PA, and KSV is the Stern–Volmer constant. The decrease in the fluorescence intensity could be an electron transfer process on the basis of thermodynamic considerations as static and dynamic quenching. The Stern–Volmer plots shown two distinct regions: linear variation at a lower concentration of PA was mainly due to static quenching, whereas a steep curve at higher concentration of PA was presumably due to dynamic quenching. It can be seen that the Stern–Volmer plot of the change in intensity of TBMA with respect to PA concentration is linear at lower concentrations of PA and gives a quenching constant (KSV) of 2.1 × 10⁻⁶ M−1, suggesting the quenching of the fluorescence of TBMA ensemble upon the addition of PA is due to the static quenching through a one-to-one non-fluorescent ground state complex, which after excitation returns to the ground state without emission of light (Fig. 13). Overall, the quenching constant and detection limit of TBMA toward PA were noticeably higher than those reported in previous reports.26
image file: c5ra12154j-f12.tif
Fig. 12 Variation of fluorescence intensity (I0/I) of TBMA toward different analytes in toluene.

image file: c5ra12154j-f13.tif
Fig. 13 (a) Stern–Volmer plots for TBMA (10 μM) using PA in toluene as quencher. (b) Stern–Volmer plots at lower concentration region of PA in toluene.

Experimental

Materials

Triphenylamine (TPA, 99%) is purchased from Energy Chemical Company. Pyrrole (>99%) is purchased from Energy Chemical Company. Trifluoroacetic acid (TFA, 99%) is purchased from Aladdin Reagent Company. Phosphorus oxychloride (POCl3) is purchased from Shandong Bazhou quartz clock Reagent Company. 2,3-Dichloro-5,6-dicyano-1,4-benzoquinone (DDQ, 98%) is purchased from Energy Chemical Company. Methyl acrylate (95%) is purchased from Shuang-shuang Company. Palladium acetate (Pd(OAc)2, 99%), 1,3-bis(diphenylphosphino)propane (DPPP, 97%), tert-butyl acrylate (99%), and methyl methacrylate (99%) are bought from Aladdin Reagent Company. Triethylamine (Et3N, 99%) is purchased from Kaixinchem Company. Quinine sulfate dehydrate is purchased from Shanghai ZhongQin Company. Rhodamine B is purchased from Tianjin Tianxin Fine Chemical Industry Development Center. Nitrogen with a purity of 99.99% is provided from commercial source. Other reagents, such as N,N-dimethylformamide (DMF), toluene, benzene, dichloromethane (DCM), methanol, ethanol, tetrahydrofuran (THF), ethyl acetate, diethyl ether, chloroform, 1,4-dioxane, tetrachloromethane, and acetic acid are A.R. grade.

Characterizations

1H NMR (400 MHz), 13C NMR (100 MHz), and H–H NOESY (400 MHz) spectra are recorded on a MERCURY spectrometer at 25 °C, and all NMR spectra are referenced to the solvent. Mass spectra are recorded on a HP5989B mass spectrometer. UV-visible absorption spectra are recorded on a TU-1901 spectrometer from 190 to 1100 nm. Fluorescence spectra are measured using a PE LS-55 Luminescence/Fluorescence spectrophotometer. Emission spectra are recorded on a Perkin-Elmer LS 55 spectrofluorimeter at room temperature (∼25 °C) as well as other specific temperatures (0 to 65 °C). Fourier transform infrared (FT-IR) spectra are recorded on a DIGIL FTS3000 spectrophotometer using KBr tablets. The morphology of compounds is observed by scanning electron microscopy (SEM, ZEISS ULTRA PLUS). All the samples are prepared according to the standard methods. The ground-state geometries are fully optimized by using the density functional theory (DFT) at the B3LYP/6-31G(d,p) level, as implemented in Gaussian 09.

Synthesis

Synthesis of I. Phosphorus oxychloride (15 mL) is added dropwise at 0 °C to DMF (15 mL), and the reaction mixture is stirred for 1 h. TPA (5 g) is added and stirring is continued for 6 hours at 50 °C. The reaction mixture is poured into 100 mL water slowly, whereupon a yellow solid precipitates out. The solid is filtered, and washed with water. Purification by column chromatography on silica gel (ethyl acetate/petroleum ether, 1[thin space (1/6-em)]:[thin space (1/6-em)]45) followed by recrystallization (CH2Cl2/hexane) gives II (4 g, 80%) as a yellow solid.62,63 Mp 128–130 °C; 1H NMR (400 MHz, CDCl3) δ 9.81 (s, 1H), 7.68 (d, J = 8 Hz, 2H), 7.34 (t, J = 8 Hz, 4H), 7.16–7.19 (m, 6H), 7.02 (d, J = 8 Hz, 2H). 13C NMR (100 MHz, CDCl3): δ 190.31, 153.31, 146.13, 131.24, 129.68, 129.12, 126.27, 125.06, 119.33 ppm. MS (FAB): m/z = 273.12 [M + H]+. IR (KBr): 3098, 2827, 2740, 1689, 1585, 1504, 1488, 1427, 1330, 1259, 825, 757, 696 cm−1.
Synthesis of II. Into a 100 mL, two-necked, round-bottomed flask equipped with a condenser are placed 546 mg of I (2 mmol), 996 mg of potassium iodide (KI, 6 mmol), 1.284 g of potassium iodate (KIO3, 6 mmol), and 10 mL of acetic acid. The mixture is heated to 70 °C under stirring for 10 h. The mixture is cooled to room temperature, filtered, and washed consecutively with water and ammonia water to adjust the pH of the solution to be 8. The solution is extracted with CH2Cl2, The collected organic layer is washed with saturated sodium hydrogen sulfite and brine, and dried over anhydrous Na2SO4.64,65 After filtration and solvent evaporation, the crude product is recrystallized from ethanol to obtain the target II (461.1 mg, 85%) as a yellow solid. Mp 138–140 °C; 1H NMR (400 MHz, CDCl3) δ 9.84 (s, 1H), 7.71 (d, J = 8.0 Hz, 2H), 7.63 (d, J = 8.0 Hz, 4H), 7.05 (d, J = 8.0 Hz, 2H), 6.89 (d, J = 8.0 Hz, 4H) ppm. 13C NMR (100 MHz, CDCl3) δ 190.29, 152.17, 145.71, 138.85, 131.32, 130.35, 127.59, 120.76 ppm. MS (FAB): m/z = 524.91 [M + H]+. IR (KBr): 3441, 2805, 2733, 1689, 1598, 1574, 1327, 1315, 1270, 1217, 959, 819, 719 cm−1.
Synthesis of III. 4-(Bis(4-iodophenyl)amino)benzaldehyde (II) (2.63 g, 5 mmol), methyl acrylate (12 mmol), Pd(OAc)2 (18 mg, 0.08 mmol), 1,3-bis(diphenylphosphino)propane (DPPP, 66 mg, 0.16 mmol) and Et3N (1.2 g, 12 mmol) are added into 10 mL of dry dimethylformamide (DMF). After stirring for 48 h at 80 °C under N2 atmosphere, when the reaction is complete as determined by the disappearance of II, 20 mL of water is added, and the solution is extracted with CH2Cl2 (3 × 10 mL). The organic phases are then dried with anhydrous magnesium sulfate, filtered, and concentrated under reduced pressure.66 Purification by column chromatography on silica gel (ethyl acetate/petroleum ether, 1[thin space (1/6-em)]:[thin space (1/6-em)]10) followed by recrystallization (CH2Cl2/hexane) gives III (1.78 mg, 68%) as a yellow solid. Mp 133–135 °C; 1H NMR (400 MHz, CDCl3) δ 9.88 (s, 1H), 7.76 (d, J = 8.0 Hz, 2H), 7.66 (d, J = 16.0 Hz, 2H), 7.48 (d, J = 8.0 Hz, 4H), 7.15 (t, J = 8.0 Hz, 6H), 6.38 (d, J = 16.0 Hz, 2H), 3.81 (s, 6H) ppm. 13C NMR (100 MHz, CDCl3): δ 190.34, 167.35, 151.99, 147.70, 143.62, 131.30, 131.09, 130.85, 129.53, 125.37, 122.28, 117.24 ppm. MS (FAB): m/z = 441.1 6 [M + H]+. IR (KBr): 3445, 2947, 2720, 1717, 1630, 1594, 1504, 1433, 1321, 1267, 1203, 1167, 1038, 980, 825 cm−1.
Synthesis of TBMA. Pyrrole (5 mL, 72 mmol) and III (1.27 g, 2.88 mmol) are added to a dry 100 mL round-bottomed flask and degassed with a stream of N2 for 5 min. TFA (22.2 μL, 0.5 mmol) is then added, and the solution is stirred under N2 at room temperature. TLC analysis indicates the disappearance of spots corresponding to III and appearance of a new spot corresponding to compound IV. The solvent is removed on a rotary evaporator under vacuum, and the crude compound is subjected to flash silica gel column chromatography with a mixture of ethyl acetate and petroleum ether as eluent (1[thin space (1/6-em)]:[thin space (1/6-em)]6 by volume). The resultant compound IV (557 mg, 1 mmol) is dissolved in freshly distilled dichloromethane and oxidized with DDQ (272.4 mg, 1.2 mmol) for 30 min at room temperature. The reaction mixture is then treated with a small amount of Et3N (5.6 mL, 40 mmol) followed by BF3·OEt2 (6.3 mL, 50 mmol), and the mixture is stirred for an additional 30 min at room temperature.67 The solvent is removed in a rotary evaporator, and the resultant crude compound is purified by silica gel column chromatography with petroleum ether/ethyl acetate (3[thin space (1/6-em)]:[thin space (1/6-em)]1) and affords pure TBMA (144.8 mg, 26%) as a purple solid. Mp 205–207 °C; 1H NMR (400 MHz, CDCl3): δ 8.00 (s, 2H), 7.63 (d, J = 16.0 Hz, 2H), 7.41 (d, J = 8.2 Hz, 4H), 7.17 (d, J = 8.2 Hz, 2H), 7.06 (d, J = 6.7 Hz, 6H), 6.74 (s, 2H), 6.32 (d, J = 15.9 Hz, 2H), 6.18 (s, 2H), 5.94 (s, 2H), 5.46 (s, 1H), 3.80 (s, 6H) ppm. 13C NMR (100 MHz, CDCl3): δ 167.63, 148.83, 145.01, 144.09, 138.64, 132.29, 129.60, 129.44, 128.91, 125.80, 123.39, 117.36, 115.93, 108.49, 107.27, 51.58, 43.52 ppm. MS ESI m/z: 603.22 [M + H]+. IR (KBr): 3419, 3232, 2944, 1710, 1630, 1591, 1507, 1453, 1412, 1387, 1324, 1263, 1182, 1117, 1076, 1046, 982, 911, 829, 777, 746, 715 cm−1.
Synthesis of TB. Compound TB is synthesized in a manner similar to that for TBMA. Yield: 299.5 mg (77%); pure solid. Mp 212–214 °C; 1H NMR (400 MHz, CDCl3) δ 7.90 (s, 2H), 7.40 (m, 6H), 7.23–7.06 (m, 10H), 6.55 (s, 2H) ppm. 13C NMR (100 MHz, CDCl3): δ 150.94, 147.52, 146.47, 142.77, 134.63, 132.25, 131.00, 129.67, 126.22, 125.94, 124.70, 120.02, 117.95 ppm. MS (FAB): m/z = 435.17 [M + H]+. IR (KBr): 3105, 3059, 3036, 1587, 1558, 1533, 1488, 1412, 1388, 1332, 1294, 1261, 1224, 1192, 1118, 1076, 980, 911, 757, 742, 696 cm−1.

Conclusions

In conclusion, a TPA decorated BODIPY derivative of TBMA was designed and synthesized. Two tentacle-like methyl acrylate functional groups on the modified TPA core exerted huge steric hindrance on the 8-position of the BODIPY centre, therefore, TBMA exhibited emission wavelengths above 650 nm. Additionally, due to the soft interactions between the interlaced methyl acrylate groups, TBMA displayed notable AIE behavior in a mixture of THF and H2O. We also discovered that TBMA could be applied as an efficient chemical sensor for PA detection. The detection limit and quenching constant (KSV) are determined as 30 ppb and 2.1 × 10⁻⁶ M−1 respectively. 19F NMR and 1H NMR titration analysis verified that F⋯H hydrogen bonding is observed as the mode of interaction, which possibly facilitates the effective exciton migration.

Acknowledgements

The authors are grateful for financial support from the National Natural Science Foundation of China (No. 21202133, 21174114, 21361023). The authors also thank the Key Laboratory of Eco-Environment-Related Polymer Materials (Northwest Normal University), and the Ministry of Education Scholars Innovation Team (IRT 1177) for financial support.

References

  1. A. Treibs and F.-H. Kreuzer, Liebigs Ann. Chem., 1968, 718, 208–223 CrossRef CAS PubMed.
  2. G. Ulrich, R. Ziessel and A. Harriman, Angew. Chem., Int. Ed., 2008, 47, 1184–1201 CrossRef CAS PubMed.
  3. W. W. Qin and M. Baruah, J. Phys. Chem. A, 2005, 109, 7371–7384 CrossRef CAS PubMed.
  4. M. K. Kuimova, G. Yahioglu, J. A. Levitt and K. Suhling, J. Am. Chem. Soc., 2008, 130, 6672–6673 CrossRef CAS PubMed.
  5. P. C. Eduardo, A. A. Angélica, G. D. Martha, L. Erik, Z. V. Rubi, G. V. Jazmin and V. G. Fabián, Org. Lett., 2007, 9, 3985–3988 CrossRef PubMed.
  6. M. Sameiro and T. Gonçalves, Chem. Rev., 2009, 109, 190–212 CrossRef PubMed.
  7. R. Hu, E. Lager and A. A. Angélica, J. Phys. Chem. C, 2009, 113, 15845–15853 CAS.
  8. E. Fron, E. Coutiño-Gonzalez, L. Pandey, M. Sliwa, M. V. Auweraer, F. C. de Schryver, J. Thomas, Z. Dong, V. Leen, M. Smet, W. Dehaen and T. Vosch, New J. Chem., 2009, 33, 1490–1496 RSC.
  9. Y. Hong, J. W. Y. Lam and B. Z. Tang, Chem. Soc. Rev., 2011, 40, 5361–5388 RSC.
  10. J. Luo, J. W. Y. Lam, L. Cheng, H. Chen, C. Qiu, H. S. Kwok, X. Zhan, Y. Liu, D. Zhu and B. Z. Tang, Chem. Commun., 2001, 18, 1740–1741 RSC.
  11. J. Chen, C. C. W. Law, J. W. Y. Lam, Y. P. Dong, S. M. F. Lo, I. D. Williams, D. Zhu and B. Z. Tang, Chem. Mater., 2003, 15, 1535–1546 CrossRef CAS.
  12. Y. Hong, J. W. Y. Lam and B. Z. Tang, Chem. Commun., 2009, 29, 4332–4353 RSC.
  13. J. Liu, J. W. Y. Lam and B. Z. Tang, J. Inorg. Organomet. Polym. Mater., 2009, 19, 249–285 CrossRef CAS.
  14. L. Qian, J. Zhi, B. Tong, F. Yang, W. Zhao and Y. P. Dong, Progr. Chem., 2008, 20, 673–678 CAS.
  15. Y. Ma, H. Ma, Z. Yang, J. Ma, Y. Su, W. Li and Z. Lei, Langmuir, 2015, 31, 4916–4923 CrossRef CAS PubMed.
  16. H. Ma, Y. Ma, W. Li, F. Wang, F. Zhu, C. Qi, Z. Zhang, X. Yao and Z. Lei, Macromol. Chem. Phys., 2014, 215, 2305–2310 CrossRef CAS PubMed.
  17. G. V. Perez and A. L. Perez, J. Chem. Educ., 2000, 77, 910–915 CrossRef CAS.
  18. M. Nipper, Y. Qian, R. S. Carr and K. Mkiller, Chemosphere, 2004, 56, 519–530 CrossRef CAS PubMed.
  19. S. J. Toal and W. C. Trogler, J. Mater. Chem., 2006, 16, 2871–2883 RSC.
  20. H. Sohn, R. M. Calhoun, M. J. Sailor and W. C. Trogler, Angew. Chem., Int. Ed., 2001, 40, 2104–2105 CrossRef CAS.
  21. S. W. Thomas III, G. D. Joly and T. M. Swager, Chem. Rev., 2007, 107, 1339–1386 CrossRef PubMed.
  22. K. K. Kartha, S. S. Babu, S. Srinivasan and A. Ajayghosh, J. Am. Chem. Soc., 2012, 134, 4834–4841 CrossRef CAS PubMed.
  23. B. Roy, A. K. Bar, B. Gole and P. S. Mukherjee, J. Org. Chem., 2013, 78, 1306–1310 CrossRef CAS PubMed.
  24. V. Sathish, A. Ramdass, Z. Z. Lu, M. Velayudham, P. Thanasekaran, K. L. Lu and S. Rajagopal, J. Phys. Chem. B, 2013, 117, 14358–14366 CrossRef CAS PubMed.
  25. P. Thanasekaran, C. C. Lee and K. L. Lu, Acc. Chem. Res., 2012, 45, 1403–1418 CrossRef CAS PubMed.
  26. W. Li, H. Ma and Z. Lei, RSC Adv., 2014, 4, 39351–39358 RSC.
  27. M. Benstead, G. H. Mehl and R. W. Boyle, Tetrahedron, 2011, 67, 3573–3601 CrossRef CAS PubMed.
  28. S. Hattori, K. Ohkubo, Y. Urano, H. Sunahara, T. Nagano, Y. Wada, N. V. Tkachenko, H. Lemmetyinen and S. Fukuzumi, J. Phys. Chem. B, 2005, 109, 15368–15375 CrossRef CAS PubMed.
  29. S. Erten-Ela, M. D. Yilmaz, B. Icli, Y. Dede, S. Icli and E. U. Akkaya, Org. Lett., 2008, 10, 3299–3302 CrossRef CAS PubMed.
  30. D. Kumaresan, R. P. Thummel, T. Bura, G. Ulrich and R. Ziessel, Chem.–Eur. J., 2009, 15, 6335–6339 CrossRef CAS PubMed.
  31. C. Y. Lee and J. T. Hupp, Langmuir, 2010, 26, 3760–3765 CrossRef CAS PubMed.
  32. S. Kolemen, O. Bozdemir, A. Y. Cakmak, G. Barin, S. Erten-Ela, M. Marszalek, J.-H. Yum, S. M. Zakeeruddin, M. K. Nazeeruddin and M. Gratzel, Chem. Sci., 2011, 2, 949–954 RSC.
  33. J. Warnan, F. Buchet, Y. Pellegrin, E. Blart and F. Odobel, Org. Lett., 2011, 13, 3944–3947 CrossRef CAS PubMed.
  34. O. A. Bozdemir, S. Erbas-Cakmak, O. O. Ekiz, A. Dana and E. U. Akkaya, Angew. Chem., Int. Ed., 2011, 50, 10907–10912 CrossRef PubMed.
  35. N. Boens, V. Leen and W. Dehaen, Chem. Soc. Rev., 2012, 41, 1130–1172 RSC.
  36. N. Boens, W. Qin, M. Baruah, W. M. de Borggraeve, A. Filarowski, N. Smisdom, M. Ameloot, L. Crovetto, E. M. Talavera and J. M. Alvarez-Pez, Chem.–Eur. J., 2011, 17, 10924–10934 CrossRef CAS PubMed.
  37. M. J. Ortiz, I. García-Moreno, A. R. Agarrabeitia, G. Dura-Sampedro, A. Costela, R. Sastre, F. LopezArbeloa, J. BanuelosPrieto and I. LopezArbeloa, Phys. Chem. Chem. Phys., 2010, 12, 7804–7811 RSC.
  38. M. Benstead, G. H. Mehl and R. W. Boyle, Tetrahedron, 2011, 67, 3573–3601 CrossRef CAS PubMed.
  39. R. Ziessel, G. Ulrich and A. Harriman, New J. Chem., 2007, 31, 496–501 RSC.
  40. R. W. Wagner and J. S. Lindsey, Pure Appl. Chem., 1996, 68, 1373–1380 CrossRef CAS.
  41. S. Madhu, M. R. Rao and M. S. Shaikh, Inorg. Chem., 2011, 50, 4392–4400 CrossRef CAS PubMed.
  42. Z. R. Grabowski, K. Rotkiewics and W. Rettig, Chem. Rev., 2003, 103, 3899–4032 CrossRef PubMed.
  43. E. Lippert, W. Rettig, V. Bonacic-Koutecky, F. Hei-sel and J. A. Miehe, Adv. Chem. Phys., John Wiley & Sons, New York, 1987, vol. 68, pp. 1–174 Search PubMed.
  44. J. S. Yang, K. L. Liau, C. Y. Li and M. Y. Chen, J. Am. Chem. Soc., 2007, 129, 13183–13192 CrossRef CAS PubMed.
  45. S. Cogan, S. Zilberg and Y. Haas, J. Am. Chem. Soc., 2006, 128, 3335–3345 CrossRef CAS PubMed.
  46. J. N. Demas and G. A. Grosby, J. Phys. Chem., 1971, 75, 991–1024 CrossRef.
  47. W. R. Ware and W. Rothman, Chem. Phys. Lett., 1976, 39, 449–453 CrossRef CAS.
  48. C. A. Parker and W. T. Rees, Analyst, 1960, 85, 587–600 RSC.
  49. E. Lager, J. Liu and A. A. Angélica, J. Org. Chem., 2009, 74, 2053–2058 CrossRef CAS PubMed.
  50. Y. N. Hong, J. W. Y. Lam and B. Z. Tang, Chem. Soc. Rev., 2011, 40, 5361–5388 RSC.
  51. W. Z. Yuan, Y. Q. Tan, Y. Y. Gong, P. Lu, J. W. Y. Lam, X. Y. Shen, C. F. Feng, H. H. Y. Sung, Y. W. Lu, I. D. Williams, J. Z. Sun, Y. M. Zhang and B. Z. Tang, Adv. Mater., 2013, 25, 2837–2843 CrossRef CAS PubMed.
  52. Z. K. Wang, S. J. Chen, J. W. Y. Lam, W. Qin, R. T. K. Kwok, N. Xie, Q. L. Hu and B. Z. Tang, J. Am. Chem. Soc., 2013, 135, 8238–8245 CrossRef CAS PubMed.
  53. M. Vybornyi, A. V. Rudnev, S. M. Langenegger, T. Wandlowski, G. Calzaferri and R. Haner, Angew. Chem., Int. Ed., 2013, 52, 11488–11493 CrossRef CAS PubMed.
  54. Y. Liu, S. Chen, J. W. Y. Lam, P. Lu, R. T. K. Kwok, F. Mahtab, H. S. Kwok and B. Z. Tang, Chem. Mater., 2011, 23, 2536–2544 CrossRef CAS.
  55. Z. Zhao, C. Deng, S. Chen, J. W. Y. Lam, W. Qin, P. Lu, Z. Wang, H. S. Kwok, Y. Ma, H. Qiu and B. Z. Tang, Chem. Commun., 2011, 47, 8847–8849 RSC.
  56. A. C. Benniston, G. Copley, K. J. Elliott, R. W. Harrington and W. Clegg, Eur. J. Org. Chem., 2008, 2705–2713 CrossRef CAS PubMed.
  57. V. Lakshmi and M. Ravikanth, J. Org. Chem., 2011, 76, 8466–8471 CrossRef CAS PubMed.
  58. D. A. Olley, E. J. Wren, G. Vamvounis, M. J. Fernee, X. Wang, P. L. Burn, P. Meredith and P. E. Shaw, Chem. Mater., 2011, 23, 789–794 CrossRef CAS.
  59. E. Ballesteros, D. Moreno, T. Gomez, T. Rodriguez, J. Rojo, M. G. Valverde and T. Torroba, Org. Lett., 2009, 11, 1269–1272 CrossRef CAS PubMed.
  60. P. Lasitha and E. Prasad, RSC Adv., 2015, 5, 41420–41427 RSC.
  61. J. Xiong, J. Li, G. Mo, J. Huo, J. Liu, X. Chen and Z. Wang, J. Org. Chem., 2014, 79, 11619–11630 CrossRef CAS PubMed.
  62. T. Mallegol, S. Gmouh, M. A. A. Meziane, M. Blanchard-Desce and O. Mongin, Synthesis, 2005, 1771–1774 CAS.
  63. Y. Wang and M. Leung, Macromolecules, 2011, 44, 8771–8779 CrossRef CAS.
  64. L. Porrès, O. Mongin, C. Katan and M. Charlot, Org. Lett., 2004, 6, 47–50 CrossRef PubMed.
  65. W. Z. Yuan, Y. Gong, S. Chen, X. Y. Shen, J. W. Y. Lam, P. Lu, Y. Lu, Z. Wang, R. Hu, N. Xie and B. Z. Tang, Chem. Mater., 2012, 24, 1518–1528 CrossRef CAS.
  66. T. J. Kwok and J. A. Virgilio, Org. Process Res. Dev., 2005, 9, 694–696 CrossRef CAS.
  67. P. Thamyongkit, A. D. Bhise, M. Taniguchi and J. S. Lindsey, J. Org. Chem., 2006, 71, 903–910 CrossRef CAS PubMed.

Footnote

Electronic supplementary information (ESI) available. See DOI: 10.1039/c5ra12154j

This journal is © The Royal Society of Chemistry 2015
Click here to see how this site uses Cookies. View our privacy policy here.