 Open Access Article
Creative Commons Attribution 3.0 Unported Licence
Crystal phase transformation of α into β phase poly(vinylidene fluoride) via particle formation caused by rapid expansion of supercritical solutions
S.
Wolff
a,
F.
Jirasek
b,
S.
Beuermann
c and
M.
Türk
*a
aInstitute for Technical Thermodynamics and Refrigeration, Karlsruhe Institute of Technology (KIT), Engler-Bunte-Ring 21, D-76131 Karlsruhe, Germany. E-mail: tuerk@kit.edu
bLaboratory of Engineering Thermodynamics, University of Kaiserslautern, Erwin-Schrödinger-Str. 44, D-67663 Kaiserslautern, Germany
cInstitute of Technical Chemistry, Clausthal University of Technology, Arnold-Sommerfeld-Straße 4, D-38678 Clausthal-Zellerfeld, Germany
First published on 30th July 2015
Abstract
This contribution reports on the impact of the rapid expansion of supercritical solutions (RESS) on poly(vinylidene fluoride) (PVDF) properties in terms of particle size, molar mass distribution, crystal phase and finally piezoelectric behavior. Based on the usage of α phase PVDF powders, submicron particles were obtained involving crystal phase conversion to the β form. Moreover, state of the art piezoresponse force microscopy analysis verifies the formation of piezoelectric PVDF particles via RESS.
Introduction
The excellent resistance to chemical, thermal, ultraviolet, weathering and radiation environments has led to the wide-ranging applications of semicrystalline hydrofluorocarbon poly(vinylidene fluoride) (PVDF).1 Popular items are e.g. coatings, piping equipment, or membranes.1,2 PVDF is recognized with at least 5 polymorphs (α, β, γ, δ, and ε phase) and exhibits unique piezo-, pyro-, as well as ferroelectric properties, particularly in its β phase.3–8 Since each crystal phase is associated with varying characteristic features, several studies concentrate either on targeted synthesis or conversion of PVDF crystal phases.3,9–17 For example, the crystal phase transformation of α into β phase can be achieved by means of drawing, annealing or poling at different temperature and pressure conditions. PVDF applications exploiting piezoelectric properties in special devices like sensors, capacitors or actuators are highly interesting. The potential for future applications is remarkable.18 So far, the electrical properties of PVDF have mainly been investigated in polymer films.19–24PVDF is commonly produced by emulsion polymerization, which is associated with large quantities of waste water, the need for fluorinated stabilizers and substantial amounts of energy for polymer drying.25,26 Therefore, alternate polymerization strategies are considered. In recent years, the synthesis of polymers in supercritical carbon dioxide (scCO2) has gained attention due to many advantages of the solvent: CO2 is considered to be environmentally benign, is further a non-flammable, chemically inert, inexpensive and non-toxic solvent, which allows processing at moderate conditions (TC = 304.13 K, pC = 7.38 MPa) in addition to unproblematic solvent separation.27–29 The homogeneous phase polymerization of fluorinated monomers in scCO2 was reported in 1992 and was followed by the synthesis of PVDF.30–34 In addition to polymerization under supercritical conditions, even the production of semiconducting polymer particles has been reported in scCO2.35
The rapid expansion of supercritical solutions (RESS) is usually applied to the micronization of pharmaceuticals, such as carbamazepine.36 It is also known that carbamazepine crystal phase conversion is enabled by using scCO2.36,37 In the RESS process, the solute of interest is dissolved in a supercritical fluid and the supercritical solution is rapidly expanded through a nozzle down to ambient conditions. This brings appreciable supersaturation, produces fast nucleation and uniform crystal growth and hence small particles with a narrow size distribution. Until today a large number of publications report about the production of submicron drug particles using supercritical fluids, but only a few studies reported about the application of RESS on polymers.38–40 For example, PVDF processing in scCO2 aiming for the modification of certain polymer properties is not investigated in detail, yet. Recently, we reported that PVDF may be micronized via RESS.40 The emphasis was on the influence of polymer properties such as molar mass, polymer end groups and degree of crystallinity on the obtained particle size. The particle size was shown to decrease either by increasing molar mass, in case of identical polymer end groups, or by increasing the degree of crystallinity, in case of similar molar mass and different end groups.40
In this contribution we describe the impact of RESS on PVDF properties for a model polymer with a number average molar mass of Mn = 2000 g mol−1. The end groups are ClC6F12 and I originating from the chain transfer agent used in polymer synthesis. RESS is introduced as a promising method to generate piezoelectric polymer particles by crystal phase transformation from α into β phase PVDF.
Experimental
Controlled radical polymerization of vinylidene fluoride
PVDF samples were obtained from solution polymerization of vinylidene fluoride (VDF, 99%, provided by Dyneon GmbH) in scCO2 (grade 4.5, 99.995% Linde AG) at 393 K and 150 MPa with 0.07 mol L−1 di-tert-butyl peroxide (DTBP, 99% AKZO Nobel) as initiator. The VDF concentration is 3.5 mol L−1. To control polymer molar mass 0.23 mol L−1 ClC6F12I (98%, Apollo Scientific Limited) was used as chain transfer agent (CTA). The CTA allows for controlled reversible – deactivation radical polymerization, so-called controlled radical polymerizations, and therefore, the synthesis of low dispersity polymer. Moreover, the controlled radical polymerization of VDF excels robust, solvent- as well as stabilizer-free characteristics. For more details refer to ref. 33 and 34.Rapid expansion of supercritical solutions (RESS)
In a typical RESS experiment, the polymer is dissolved in scCO2 (grade 3.0, 99.90% Linde AG) at 323 K and 20 MPa. The homogeneous supercritical mixture is subsequently rapidly expanded through a heated capillary nozzle (338 K, inner diameter = 50 μm) to atmospheric conditions. As a consequence, spontaneous phase transition occurs and polymer particles are formed. The RESS process is carried out for 45 minutes. Further details on the experimental set-up and the general experimental procedure can be found elsewhere.40,41Analytical methods
In order to determine the particle size of the obtained polymer particles, scanning electron microscopy (SEM) was performed. The sample preparation included the loading of polycarbonate membranes (What-man®NucleporeTM, 47 mm diameter with a 0.2 μm pore size) within the RESS expansion chamber followed by platinum sputtering (approx. 2 nm). The SEM micrographs (secondary electrons) were taken with the support of the Laboratory for Electron Microscopy (KIT) using a LEO 1530 microscope (Carl Zeiss AG, Germany) at acceleration voltages of 2.0 kV and 5.0 kV. By means of ImageJ 1.46r, a free image processing and analysis program, the particle surface area was measured. The corresponding diameters of size equivalent spheres were afterwards used to calculate the particle size distribution (PSD, Q0) of the sample. The particle diameters x10, x50 and x90 serve for PSD characterization. For example, x10 is defined as the diameter where 10% of the particles have a smaller diameter than x10. The remaining 90% show larger diameters.Polymer molar mass distributions (MMD) were measured via size-exclusion chromatography (SEC) using N,N-dimethyl acetamide (99% pure, Acros) containing 0.1% LiBr (99%, Riedel-de Haën) as eluent. The SEC set-up detailed in ref. 34 was calibrated using low dispersity polystyrene standards (PSS).
Infrared spectra were measured using a FTS 7000 (BIO-RAD) FT-IR spectrometer equipped with a photoacoustic spectroscopy (PAS) cell (model 300, MTEC). The spectra were recorded under He atmosphere. Pure graphite was utilized as background spectra. FTIR spectroscopy as well as X-ray powder diffraction (XRD) were used to study the type of crystallinity for all samples.
XRD analyses were conducted by a STADI-P diffractometer (STOE) with Ge-monochromatized Cu-Kα radiation (λ = 1.54060 Å). The diffractograms have been recorded in a 2 theta range of 0–69° with a step size of 0.03° (1200 s).
Finally, to check for the piezoelectric response of the particles, piezoresponse force microscopy (PFM) was used.42 This technique is based on a standard scanning force microscope (SFM), operated in contact-mode with an alternating voltage (Vpp = 15 V, f ∼ 50 kHz) applied to the tip resulting in an alternating electric field inside the sample which, because of the small radius of the tip (∼50 nm), is concentrated in a tiny volume at the sample's surface. In the case of piezoelectric samples, the latter undergoes a periodic deformation, taking along the tip which results in a bending of the cantilever that is finally read-out via beam deflection combined with a segmented photodiode and demodulated using a lock-in amplifier. The characteristics of PFM is roughly speaking summarized as follows: the lateral resolution (governed by the tip radius) is typically few 10 nm and the sensitivity is sufficient to detect piezoelectric responses as small as 0.1 pm V−1. PFM consequently allows a highly resolved lateral mapping of the piezoelectric properties of a sample. Simultaneously to the PFM signal, the topography of the sample can be read-out independently. For an estimate of the magnitude of the piezoresponse measured, lithium-niobate was used as a reference sample. Since every scanning force microscopy and thus also PFM requires flat surfaces, suitable samples had to be obtained from the powder-like material. This could be realized by spreading minimal doses of the material on a microscope slide, which was previously covered with an UV-curing adhesive. Very gentle pressing with another microscope slide assured for the flatness of the surface. The sample was finished by short UV illumination. For the generation of poled areas, voltage pulses (+/− 100 V for 10 s) were applied to the tip, yielding highly localized electric fields beneath the tip which exceeded the coercive field of the material.
Results and discussion
In the following section three samples were differentiated: the so-called “raw material” is the PVDF polymer received by controlled radical polymerization in scCO2 prior to RESS. The PVDF fraction which remained in the extractor column of the RESS apparatus and which was thus not micronized, is referred to as “residue”. For the RESS product the term “RESS” is used. At the same time, three colors are utilized in the subsequent graphs: the raw material is represented in grey, the residue in blue and the RESS sample in red.Fig. 1 and 2 summarize the significant effect of RESS on the polymer powder size. The raw material is a white powder featuring rather large agglomerates/aggregates. One example is demonstrated in Fig. 1a with a diameter of nearly 15 μm.
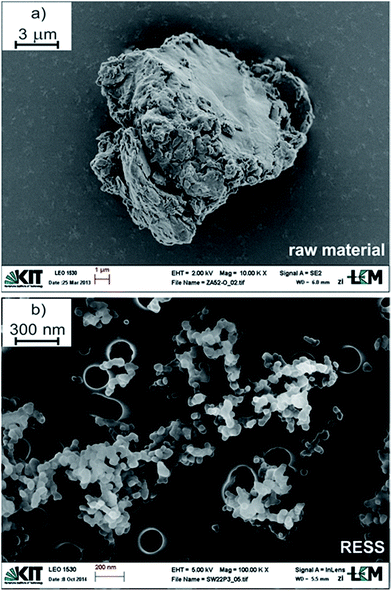 | ||
| Fig. 1 SEM images of PVDF (a) prior and (b) after micronization via RESS. Please note the differing scale bars. | ||
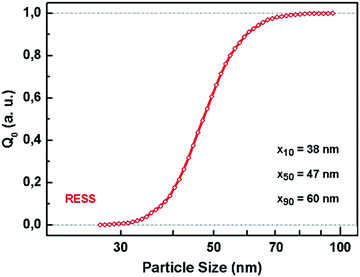
A typical SEM image of micronized polymer particles is additionally shown below (Fig. 1b). In Fig. 2 the associated PSD with ranging particle sizes from 38 nm (x10) to 60 nm (x90) is presented. This size distribution is based on the evaluation of approximately 30.000 particles of 35 SEM micrographs, taking into account varying sample collection times and lengths during the RESS experiment. The resulting median particle size (x50) is 47 nm which means that the average particle size was reduced by a factor of 300.
It is known that the polymer solubility in CO2 increases with decreasing molar mass.40 Since a sufficient solubility is crucial for the RESS process itself, our present investigation regards comparatively low molar mass PVDF. The number average molar mass (Mn) of the raw material is 2000 g mol−1 and shows a dispersity (Đ) of 1.3 (cf.Table 1). The MMDs of all samples are depicted in Fig. 3. Compared to the distribution of the raw material, the red line representing the material after micronization is shifted to the left implying that low molar mass species are preferentially extracted due to higher solubility. The polymer which remained in the extractor of the RESS apparatus thus consists of the higher molar mass species of the initial raw material. The dispersity was not changed by RESS. Mn and Đ data values are listed in Table 1.
| Sample | M n (g mol−1) | Đ |
|---|---|---|
| Raw material | 2000 | 1.3 |
| Residue | 2500 | 1.3 |
| RESS | 1400 | 1.3 |
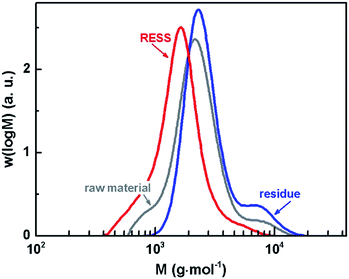 | ||
| Fig. 3 MMDs of PVDF prior to micronization (raw material), as residue and after micronization (RESS). | ||
Whether RESS is able to change crystal phases of PVDF was investigated applying FTIR in combination with XRD analyses. This procedure is in line with current literature and allows for the correct identification of the phases.43Fig. 4a demonstrates the FTIR analyses of the three samples. Note, the photoacoustic cell allows for analysis of the solid material without any processing, e.g. as required for ATR. For reasons of clarity just a few representative absorption bands were high-lighted. The raw material exhibits typical absorption band characteristics of the α phase.11,12,44–46
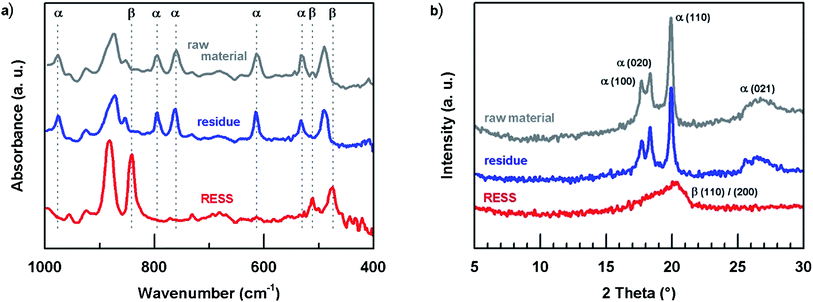 | ||
| Fig. 4 Crystal phase characterization of unprocessed PVDF, residue and via RESS micronized particles by (a) FTIR and (b) XRD. | ||
While the residue spectrum shows no change in comparison to the raw material, the analysis of the micronized particles is altered. Typical α bands like 615, 760 or 795 cm−1 have disappeared and a new strong absorption band has emerged at 840 cm−1. This band corresponds either to the β or the γ phase. Under consideration of some distinguishable FTIR bands of the γ phase which cannot be found in Fig. 4a (e.g. 776 and 812 cm−1), it is assumed that the particle formation via RESS has led to the formation of β phase particles.11,12,46 This assumption was confirmed by XRD.47–51 The patterns of raw material and residue are similar featuring characteristic α phase planes: (100), (020), (110) and (021) (cf.Fig. 4b). Consistent with FTIR analysis, the RESS diffractogram distinctly presents the β phase in a single peak at 2 theta = 20.26° ((110)/(200)). Both FTIR and XRD measurements were repeated after a period of three months indicating no significant crystal phase change.
To our knowledge, the origin of the PVDF phase transformation is not yet fully understood. Previously, it was reported that treatment of α PVDF films with scCO2 and rather slow controlled depressurization did not result in a phase transformation.46 However, successful phase transformation from α into β phase PVDF has already been induced by ultra-fast cooling/quenching of the melt.43,52,53 The formation of β phase PVDF strongly depends on the quenching temperature assuming that the maximum nucleation rate of the β phase occurs at lower temperatures than that of the α phase. Thus, in the case of a high cooling rate, α phase nucleation is suppressed and β phase formation is preferred. Applying RESS, the phase transformation is suggested to be the result of super-cooling due to the extremely high rate of expansion which triggers the crystallization of the solute.54 At the same time, however, it should be noted that further experiments are needed in order to understand cause and mechanism of the phase transformation. This is emphasized by studies on the polymorphic control of pharmaceuticals via RESS. For example, it was found that the crystalline form of the pharmaceuticals barbital, tolbutamide and carbamazepine particles depend on the specific extraction conditions of the RESS process.54,55
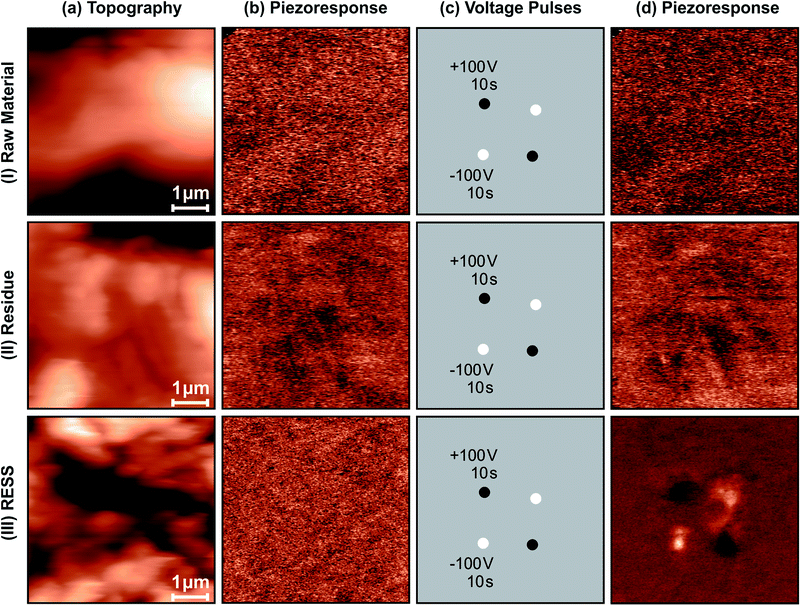
The piezoelectric properties of the PVDF particles in their β form obtained via REES could be established by PFM measurements. Therefore, three identical data sets investigating the raw material (I), the residue (II) and the micronized particles (III) were recorded (Fig. 5). Each data set consisted of three steps: characterization of the sample (topography (a) and piezoresponse (b)), application of voltage pulses at four positions (c), and again recording topography (not shown) and piezoresponse (d) of the sample. Comparison of the two topographical images confirmed having recorded the same position before and after the application of the voltage pulses. Fig. 5 shows the results of the experiments. Obviously, despite the careful sample preparation, the topography for all three samples showed a roughness of ∼1 μm, which is the maximum corrugation a SFM can handle, leading to long image acquisition times of 20 min per 5 × 5 μm²-scan. Initially, the piezoresponse (b) of all three samples featured no distinct patterns but basically shows an information-free noise image. After the application of voltage pulses, however, only the sample with the micronized particles (III) exhibited locally poled areas, whereas for both, the raw material (I) and the residue (II), no change in the piezoresponse image could be observed. Control-experiments at different positions of the samples yielded the same results. The piezoresponse image of the REES sample needs a little more discussion. At first glance, it is striking that (III d) is a lot less noisy when compared to all other piezoresponse images shown. This is due to the fact that the sensitivity of the detection was reduced by a factor of ten, thus preventing saturation of the PFM signal. The amplitude of the piezoresponse is of the order of 10 pm V−1. The contrast (black/white dots) meets the expectations from the polarity of the poling voltage pulse. Upon closer view, it can be perceived that the poled areas are not circular dots but exhibit a distinct structure which is most probably caused by the roughness of the sample.
Conclusions
RESS was successfully applied on PVDF (Mn = 2000 g mol−1) obtained from controlled radical polymerization in scCO2. The rapid expansion of the scCO2–PVDF mixture led to the formation of submicron polymer particles with a median particle size of 47 nm. With regard to the raw material used, particles with a clearly reduced average molar mass were generated which is attributable to the higher solubility of lower molar mass PVDF in scCO2. It was also stated, that the dispersity of the samples was not affected by the extraction. The samples were further analyzed by FTIR and XRD revealing a transformation from α to β phase PVDF. An unambiguous proof of the piezoelectric property of the RESS-processed β phased particles was obtained by means of PFM measurements. Pursuing investigations will focus on the thorough study of the crystal phase transformation and the fascinating electrical properties of the obtained particles.Acknowledgements
The authors thank Z. Abishevac for polymer synthesis, V. Zibat (Laboratory for Electron Microscopy, KIT) for SEM analysis and Prof. C. Feldmann (Institute for Inorganic Chemistry, KIT) for diffractometer provision. The authors thank E. Soergel (Institute of Physics, University of Bonn) for performing the scanning force microscopy experiments and the analysis of the data thus obtained. The Project (“Fabrication of submicron PVDF particles”, Tu 93/13-1 and Be 2033/3-1) is funded by the German Research Foundation (DFG), which is gratefully acknowledged.References
- J. S. Humphrey and R. Amin-Sanayei, in Encyclopedia of Polymer Science and Technology, ed. H. F. Mark, Wiley, New York, 3rd edn, 2003, vol. 4, pp. 510–533 Search PubMed.
- D. A. Seiler, in Modern Fluoropolymers, ed. J. Scheirs, Wiley, New York, 1997, ch. 25, pp. 487–506 Search PubMed.
- F. J. Lu and S. L. Hsu, Macromolecules, 1986, 19, 326 CrossRef CAS.
- N. Kawai, Jpn. J. Appl. Phys., 1969, 8, 1975 Search PubMed.
- J. G. Bergman, J. H. McFee and G. R. Crane, Appl. Phys. Lett., 1971, 18, 203 CrossRef CAS.
- K. Nakamura and Y. J. Wada, J. Polym. Sci., Part A-2, 1971, 9, 161 CrossRef CAS.
- A. J. Lovinger, in Developments in Crystalline Polymers 1, ed. D. C. Bassett, Applied Science Publishers, London and New Jersey, 1982, ch. 5, pp. 195–273 Search PubMed.
- R. G. Kepler, in Ferroelectric Polymers – Chemistry, Physics, and Applications, ed. H. S. Nalwa, Marcel Dekker Inc., New York, 1995, ch. 3, pp. 183–232 Search PubMed.
- A. J. Lovinger, Polymer, 1980, 21, 1317 CrossRef CAS.
- S. L. Hsu, F. J. Lu, D. A. Waldman and M. Muthukumar, Macromolecules, 1985, 18, 2583 CrossRef CAS.
- R. Gregorio Jr and M. J. Cestari, J. Polym. Sci., Part B: Polym. Phys., 1994, 32, 859 CrossRef.
- M. Imran-ul-haq, B. Tiersch and S. Beuermann, Macromolecules, 2008, 41, 7453 CrossRef CAS.
- V. Sencadas, R. Gregorio Jr and S. J. Lanceros-Méndez, J. Macromol. Sci., Part B: Phys., 2009, 48, 514 CrossRef CAS.
- S. K. Ghosh, M. Alam and D. Mandal, RSC Adv., 2014, 4, 41886 RSC.
- P. Thakur, A. Kool, B. Bagchi, S. Das and P. Nandy, Appl. Clay Sci., 2014, 99, 149 CrossRef CAS.
- C.-L. Liang, Q. Xie, R.-Y. Bao, W. Yang, B.-H. Xie and M.-B. Yang, J. Mater. Sci., 2014, 49, 4171 CrossRef CAS.
- D. Yuan, Z. Li, W. Thitsartarn, X. Fan, J. Sun, H. Li and C. He, J. Mater. Chem. C, 2015, 3, 3708 RSC.
- J. S. Harrison and Z. Ounaies, in Encyclopedia of Polymer Science and Technology, ed. H. F. Mark, Wiley, New York, 3rd edn, 2003, vol. 3, pp. 474–498 Search PubMed.
- J. G. Bergman Jr, J. H. McFee and G. R. Crane, Appl. Phys. Lett., 1971, 18, 203 CrossRef.
- J. H. McFee, J. G. Bergman Jr and G. R. Crane, Ferroelectrics, 1972, 3, 305 CrossRef CAS.
- S. Bauer and B. J. Ploss, Appl. Phys., 1990, 68, 6361 CAS.
- A. Navid and L. Pilon, Smart Mater. Struct., 2011, 20, 025012 CrossRef.
- S. Chen, X. Li, K. Yao, F. E. H. Tay, A. Kumar and K. Zeng, Polymer, 2012, 53, 1404 CrossRef CAS.
- Z.-W. Ouyang, E.-C. Chen and T.-M. Wu, J. Appl. Polym. Sci., 2014, 131, 40941 CrossRef.
- C. D. Wood, J. C. Yarbrough, G. Roberts and J. M. DeSimone, in Supercritical Carbon Dioxide in Polymer Reaction Engineering, ed., M. F. Kemmere and T. Meyer, Wiley-VCH, 2005, vol. 1, ch. 9, pp. 189–204 Search PubMed.
- J. E. Dohany, in Fluorine Chemistry: A Comprehensive Treatment, ed. M. Howe-Grant, Wiley, New York, 1995, vol. 1, pp. 454–472 Search PubMed.
- J. L. Kendall, D. A. Canelas, J. L. Young and J. M. DeSimone, Chem. Rev., 1999, 99, 543 CrossRef CAS PubMed.
- A. I. Cooper, J. Mater. Chem., 2000, 10, 207 RSC.
- J. A. Behles and J. M. DeSimone, Pure Appl. Chem., 2001, 73, 1281 CrossRef CAS.
- J. M. DeSimone, Z. Guan and C. S. Elsbernd, Science, 1992, 257, 945 CAS.
- M. K. Saraf, S. Gerard, L. M. Wojcinski II, P. A. Charpentier, J. M. DeSimone and W. R. Roberts, Macromolecules, 2002, 35, 7976 CrossRef CAS.
- Z. Shi, Z. Zheng, X. Su and X. Wang, e-Polym., 2006, 6, 979 Search PubMed.
- S. Beuermann and M. Imran-ul-haq, Macromol. Symp., 2007, 259, 210 CrossRef CAS.
- S. Beuermann and M. Imran-ul-haq, J. Polym. Sci., Part A: Polym. Chem., 2007, 45, 5626 CrossRef CAS.
- K. T. Lim, G. H. Subban, H. S. Hwang, J. T. Kim, C. S. Ju and K. P. Johnston, Macromol. Rapid Commun., 2005, 26, 1779 CrossRef CAS.
- D. Bolten and M. Türk, J. Supercrit. Fluids, 2012, 62, 32 CrossRef CAS.
- R. Bettini, L. Bonassi, V. Castoro, A. Rossi, L. Zema, A. Gazzaniga and F. Giordano, Eur. J. Pharm. Sci., 2001, 13, 281 CrossRef CAS PubMed.
- M. Türk, in Supercritical Fluid Science and Technology Series, ed. E. Kiran, Elsevier, 2014, vol. 6, ch. 4, pp. 57–75 Search PubMed.
- S.-D. Yeo and E. Kiran, J. Supercrit. Fluids, 2005, 34, 287 CrossRef CAS.
- E. Breininger, M. Imran-ul-haq, M. Türk and S. Beuermann, J. Supercrit. Fluids, 2009, 48, 48 CrossRef CAS.
- M. Türk, G. Upper and P. Hils, J. Supercrit. Fluids, 2006, 39, 253 CrossRef.
- E. Soergel, J. Phys. D: Appl. Phys., 2011, 44, 464003 CrossRef.
- P. Martins, A. C. Lopes and S. Lanceros-Méndez, Prog. Polym. Sci., 2014, 39, 683 CrossRef CAS.
- G. Cortili and G. Zerbi, Spectrochim. Acta, Part A, 1967, 23, 285 CrossRef.
- M. Kobayashi, K. Tashiro and H. Tadokoro, Macromolecules, 1975, 8, 158 CrossRef CAS.
- Y.-T. Shieh, T.-T. Hsiao and S.-K. Chang, Polymer, 2006, 47, 5929 CrossRef CAS.
- G. T. Davis, J. E. McKinney, M. G. Broadhurst and S. C. Roth, J. Appl. Phys., 1978, 49, 4998 CrossRef CAS.
- R. Gregorio Jr and E. M. Ueno, J. Mater. Sci., 1999, 34, 4489 CrossRef.
- D. M. Esterly and B. J. Love, J. Polym. Sci., Part B: Polym. Phys., 2004, 42, 91 CrossRef CAS.
- J. Buckley, P. Cebe, D. Cherdack, J. Crawford, B. S. Ince, M. Jenkins, J. Pan, M. Reveley, N. Washington and N. Wolchover, Polymer, 2006, 47, 2411 CrossRef CAS.
- R. Gregorio, J. Appl. Polym. Sci., 2006, 100, 3272 CrossRef CAS.
- Y. Oka and N. Koizumi, Bull. Inst. Chem. Res., Kyoto Univ., 1985, 63, 192 CAS.
- D. Yang and Y. Chen, J. Mater. Sci. Lett., 1987, 6, 599 CrossRef CAS.
- D. Sanli, S. E. Bozbag and C. Erkey, J. Mater. Sci., 2012, 47, 2995 CrossRef CAS.
- K. Moribe, Y. Tozuka and K. Yamamoto, Adv. Drug Delivery Rev., 2008, 60, 328 CrossRef CAS PubMed.
| This journal is © The Royal Society of Chemistry 2015 |

