G. Veréb*ab,
T. Gyulavária,
Zs. Papacd,
L. Baiade,
K. Mogyorósia,
A. Dombia and
K. Hernádiaf
aResearch Group of Environmental Chemistry, Institute of Chemistry, University of Szeged, H-6720, Szeged, Tisza Lajos krt. 103, Hungary. E-mail: verebg@chem.u-szeged.hu; Fax: +36-62-544338; Tel: +36-62-544338
bDepartment of Process Engineering, Faculty of Engineering, University of Szeged, H-6725, Szeged, Moszkvai krt. 9, Hungary
cFaculty of Chemistry and Chemical Engineering, Babes-Bolyai University, RO–400028, Arany János 11, Cluj-Napoca, Romania
dFaculty of Physics, Babes–Bolyai University, RO–400084, M. Kogălniceanu 1, Cluj–Napoca, Romania
eInstitute for Interdisciplinary Research on Bio-Nano-Sciences, RO–400271, Treboniu Laurian 42, Cluj-Napoca, Romania
fDepartment of Applied and Environmental Chemistry, University of Szeged, H-6720, Rerrich tér 1, Szeged, Hungary
First published on 29th July 2015
The characteristic properties and the resulted photocatalytic efficiencies of rutile-phase titanium dioxides were investigated in the present study. A series of rutile with different primary particle sizes (5.2–290 nm) were produced by a sol–gel method followed by calcination and were characterized by XRD, DRS, TEM, XPS, EPR, IR and N2 adsorption. Their photocatalytic efficiencies were determined in the decomposition of phenol, and in the inactivation of E. coli bacteria under visible light irradiation. The results were compared with the photocatalytic performance of commercial Aldrich rutile and Aeroxide P25 powders. Of the non-commercial products, the TiO2 with the smallest particle size displayed the highest efficiency, while the surface-normalized photocatalytic performance was significantly higher for the larger rutile particles. This can be explained by the red shift of light absorption at higher calcination temperatures. Although Aldrich rutile and the corresponding laboratory-made photocatalyst exhibited similar structural features (e.g. particle size, specific surface area, morphology and light absorption), the latter proved to be less efficient despite its Ti3+ content (while Aldrich rutile contains only Ti4+). The main reason for the much higher photocatalytic performance was the presence of Ti–O–O– entities on the surface of Aldrich rutile. On the basis of these results, in the case of rutile-phase titanium dioxide, the presence of Ti–O–O– entities was more beneficial, than the presence of Ti3+ and low-binding-energy oxygen (which indicates defects) in relation with the photocatalytic performance under visible light irradiation.
Aldrich rutile demonstrated the mentioned high disinfection property14 despite its large average primer particle size (∼315 nm) and very low (3 m2 g−1) specific surface area. Generally high specific surface area is preferred in photocatalytic processes, but Amano and Nakata15 described an improved photocatalytic activity for large rutile particles, which was explained by the increased lifetime of the photogenerated charge carriers. Large particle size can also be beneficial in disinfection processes, although no clear experimental evidences can be found in the literature.
The main aim of the present study was to investigate the liaison between the specific surface area (and/or surface properties) and the photocatalytic performances of rutile. Therefore, in the first instance nanosized (∼5 nm) non-doped rutile was obtained, followed by calcination at different temperatures (400–1000 °C), resulting a series of rutile photocatalysts with finely tuned specific surface areas (1–197 m2 g−1). The photocatalytic performance was determined under visible light irradiation using phenol and E. coli bacteria as model contaminants. The investigated photocatalysts were characterized by XRD, DRS, TEM, XPS, EPR, IR and N2 adsorption.
For the determination of the photocatalytic efficiencies, phenol (Spektrum 3D; analytical grade) and E. coli K12 bacteria were applied as model water contaminants. Photocatalytic experiments were carried out in NaCl (Spektrum 3D; analytical grade) solutions.
The reference TiO2 photocatalysts were commercially available Aeroxide P25 (produced by Evonik Industries) and Aldrich rutile.
The DR spectra of the samples (λ = 220–800 nm) were measured on a Jasco-V650 diode array computer-controlled (SpectraManager Software) spectrophotometer equipped with an integration sphere (ILV-724).
TEM micrographs were recorded on a Philips CM 10 instrument operating at 100 kV, using Formvar-coated copper grids.
The specific surface areas of the catalysts were determined by N2 adsorption at 77 K, using a Micromeritics gas adsorption analyzer (Gemini Type 2375). The specific surface area was calculated via the BET method.
XPS measurements were performed on a Specs Phoibos 150 MCD instrument, with monochromatized Al Kα radiation (1486.69 eV) at 14 kV and 20 mA, and a pressure lower than 10−9 mbar. Samples were mounted on the sample holder with the use of double-sided adhesive carbon tape. High-resolution Ti 2p and O 1s spectra were recorded in steps of 0.05 eV for the analyzed samples. The data obtained were analyzed with CasaXPS software. All peaks were deconvoluted by using the Shirley background and Lorentzian–Gaussian line shapes. The value of the Gaussian–Lorentzian ratio applied was 30.
The FT-IR measurements were made with a Bruker Equinox 55 spectrometer with an integrated FRA 106 Raman module. Samples were ground with KBr and pressed into thin pellets (thickness ≈ 0.3 mm). IR spectra were recorded with a spectral resolution of 2 cm−1.
EPR measurements were performed on powder samples using an EPR spectrometer ADANI PS 8400 system (ADANI Company, Minsk, Republic of Belarus) in the X-band. The samples were introduced in quartz tubes of 2 mm inner diameter. The EPR measurements were performed for all samples with the same conditions and using the same amount of powder.
![]() | ||
Fig. 1 Emission spectra of the conventional energy-saving compact fluorescence lamps (with and without NaNO2 cut-off filtration). |
The TiO2 suspensions (V = 100 mL; cTiO2 = 1.0 g L−1) which contained 0.1 mM phenol as model contaminant were sonicated for 5 min before the photocatalytic tests and then stirred with a magnetic stirrer, and air was purged through the reaction mixture (pH ∼ 6) during the experiments. Changes in phenol concentration were followed with an Agilent 1100 series HPLC system equipped with a Lichrospher RP 18 column, a methanol:
water = 35
:
65 mixture being applied as eluent (detection was carried out at 210 nm). The initial degradation rates were calculated from the slopes of the decay curves (t = 0).16
Disinfection efficiencies were investigated in the same photoreactor as that in which the phenol decomposition experiments were carried out. The photocatalysts were added to a 0.9% NaCl solution and homogenized by ultrasonication, and an E. coli K12 bacteria suspension was then inoculated into it; this suspension was prepared as follows. The bacterial culture was grown at 37 °C in 0.9% NaCl solution containing 1% Tripton (Reanal, analytical grade) and 0.5% yeast extract (Scharlau, analytical grade) as nutrients. The culture was incubated for 24 h and then purified twice with a 0.9% saline solution by centrifugation (4000 rpm, 2 min) to eliminate the nutrients; the sediment was re-suspended in 0.9% NaCl solution. The initial colony forming unit level in the investigated solution (pH ∼ 7) was set to be 104 CFU per mL. During the photocatalytic disinfection experiments, samples were plated on agar gels (Merck, analytical grade) and the grown colonies were counted after a 24 h incubation at 37 °C in the dark.
![]() | ||
Fig. 2 Heating profile of the different calcination temperatures (RHSE: rapid heating short exposure – more details are given in an earlier publication28). |
The main crystalline phase of the prepared TiO2-s was rutile (>99 wt%). The average diameters of the particles, estimated by using the Scherrer equation (when it is lower than 100 nm), are presented in Table 1. Rutile-O contained very small nanoparticles (D ∼ 5 nm) and, as expected, the average particle size increased (13–290 nm) with the rising calcination temperature (400–1000 °C). The primary particle sizes and phase distributions of commercial reference photocatalysts are also presented in Table 1. Aeroxide P25 contains 90 wt% anatase and 10 wt% rutile (Danatase = 25.4 nm and Drutile = 40 nm), while Aldrich rutile contains mainly (96 wt%) rutile (D ∼ 315 nm).
Anatase (wt%) | Rutile (wt%) | DA (nm) | DR (nm) | Specific surface area (m2 g−1) | r0,phenol (10−10 M s−1) | r0,phenol (10−12 mol m−2 s−1) surface normalized | |
---|---|---|---|---|---|---|---|
Rutile-O | <1 | >99 | — | 5.2 | 197 | 8.7 | 4.4 |
Rutile-RHSE-400 | <1 | >99 | — | 12.9 | 62 | 3.2 | 5.2 |
Rutile-RHSE-600 | <1 | >99 | — | 39.1 | 34 | 3.1 | 9.1 |
Rutile-RHSE-700 | <1 | >99 | — | 69.3 | 12 | 3.1 | 25.8 |
Rutile-RHSE-800 | <1 | >99 | — | 135TEM | 7 | 2.0 | 28.6 |
Rutile-RHSE-900 | <1 | >99 | — | 245TEM | 3 | 1.9 | 63.3 |
Rutile-RHSE-1000 | <1 | >99 | — | 290TEM | 1 | 1.8 | 175.0 |
Aldrich rutile | 4 | 96 | 315TEM | 315TEM | 3 | 41.6 | 1386.7 |
Aeroxide P25 | 90 | 10 | 25.4 | 40.0 | 49 | 12.3 | 25.1 |
Transmission electron microscopic (TEM) images (Fig. 4.) were taken to determine the particle size (when it is higher than 100 nm), the size distribution and the morphology of the particles.
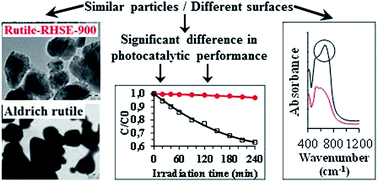
The laboratory-prepared rutile particles were mostly rounded, edgeless and polydisperse (e.g. Rutile-RHSE-900 contains particles with D = 100–400 nm). The micrographs of Aldrich rutile and Rutile-RHSE-900 revealed very similar morphology and particle size distribution. Aeroxide P25 contained spherical and polyhedral (faceted) particles too.
The specific surface areas of the laboratory-made rutile titanias varied within a wide range (1–197 m2 g−1, Table 1). Non-calcined Rutile-O exhibited the highest value (197 m2 g−1), which decreased concomitantly with the temperature raising. It should be noted that Rutile-RHSE-900 and Aldrich rutile demonstrated the same specific surface area: ∼3 m2 g−1.
To investigate the light absorption properties of the synthesized photocatalysts, diffuse reflectance spectra were recorded (Fig. 5).
As the calcination temperature was increased, the light absorption of the produced rutile TiO2-s underwent a red shift (similar effect was demonstrated by Silva and Faria29). Interestingly, Rutile-RHSE-900 and Rutile-RHSE-1000 displayed very similar light absorption properties to those of Aldrich rutile. Consequently, the increased visible light absorption of the TiO2-s calcined at higher temperatures is expected to be accompanied by higher photocatalytic activity under visible light irradiation.
The photocatalytic experiments revealed the highest rate of phenol degradation for Rutile-O among the laboratory-made TiO2-s. Interestingly, the light absorption edge gradually shifted into the visible region (see Fig. 5) as the calcination temperature was increased. Furthermore, an increase in the primary particle size (5–290 nm) and a decrease in the specific surface area (from 197 to 1 m2 g−1) were also observed. A comparison of the photocatalytic activities with the above-mentioned properties indicates the following important observations:
(i) the photocatalytic activity decreased slightly on elevation of the calcination temperature because of the lower specific surface area.
(ii) The surface-normalized rate of degradation of phenol (mol s−1 m−2) varied oppositely to the previous trend (Table 1). This could be due to the more efficient visible light absorption (see Fig. 5) of the TiO2-s calcined at higher temperatures.
Aldrich rutile has ∼22 times higher photocatalytic efficiency than that of Rutile-RHSE-900, despite these TiO2-s having very similar specific surface area, particle size and morphology (rounded, edgeless shape, and highly polydispersed size distribution). The light absorption properties of these photocatalysts are also nearly the same.
The photocatalytic performances of the laboratory-made TiO2-s were compared with that of the most commonly used reference TiO2, Aeroxide P25. Rutile-O TiO2 and Aeroxide P25 gave rise to similar phenol decomposition yields under visible light irradiation. The relatively high efficiency of Aeroxide P25 is very interesting, considering the fact that it contains mainly (∼90%) anatase, which cannot be activated by visible light. There are some different explanations for this high efficiency in the literature. Balázs et al.30 reported that polyhedral nanoparticles have higher photocatalytic activity than spherical ones, and Aeroxide P25 contains polyhedral particles whereas Aldrich rutile and the laboratory-made photocatalysts do not (see Fig. 4). Another explanation is provided by Rajashekhar and Devi31 and by Ohno et al.:32 they describe a special synergetic effect of anatase and rutile nanoparticles in Aeroxide P25, which can result in the high activity of this type of TiO2. However this synergetic effect is doubted by Ohtani et al.33
The grown colonies are illustrated in a photo (see Fig. 8) in the case of Rutile-O. More than 90% of the E. coli cells were killed after 2 h of irradiation in the presence of this TiO2 with its very small nanoparticles (∼5 nm).
![]() | ||
Fig. 8 E. coli colonies grown in photocatalytic disinfection experiment with laboratory-made Rutile-O. |
None of the other (calcined) laboratory-made rutile photocatalysts exhibited any disinfection properties after the 120 min irradiation. Aeroxide P25 totally sterilized the water after 60 min, while Aldrich rutile (with large nanoparticles ∼315 nm) did so after 20 min whereas Rutile-RHSE-900 (with a similar particle size and the same specific surface area as those of Aldrich rutile) was not active at all. In experiments with the TiO2-s without irradiation, no antibacterial effect was seen.
In an attempt to explain the great difference in photocatalytic efficiency, X-ray photoelectron, and IR spectroscopic and EPR examinations were also carried out on these two samples.
X-ray photoelectron spectra (Ti 2p, O 1s) are presented in Fig. 9.
The surface of the Aldrich rutile does not appear unusual. In the Ti 2p XPS spectrum only Ti4+ was detected, while the O 1s spectrum revealed the usual components: oxide oxygen from TiO2 (530.3 eV), surface OH group oxygen (532 eV), and oxygen from H2O (532.8 eV). As the Rutile-RHSE-900 was made by the rapid heat treatment method,27,28,34 we expected the appearance of new spectral features. Indeed, in the Ti 2p XPS spectrum a small amount of Ti3+ was observed (13 at%: peaks at 457.3 eV and 461.9 eV), along with Ti4+ (87 at%: peaks at 459.1 eV and 464.8 eV).27 The O 1s spectrum of this material indicated a low binding energy oxygen species (at 528.8 eV, 12 at%). On the basis of recent publications,27,28 this interesting form of oxygen was ascribed to the presence of oxygen defects, or to oxygen atoms adjacent to reduced Ti sites (i.e. Ti3+). This is reinforced by the fact that Ti3+ and the low binding energy oxygen are interdependent entities: if one them appears in a surface composition, so does the other. In the cases of the other fast heat-treated TiO2-s (in which the predominant crystal phase was anatase), the presence of this special species was earlier observed to enhance the photocatalytic activity (UV – phenol degradation) as it is described in our previous study.27 In the present study (rutile – VIS – phenol degradation), the presence of this species did not enhance the photocatalytic performance: a drastic inhibition was registered. Consequently the specific roles of Ti3+ and O vacancies needs further investigations as it is also emphasized by Su et al. in their excellent review article35 about the complexity of this topic.
To get further evidence, EPR measurements were carried out, which proved the presence of Ti3+ in Rutile-RHSE-900 (ref. 36 and 37) (see the inset of Fig. 9). As it can be seen, until now, there are no clear evidences concerning the higher photocatalytic activity. The explanation regarding this issue, must be surface related, as the photocatalytic properties are surface quality dependent phenomena.
Hence, IR measurements were carried out and were presented in Fig. 10. The usual features were noted for both samples, the most important being the broad band centered at 3400 cm−1, with a sharp band at 1630 cm−1, which can be attributed to the stretching and bending vibrations of the surface OH group.27
In the inset of Fig. 10, the Ti–O–Ti bond stretching vibrations can be identified at 519 cm−1 for the rutile phase.38 The samples presented similar peaks of CO2 at 2380 cm−1. The only difference between the IR spectra is the appearance of a new band for Aldrich rutile at 687 cm−1, which corresponds to Ti–O–O– bond stretching vibrations.8,39–41 This indicates an oxygen-rich surface on the catalyst, which could be an electrophilic entity. Since rutile is activated in visible light (as shown by the DRS spectra) and the charge carriers are formed as usual, this “peroxidized” surface can attract electrons, which can then be easily captured by molecular oxygen, resulting finally in higher radical generation (high hydroxyl radical generation was proved in our earlier publication14 in case of visible light activated Aldrich rutile). Shankar and co-workers,40 and Zou and co-workers41 also reported enhanced photocatalytic activity in their Ti–O–O– groups containing, laboratory prepared titanium-dioxides.
The DR spectra indicated that the light absorption was shifted into the visible region on increase of the calcination temperature, which may explain the significantly increased surface-normalized photocatalytic performance of the calcined TiO2-s.
The results of XRD, DRS, BET and TEM characterization methods demonstrated that Aldrich rutile and the laboratory-made Rutile-RHSE-900 have very similar properties, such as particle size, specific surface area, morphology and light absorption, but they differ significantly in photocatalytic efficiency (for either phenol decomposition or disinfection). A close correlation was not observed between these structural parameters and the photocatalytic efficiency of rutile.
The present work highlighted that surface properties causes much higher differences in photocatalytic performances than specific surface area, and the importance of the presence of Ti3+ was re-evaluated. It emerged from XPS and EPR measurements that the presence of Ti3+ and low-binding-energy oxygen on rutile does not enhance the photocatalytic performance (under visible light irradiation). However, the IR measurements revealed that Aldrich rutile has an oxygen-rich surface (Ti–O–O– entities), which can result in higher radical generation efficiency (despite it's low specific surface area: ∼3 m2 g−1). The presented results pointed out that the presence of Ti–O–O– entities is more preferable than the presence of Ti3+ in relation with the photocatalytic performance of rutile under visible light irradiation. Based on these results a next challenge is to prepare rutile-phased titanium dioxide with high specific surface area, containing Ti–O–O– groups on the surface.
This journal is © The Royal Society of Chemistry 2015 |