Design and development of Co3O4/NiO composite nanofibers for the application of highly sensitive and selective non-enzymatic glucose sensors

Ramachandran Ramasamya, K. Ramachandranc, Geo George Philipb, Rasu Ramachandranc, Helen Annal Therese*b and G. Gnana kumar*c
aDepartment of Physics and Nanotechnology, SRM University, Kattankulathur-603 203, Tamil Nadu, India
bNanotechnology Research centre, SRM University, Kattankulathur-603 203, Chennai, Tamil Nadu, India. E-mail: helen.a@ktr.srmuniv.ac.in
cDepartment of Physical Chemistry, School of Chemistry, Madurai Kamaraj University, Madurai-625 021, Tamil Nadu, India. E-mail: kumarg2006@gmail.com; Tel: +91-9585752997

Received 18th June 2015 , Accepted 1st September 2015

First published on 1st September 2015


Abstract

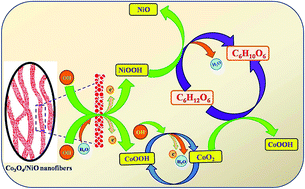
Cobaltosic oxide/nickel oxide (Co3O4/NiO) composite nanofibers were synthesized via an electrospinning technique and their electrocatalytic activities toward non-enzymatic glucose sensors were evaluated in detail. The Co3O4/NiO composite exhibited the homogeneously distributed nanofibers with high porosity, effective inter connectivity and an extended number of conducting channels with an average diameter of 160 nm. The diffraction patterns depicted the face centred cubic crystalline structure of Co3O4/NiO nanofibers and the purity of the composite nanofibers was further ensured by using FT-IR and UV-vis spectroscopic analyses. The electrocatalytic performances of prepared nanofibers toward the oxidation of glucose was determined by cyclic voltammetry and amperometry techniques and the experimental results showed that the Co3O4/NiO composite nanofibers exhibited a maximum electrooxidation toward glucose, owing to the synergistic effect of Co3O4 and NiO. The electrospun Co3O4/NiO nanofibers exhibited a detection limit of 0.17 μM, a wide linear range of 1 μM to 9.055 mM and a high sensitivity of 2477 μA mM−1 cm−2. The nanofibers have also exhibited favorable properties such as good selectivity, reproducibility, durability and real sample analysis, which ensured its potential applications in the clinical diagnosis of diabetes.


1. Introduction

Diabetes is one of the most widespread diseases that affects the human population globally. Three hundred and eighty two million people are affected worldwide1 and it causes 1.5 to 5.1 million deaths yearly, making it the 8th leading cause of death.2 This pressing situation calls for the development of cheap, reliable and portable glucose sensors. Currently, enzyme based/enzymatic glucose sensors are widely available on the market. Despite their widespread availability, there are some critical issues with enzymatic glucose sensors. Enzymatic glucose sensors are cost prohibitive, with prices reaching nearly 100 US$ per sensor.3 Apart from this, enzymatic glucose sensors suffer from poor reproducibility, thermal and chemical instabilities and susceptibility to enzyme poisoning molecules.4,5 The aforementioned serious problems with enzymatic glucose sensors have facilitated the need for alternate glucose sensors. A number of various methods such as colorimetry,6 fluorescent spectroscopy7 and other optical methods8 have been proposed; among which electrochemical non-enzymatic glucose sensors3 stand out. The affordable cost, low detection limit and high sensitivity of electrochemical based non-enzymatic glucose sensors favored their extensive applications.9,10 Hence, a large number of materials including precious11–13 and non-precious metal14,15 and metal oxides16,17 have been tested for their suitability as non-enzymatic glucose sensor probes. Among these various metal and metal oxides, nickel (Ni) and nickel oxide (NiO) modified electrodes have shown very high sensitivity, low detection limit and good linear response toward glucose oxidation,18–20 owing to its constructive properties such as large specific surface area, excellent electrical conductivity and better electrocatalytic activity. It also exhibits the advantage of being low cost due to the relative abundance of Ni in the earth's crust and NiO has shown to be superior over Ni due to the latter's tendency to get oxidized in air, which can drastically reduce its shelf life. However, pure NiO is inevitably suffered by its poor surface stability under the oxidation conditions, leading to the poor sensitivity and selectivity.21 To effectively tackle this adverse impact, NiO based composites have received more attention, in which the impact of cobaltosic oxide (Co3O4) is highly vibrant.22 If NiO is complexed with Co3O4, the mechanical, chemical and electrochemical properties and structural stability of host material could be enhanced. Hence, the aforementioned metal oxide composites in the form of various morphologies such as nanorods,23 nanofibers24 and as composites25 have been shown to exhibit prompt sensitivity and selectivity toward glucose in the alkaline media.

One dimensional nanostructures such as nanofibers and nanorods have been shown to be effective sensor probes due to their larger surface to volume ratio and high porosity.26,27 One of the best methods to synthesize one dimensional porous nanostructures is the electrospinning technique. Electrospinning technique has the advantages of low cost, high yield and good reproducibility and it is a facile technique to produce porous and large surface to volume ratio nanofibers in large quantities.28–30 Electrospinning at the laboratory level can be easily scaled up to the industrial scale to meet the commercial requirements for the manufacture of non-enzymatic glucose sensors as opposed to conventional laboratory techniques such as sol–gel and hydrothermal methods. In general, the electrochemical quantification of glucose at prepared nanostructures is initiated by the adsorption, diffusion and followed by the oxidation at the catalyst's surface. The maximum electrooxidation is initiated by the effectual adsorption and diffusion processes, which can be stimulated only at the extended cavities/porosities of the prepared catalysts. The high porosity of electrospun nanofibers helps in trapping the analytes without any significant diffusion resistance, leading to an increase in the response to electroactive species,31 ensuring good sensitivity of the material toward glucose. To utilize the advantages of nanofibers and metal oxide composites, Co3O4/NiO composite nanofibers have been developed and its influences toward the electrooxidation of glucose under various electrochemical regimes and conditions have been analyzed and reported in this research effort.

2. Experimental methods

2.1. Materials

Polyvinyl alcohol (PVA) (MW = 40[thin space (1/6-em)]000 g mol−1), nickel(II) acetate tetrahydrate (Ni(CH3COO)2·4H2O), cobalt(II) nitrate hexahydrate (Co(NO3)2·6H2O), glacial acetic acid, N,N-dimethylformamide (DMF), glucose, urea (U), uric acid (UA), ascorbic acid (AA), dopamine (DA), acetaminophen (AP) and sodium chloride (NaCl) were obtained from Sigma-Aldrich and used without any further purification. All of these reagents were of analytical grade and used as received.

2.2. Preparation of PVA solution

For the preparation of 15 wt% PVA solution, an appropriate amount of PVA was dissolved in 10 ml of de-ionized water and the solution was stirred for 2 h at room temperature.

2.3. Preparation of (Ni(CH3COO)2·4H2O) solution

1 M Ni(CH3COO)2·4H2O solution was added into 0.3 ml glacial acetic acid and magnetically stirred at room temperature. The glacial acetic acid was added to improve the conductivity of the electrospinning solution.

2.4. Preparation of (Co(NO3)2·6H2O) solution

1 M Co(NO3)2·6H2O solution was added into 0.3 ml glacial acetic acid and stirred at room temperature.

2.5. Preparation of PVA/(Co(NO3)2·6H2O)/(Ni(CH3COO)2·4H2O) and PVA/(Ni(CH3COO)2·4H2O) solution

The equal quantities of 1 M Co(NO3)2·6H2O and 1 M Ni(CH3COO)2·4H2O solution were magnetically stirred for 30 min and one part of the Co(NO3)2·6H2O/Ni(CH3COO)2·4H2O solution was gradually added to the two parts of PVA solution and magnetically stirred for 30 min at room temperature to obtain a homogeneous solution. The PVA/Ni(CH3COO)2·4H2O solution was prepared according to the same method.

2.6. Fabrication of electrospun nanofiber matrix

The prepared PVA/Co(NO3)2·6H2O/Ni(CH3COO)2·4H2O or PVA/Ni(CH3COO)2·4H2O solution was transferred to the syringe. The distance from the needle to the drum collector was fixed at 18 cm and a voltage of 20 kV was applied to the tip of the nozzle. The flow rate of the syringe pump was set at 0.5 ml h−1. The nanofibers were collected on the rotating drum collector set at a speed of 800 to 900 rpm. The electrospun nanofiber membrane was then collected and annealed in a muffle furnace to obtain the Co3O4/NiO composite nanofibers. The electrospun nanofiber membrane was annealed to 500 °C at a controlled rate of 2 °C min−1 and the slow heating rate is critical to the proper formation of Co3O4/NiO nanofibers. The similar method was used for the synthesis of bare NiO nanofibers.

2.7. Modification of electrode

Before the surface modification of glassy carbon electrode (GCE) (3 mm diameter), GCE was surface polished with 1.0, 0.3 and 0.05 μm alumina powder and then washed with de-ionized water, followed by sonication in ethanol and deionized water and dried at room temperature. The prepared nanofibers (2 mg ml−1) were dispersed in a mixture of 0.02 ml Nafion and 0.18 ml DMF and the mixture was sonicated for 60 min to obtain a homogeneous dispersion. Then 10 μl of the mixture was dropped onto the surface of polished GCE and dried at room temperature. The NiO and Co3O4/NiO nanofibers modified GCEs are represented as NiO/GCE and Co3O4/NiO/GCE, respectively.

2.8. Characterizations

The surface morphologies and average diameter of the nanofibers were investigated with a Field Emission-Scanning Electron Microscope (FE-SEM, FEG Quanta 200, FEI) coupled with Energy Dispersive X-ray Spectroscopy analyzer (EDAX, Bruker) and Transmission Electron Microscope (TEM, JEOL 2010). The crystal structure of prepared nanofibers was investigated with a X-ray Diffractometer (XRD, Xpert Pro, Panalytical). The Fourier transform infrared (FT-IR) transmission spectra of prepared nanofibers were obtained by employing a BRUKER α-Alpha-T Spectrometer with a SiC radiation source. The UV-vis absorption spectra of prepared nanofibers were acquired by using Metrohm (Analytical-Specord-220) spectroscopy.

2.9. Electrochemical characterizations

The electrochemical behavior of synthesized nanofibers were investigated by using a three electrode system, which consisted of a GCE, Ag/AgCl (1 M KCl) and Pt wire as a working, reference and counter electrode, respectively. The electrochemical studies were carried out by using a CHI-650D electrochemical workstation at room temperature and the cyclic voltammograms (CV) and amperometric current responses were recorded by using the three electrode system. The electrocatalytic activity of modified electrodes was recorded in a solution containing 0.1 M NaOH at a scan rate of 20 mV s−1 in the absence and presence of 1 mM glucose by using cyclic voltammetry. The amperometric it measurements were carried out in a saturated 0.1 M NaOH solution with the successive addition of glucose solutions of different concentrations at an applied potential of 0.50 V vs. Ag/AgCl. The electroanalytical performances of six bare/modified GCEs realized under the same conditions were evaluated and all of the electroanalytical performances were repeated for 4 times on each bare/modified GCEs and the average values were reported.

3. Results and discussion

3.1. Morphological analysis

The surface morphological properties of PVA/Ni(CH3COO)2·4H2O, PVA/Ni(CH3COO)2·4H2O/Co(NO3)2·6H2O, NiO and Co3O4/NiO nanofibers are provided in Fig. 1. The as-spun PVA/Ni(CH3COO)2·4H2O (Fig. 1a) and PVA/Ni(CH3COO)2·4H2O/Co(NO3)2·6H2O nanofibers (Fig. 1b) exhibited smooth surfaces with the average fiber diameter of 325 nm and hundreds of micrometers in length. Even after the calcination process at 500 °C, the calcined samples maintained the nanofibrous morphologies. The average diameter of annealed fibers has shrunk to 160 nm for the bare NiO (Fig. 1c and d) and Co3O4/NiO nanofibers (Fig. 1e and f) and the reduction in the size of annealed nanofibers is attributed to the loss of polymer component during the annealing process. However, there were no significant changes observed in the length of prepared nanofibers. Furthermore, the smooth surface of fiber morphology was completely collapsed for the bare NiO (Fig. 1c and d) and Co3O4/NiO nanofibers (Fig. 1e and f), leading to the formation of a rough surface. The annealed nanofibers were composed of numerous nanograins with the relatively uniform distribution and average diameter of 25 nm. Both the bare NiO and Co3O4/NiO composite nanofibers exhibited a porous three dimensional network structure, which is expected to pave ways for the facile electron transportation for the excellent catalytic activity. The morphological properties of Co3O4/NiO composite nanofibers were further analyzed by using TEM (Fig. 1g) and it is clear that the resultant fibers are composed of uniformly interconnected nanoparticles with an average diameter of 25 nm and the strong interconnection among the nanoparticles constructed the nanofiber morphology.
image file: c5ra11739a-f1.tif
Fig. 1 SEM images of (a) as spun PVA/(Ni(CH3COO)2·4H2O) nanofibers, (b) as spun PVA/(Co(NO3)2·6H2O)/(Ni(CH3COO)2·4H2O) nanofibers, (c and d) annealed bare NiO nanofibers (e and f) annealed Co3O4/NiO composite nanofibers and (g) TEM image of annealed Co3O4/NiO composite nanofibers.

The existence of carbon and polymer residues in the nanofibers may interfere with the glucose sensing process. Hence, the aforementioned traces in bare NiO and Co3O4/NiO composite nanofibers were evaluated by using EDAX and the corresponding EDAX patterns are provided in Fig. 2. The presence of Ni and O elements in NiO nanofibers (Fig. 2a) and the existence of Ni, Co and O elements in Co3O4/NiO composite (Fig. 2b) ensured the chemical constituents of corresponding nanofibers. Although the traces of carbon were found in both the NiO and Co3O4/NiO composite nanofibers, the traces are present in low amounts and can be considered as negligible.


image file: c5ra11739a-f2.tif
Fig. 2 EDAX patterns of (a) bare NiO and (b) Co3O4/NiO composite nanofibers.

3.2. Structural analysis

The diffraction patterns of prepared nanofibers are provided in Fig. 3 and NiO nanofibers exhibited the characteristic diffraction peaks at 38.2, 43.8, 63.2, 75.8 and 79.3° (Fig. 3a), which represent the (111), (200), (220), (311) and (222), respectively, reflection planes of a face centered single phase cubic NiO with the Fm[3 with combining macron]m space group.31–33 The diffraction patterns of electrospun composite nanofibers showed the formation of two separate phases Co3O4 and NiO as illustrated in Fig. 3b and the reflection planes of Co3O4 and NiO correspond to the cubic crystal system with F[d with combining macron]3m (JCPDS no. 01-078-1969) and Fm[3 with combining macron]m space groups (JCPDS no. 01-071-1179), respectively.34,35 The peak broadening observed in the diffraction patterns specified the nanocrystalline structure of the grains in NiO and Co3O4/NiO composite nanofibers and the observed crystallite sizes are well matched with the morphological images. No other impurity phases observed from the XRD analysis ensured the structural purity of the prepared samples.
image file: c5ra11739a-f3.tif
Fig. 3 XRD patterns of (a) bare NiO and (b) Co3O4/NiO composite nanofibers.

The structural characterizations of NiO and Co3O4/NiO composite nanofibers were further evaluated by using FT-IR and the corresponding spectra are provided in Fig. 4. The formation of NiO nanofibers (Fig. 4a) were ensured from the characteristic Ni–O stretching bands observed at 424, 451, 480 and 502 cm−1.36–38 The spectrum corresponding to Co3O4/NiO composite nanofibers (Fig. 4b) exhibited all the Ni–O (420–500 cm−1) stretching vibrations along with the new additional bands at 565 and 658 cm−1. These additional bands correspond to the Co–O stretching vibrations of Co3+ and Co2+ present at the octahedral and tetrahedral sites of Co3O4 spinel, respectively.39,40


image file: c5ra11739a-f4.tif
Fig. 4 FT-IR spectra of pure (a) NiO and (b) Co3O4/NiO composite nanofibers.

The UV-vis spectroscopic analysis of NiO and Co3O4/NiO nanofibers were carried out over the wavelength of 200–800 nm and the obtained UV-vis spectra are shown in Fig. 5. A strong absorption band was observed at 320 nm (inset: Fig. 5a) for the NiO nanofibers, owing to the electronic transition from the valence band to the conduction band of NiO.41 The UV-vis spectrum correspond to Co3O4/NiO composite nanofibers (inset: Fig. 5b) exhibited a band at 320 nm, due to the Ni2+ transition. In addition, the two intra band transitions were observed in 700–850 nm and 450–600 nm ranges, which could be attributed to the lower and higher band gap charge transfer processes of Co3+ and Co2+ respectively.42 From the Tauc plot drawn for both the nanofibers, it is clear that the band gap of Co3O4/NiO composite nanofibers is reduced to 2.19 eV from that of bare NiO nanofibers (3.87 eV).


image file: c5ra11739a-f5.tif
Fig. 5 The optical band gap energy of (a) bare NiO (inset: UV-vis absorption spectrum of bare NiO nanofibers) and (b) Co3O4/NiO nanofibers (inset: UV-vis absorption spectrum of Co3O4/NiO nanofibers).

3.3. Electrochemical performances

The electrochemical performances of bare GCE, NiO/GCE and Co3O4/NiO/GCE were characterized by using CV technique in 0.1 M NaOH in the potential range of −0.2 to 0.65 V at a scan rate of 20 mV s−1 (Fig. 6a). The voltammograms obtained at bare GCE revealed that no noticeable redox behavior was observed, indicating that bare GCE was potentially silent under the alkaline medium. However, the well defined redox peaks were obtained at both Co3O4/NiO/GCE and NiO/GCE, owing to the presence of metal catalysts. The well-defined Ni2+/Ni3+ redox couple was obtained at NiO/GCE under an alkaline solution with the anodic (Epa) and cathodic (Epc) peak potential of +0.51 and +0.42 V vs. Ag/AgCl, respectively,43,44 indicating that the prepared NiO nanofibers exhibited significant electrocatalytic activity in the alkaline medium and the involved electrochemical reaction is prescribed as follows:
 
NiO + OH ↔ NiOOH + e (1)

image file: c5ra11739a-f6.tif
Fig. 6 CVs of (a) studied electrodes in 0.1 M NaOH at a scan rate of 20 mV s−1 and (b) Co3O4/NiO/GCE in 0.1 M NaOH as a function of scan rate ranging from 10 to 100 mV s−1 (inset: calibration plot of current vs. square root of scan rate).

The redox peak currents were further increased at Co3O4/NiO/GCE, owing to the higher catalytic activity of composite nanofibers through the synergetic effects of Co3O4 and NiO.45,46 The generation of complex species at Co3O4/NiO/GCE under alkaline conditions is identified from the Epa observed at 0.46 V vs. Ag/AgCl, which is intermediate between the NiO and Co3O4 anodic peak potentials. After the absorption of OH ions, both Ni2+ and Co2+ were transformed into Ni3+ and Co3+ respectively, and Co3+ was further oxidized into Co4+ at higher potentials. The Epc observed at 0.47 V vs. Ag/AgCl (Fig. 6a) is related with the reduction of Ni3+and Co4+ formed in the positive scan and the involved reactions at Co3O4/NiO/GCE are given below:

 
NiO + OH ↔ NiOOH + e (2)
 
Co3O4 + OH + H2O ↔ 3CoOOH + e (3)
 
CoOOH + OH ↔ CoO2 + H2O + e (4)

Fig. 6b shows the voltammograms of Co3O4/NiO/GCE obtained in 0.1 M NaOH as a function of scan rate. It is clear that the anodic and cathodic peak responses were enhanced with the increasing scan rates ranging from 10–100 mV s−1 in 0.1 M NaOH. The anodic and cathodic peaks were shifted to positive and negative values, respectively; with the corresponding increment in the scan rate. It is calculated that the Ip is proportional to the square root of scan rate with the high correlation coefficient (R) of 0.993 and 0.996 (inset: Fig. 6b) for Ipa and Ipc, respectively; indicating that a diffusion-controlled quasi-reversible electrochemical reaction was occurred at Co3O4/NiO/GCE.

3.4. Electrocatalytic oxidation of glucose at GCE, NiO/GCE and Co3O4/NiO/GCE

The electro-oxidation of glucose at bare GCE, NiO/GCE and Co3O4/NiO/GCE were examined by using CV technique under 1 mM glucose in 0.1 M NaOH at a scan rate of 20 mV s−1 and the obtained voltammograms are given in Fig. 7a. The bare GCE demonstrated negligible catalytic effects toward the glucose electro-oxidation in 0.1 M NaOH in the potential window from −0.2 to +0.65 V. However, NiO/GCE has exhibited the prompt Ipa of 47 μA at +0.53 V vs. Ag/AgCl, which is ascribed to the electro-oxidation of glucose. It is well established that the observed Ipa is attributed to the electro-oxidation of glucose with the participation of Ni3+ centres in 0.1 M NaOH solution and the involved electrochemical reaction is given as follows:
 
2NiOOH + glucose → 2NiO + gluconolactone + H2O (5)

image file: c5ra11739a-f7.tif
Fig. 7 (a) CVs of studied electrodes under the presence of 1 mM glucose in 0.1 M NaOH at a scan rate of 20 mV s−1 and (b) mechanism proposed for the electrocatalytic oxidation of glucose at Co3O4/NiO nanofibers.

The electrooxidation of glucose was further enhanced at Co3O4/NiO/GCE as evidenced from the increased Ipa of 74 μA at 0.47 V vs. Ag/AgCl, indicating the irreversible maximum electrooxidation of glucose. The increased Ipa and positively shifted Epa at Co3O4/NiO/GCE than that of NiO/GCE are purely attributed to the effective participation of Ni3+/Co4+ centers of composite nanofibers generated at an alkaline medium.47 The high porosity and well inter-connected nanofibers were observed for the Co3O4/NiO nanofibers. The free mobility of electrons throughout the length of nanofibers and extended number of electron transfer tunnels increased the delocalization of charges that enhanced the conductivity of prepared Co3O4/NiO composite nanofibers. The cavities among the nanofibers and high porosity on the individual nanofibers facilitated the rapid adsorption and followed by the efficient diffusion of an analyte glucose. The highly adsorbed glucose allowed the access of analytes to the catalytic active sites and facilitated the intimate contact between them with the minimal diffusion resistance. When the analyte glucose was rapidly diffused into the surface of electrode, it is oxidized in to gluconolactone by the participation of Ni3+/Co4+ centres at Co3O4/NiO/GCE, leading to the increased Ipa under an alkaline solution. The increased electrooxidation of glucose observed at Co3O4/NiO/GCE is ascribed to the synergetic effects of Co3O4 and NiO nanostructures that promoted the electrical conductivity and number of active sites. By the collective efforts afforded by the nanofibers and composite technologies, the maximum electrooxidation of glucose was observed at Co3O4/NiO/GCE and the involved reaction mechanism is schematically illustrated in Fig. 7b.

Fig. 8a depicts the CVs of Co3O4/NiO/GCE using different concentration of glucose in 0.1 M NaOH at a scan rate of 20 mV s−1. The addition of glucose from 1 to 4 mM caused the obvious increase of Ipa with increasing glucose concentration without the potential shift. This phenomenon indicates the irreversible electrocatalysis of glucose under the positive scan and the catalytic conversion of Ni3+ and Co4+ to Ni2+ and Co3+, respectively, under the negative scan. This result has exhibited the excellent electrocatalytic ability of Co3O4/NiO/GCE in glucose oxidation and guarantees its amperometric glucose sensor applications.


image file: c5ra11739a-f8.tif
Fig. 8 Cyclic voltammograms of (a) Co3O4/NiO/GCE as a function of glucose concentration in 0.1 M NaOH at a scan rate of 20 mV s−1 and (b) Co3O4/NiO/GCE in 1 mM glucose in 0.1 M NaOH as a function of scan rate ranging from 10 to 100 mV s−1 (inset: calibration plot of current vs. square root of scan rate).

Furthermore, the electrokinetics involved in Co3O4/NiO/GCE was evaluated through different scan rates. Fig. 8b depicts the CVs of Co3O4/NiO/GCE at different scan rates (10–100 mV s−1) using 1 mM glucose in 0.1 M NaOH. The Epa and Epc were slightly shifted to positive and negative values, respectively, with the corresponding increase in the scan rates. Moreover, the obtained Ipa and Ipc were linearly correlated to the square root of scan rates (inset: Fig. 8b) with the high correlation coefficient (R) of 0.992 (Ipa) and 0.995 (Ipc) respectively, implying that the reaction is a typical diffusion controlled electrochemical process.

3.5. Amperometric detection of glucose at Co3O4/NiO/GCE

Amperometric analysis is an extremely attractive technique, which is reflected by their fast response time toward the oxidation of glucose in the electrochemical sensor applications to evaluate the high sensitivity and detection limit toward glucose. The amperometric study was carried at Co3O4/NiO/GCE with the successive step-wise addition of different concentrations of glucose in 0.1 M NaOH at an applied potential of 0.5 V vs. Ag/AgCl (Fig. 9a). When the different concentration of glucose was added at a regular time intervals of 50 s into the alkaline medium, a rapid current increment was observed. The fast response and well-defined steady-state current response of non-enzymatic glucose sensor response toward glucose were observed. The steady state current has reached a fast response time of 6 s, owing to the excellent electrocatalytic activity, number of active sites, good electron mobility properties and inter connective network of Co3O4/NiO nanofibers. Fig. 9b shows the calibration curve of the electrochemical response of Co3O4/NiO/GCE, which exhibited a wide linear range of glucose concentrations ranging from 1 μM to 9.055 mM with a high correlation coefficient of 0.998 (n = 28). The fabricated Co3O4/NiO/GCE exhibited the rapid response time, lower detection limit and high sensitivity of 6 s, 0.17 μM (S/N = 3) and 2477 μA mM−1 cm−2, respectively. The obtained high sensitivity and low detection limit have been ascribed to the excellent electrocatalytic activity of the as-prepared Co3O4/NiO nanofibers. The highly porous and three dimensional uniform network of Co3O4/NiO nanofibers exhibited the large number of active sites. The porous three dimensional network has also permitted the easy access of glucose to the electrocatalytic active sites with the minimal diffusion resistance. The Co3O4/NiO nanofibers showed superior electrocatalytic activity toward non-enzymatic glucose sensing in comparison with the previous literatures as given in Table 1.48–59
image file: c5ra11739a-f9.tif
Fig. 9 (a) Amperometric it responses of Co3O4/NiO/GCE with the successive addition of different concentrations of glucose in 0.1 M NaOH solution at an applied potential of 0.5 V vs. Ag/AgCl (inset: magnified amperometric responses of Co3O4/NiO/GCE at initial time) and (b) calibration plot of Co3O4/NiO/GCE amperometric responses as a function of glucose concentration.
Table 1 Comparison of the electrochemical performances of non-precious metal and metal oxide based nanostructures based non-enzymatic glucose sensors
Electrode material Sensitivity (μA mM−1 cm−2) Linear range (μM) LODa (μM) Reference
a Limit of detection.b Multi-walled carbon nanotubes.c Nanofibers.d Ordered mesoporous carbon.e Nanowire arrays.f Nanotubes arrays.g Single-walled carbon nanotubes.h Nanoparticles.i Straight multi-walled carbon nanotubes.
NiO/MWCNTsb 1768.8 10–7000 2 48
CuO NFsc 431.3 6–2500 0.8 49
NiO/OMCd 834.8 2–1000 0.65 50
NiO/C 582.6 up to 2600 2 51
Ni NWAse 1043 0.5–7000 0.1 52
Ni–Cu/TiO2NTsf 1590.9 10–3200 5 53
Pt/Ni NWAse 920 2–2000 1.5 54
NiO–SWCNTg 907 1–1000 0.3 55
Ni NPh/SMWNTsi 1438 1–1000 0.5 56
Co3O4 NFsc 36.25 up to 2040 0.97 57
Ni NPh/TiO2NTsf 700.2 4–4800 2 58
Ni foam 50–7350 2.2 59
Co3O4/NiO NFsc 2477 1–9055 0.17 This work


3.6. Stability and reproducibility studies

To investigate the reproducibility of proposed system, six Co3O4/NiO/GCEs were fabricated under the similar conditions and CV experiments were performed under the presence of 1 mM glucose. For a series of Co3O4/NiO/GCEs, a relative standard deviation (RSD) of 3.32% was observed, specifying the good reproducibility of fabricated sensors. The fabricated sensor's operational stability was also monitored through the electro-oxidation of glucose for every 2 days for 30 days and Co3O4/NiO/GCE was stored at inverted beaker at room temperature. It was found that the Co3O4/NiO/GCE retained about 94.8% of its original response to glucose oxidation after a month of storage, which indicates the good stability of the fabricated sensor system.

3.7. Interference studies

Interference test is the most significant technique in analytical methods, owing to the capability to distinguish the interfering species from the analyte, which have same physiological environment in the biosensor. U, UA, AA, DA, AP and NaCl are commonly used interfering species in the non-enzymatic electrochemical glucose sensors. Fig. 10 reveals the amperometric response at Co3O4/NiO/GCE toward the addition of 1 mM glucose and 1 mM interfering species such as U, UA, AA, DA, AP and NaCl in 0.1 M NaOH at an applied potential of 0.5 V vs. Ag/AgCl. It is clear that Co3O4/NiO/GCE has not exhibited any appreciable current response toward U, UA, AA, AP and NaCl. Although Co3O4/NiO/GCE has exhibited a minimal current response toward DA, the obtained current response is negligible in comparison with glucose. Thus the proposed sensor is accountable for good selectivity toward the detection of glucose.
image file: c5ra11739a-f10.tif
Fig. 10 Selectivity study of Co3O4/NiO/GCE with the successive addition of 1 mM glucose (G), U, UA, AA, DA, AP and NaCl in 0.1 M NaOH at an applied potential of 0.5 V vs. Ag/AgCl.

3.8. Real sample analysis

The control of diabetic related diseases is purely dependent upon the tight monitoring of glucose in blood serum. Hence, the practical applicability of fabricated Co3O4/NiO/GCE was evaluated with the 20 μl of human blood serum in 10 ml of 0.1 M NaOH (pH-13) solution and its amperometric current responses were monitored at an applied potential of 0.5 V vs. Ag/AgCl. The known concentrations of glucose were successively added into the blood serum and its corresponding electrochemical responses were noticed. The fabricated sensor exhibited an excellent recovery in the range of 97–104% with the 2.67–3.36% relative standard deviation (Table 2), which guaranteed the potential applications of proposed system in real samples.
Table 2 Determination of glucose concentrations in human serum samples at Co3O4/NiO/GCE
Sample Glucose added (μM) Glucose found (μM) RSDa (%) Recovery (%)
a Relative standard deviation.
1 5 5.2 2.67 104.00
2 10 9.7 3.22 97.00
3 15 15.3 2.85 102.00
4 20 19.6 3.17 98.00
5 25 25.4 3.36 101.60


The commercially available glucose monitoring systems are available at a cost of 60 to 100 US$, which additionally requires the enzyme coated strips for evaluating the blood glucose levels and a strip costs between 0.45 to 1.0 US$. Diabetic patients, who are prescribed insulin, need to check their blood glucose levels anywhere between 3 to 10 times in a day; constructing the blood glucose monitoring an expensive affair.60 In contrast, the non-enzymatic sensor reported in this study requires approximately 30 μg of Co3O4/NiO nanofibers and the maximum cost of the synthesis of nanofibers including high purity materials, electricity costs for electrospinning and calcination processes furnish a grand total of 0.15 US$ per strip and the fabricated system can be reused for a couple of times without a drop in performance, which construct the feasible applications of proposed sensors at a large scale.

4. Conclusion

The three dimensional network of Co3O4/NiO composite nanofibers were synthesized via electrospinning and subsequent annealing processes. The electrospun nanofibers were highly porous, inter-connected and homogeneously distributed as seen from the morphological analysis and the prepared nanofibers were successively evaluated for its suitability as the non-enzymatic glucose sensor probes by using cyclic voltammetry and amperometric techniques. Co3O4/NiO composite exhibited the superior electrooxidation toward glucose than that of bare NiO nanofibers and exhibited high sensitivity, wide linear range with low detection limit and has not been affected by the interferences. It has also demonstrated the high stability, excellent reproducibility and real sample analysis applications. The good analytical performance, low cost and facile preparation technique of the prepared electrospun composite Co3O4/NiO nanofibers paved the ways for simple, effective and highly sensitive glucose biosensors. The fundamental issues provided in this report will be useful for the construction of on-site glucose sensors and thereby the diabetes can be controlled for the benefit of a healthy society.

Acknowledgements

This work was supported by Council of Scientific and Industrial Research (CSIR), New Delhi, India, major Project Grant No. 02(0060)/12/EMR-II.

References

  1. S. Melmed, K. S. Polonsky, P. R. Larsen and H. M. Kronenberg, Williams textbook of endocrinology, Elsevier, 12th edn, 2012, p. 1371 Search PubMed.
  2. S. P. Nichols, A. Koh, W. L. Storm, J. H. Shin and M. H. Schoenfisch, Chem. Rev., 2013, 113, 2528 CrossRef CAS PubMed.
  3. G. Wang, X. He, L. Wang, A. Gu, Y. Huang, B. Fang, B. Geng and X. Zhang, Microchim. Acta, 2013, 180, 161 CrossRef CAS.
  4. X. Kang, Z. Mai, X. Zou, P. Cai and J. Mo, Anal. Biochem., 2007, 363, 143 CrossRef CAS PubMed.
  5. X. Li, Q. Zhu, S. Tong, W. Wang and W. Song, Sens. Actuators, B, 2009, 136, 444 CrossRef CAS PubMed.
  6. M. Morikawa, N. Kimizuka, M. Yoshihara and T. Endo, Chem.–Eur. J., 2002, 8, 5580 CrossRef CAS.
  7. J. C. Pickup, F. Hussain, N. D. Evans, O. J. Rolinski and D. J. S. Birch, Biosens. Bioelectron., 2005, 20, 2555 CrossRef CAS PubMed.
  8. S. Mansouri and J. S. Schultz, Nat. Biotech., 1984, 2, 885 CrossRef CAS PubMed.
  9. D. Feng, F. Wang and Z. Chen, Sens. Actuators, B, 2009, 138, 539 CrossRef CAS PubMed.
  10. X. Kang, Z. Mai, X. Zou, P. Cai and J. Mo, Anal. Biochem., 2007, 363, 143 CrossRef CAS PubMed.
  11. Y. Bai, W. Yang, Y. Sun and Y. Sun, Sens. Actuators, B, 2008, 134, 471 CrossRef CAS PubMed.
  12. S. Park, H. Boo and T. D. Chung, Anal. Chim. Acta, 2006, 556, 46 CrossRef CAS PubMed.
  13. M. Jia, T. Wang, F. Liang and J. Hu, Electroanalysis, 2012, 24, 1864 CrossRef CAS PubMed.
  14. Y. Zhang, L. Su, D. Manuzzi, H. V. E. Monteros, W. Jia, D. Huo, C. Hou and Y. Lei, Biosens. Bioelectron., 2012, 31, 426 CrossRef CAS PubMed.
  15. C. Xia and W. Ning, Electrochem. Commun., 2010, 12, 1581 CrossRef CAS PubMed.
  16. J. Wang, L. Wang, J. Di and Y. Tu, Sens. Actuators, B, 2008, 135, 283 CrossRef CAS PubMed.
  17. F. Cao, S. Guo, H. Ma, G. Yang, S. Yang and J. Gong, Talanta, 2011, 86, 214 CrossRef CAS PubMed.
  18. A. Sun, J. Zheng and Q. Sheng, Electrochim. Acta, 2012, 65, 64 CrossRef CAS PubMed.
  19. B. Yuan, C. Xu, D. Deng, Y. Xing, L. Liu, H. Pang and D. Zhang, Electrochim. Acta, 2013, 88, 708 CrossRef CAS PubMed.
  20. S. Liu, B. Yu and T. Zhang, Electrochim. Acta, 2013, 102, 104 CrossRef CAS PubMed.
  21. J. Song, L. Xu, R. Xing, W. Qin, Q. Dai and H. Song, Sens. Actuators, B, 2013, 182, 675 CrossRef CAS PubMed.
  22. L. Q. Qin, L. Y. Ming and L. J. Hong, Chinese Sci. Bull., 2012, 57, 4195 CrossRef.
  23. C. W. Kung, C. Y. Lin, Y. H. Lai, R. Vittal and K. C. Ho, Biosens. Bioelectron., 2011, 27, 125 CrossRef CAS PubMed.
  24. C. Guo, X. Zhang, H. Huo, C. Xu and X. Han, Analyst, 2013, 138, 6727 RSC.
  25. X. Y. Lang, H. Y. Fu, C. Hou, G. F. Han, P. Yang, Y. B. Liu and Q. Jiang, Nat. Commun., 2013, 4, 2169 Search PubMed.
  26. N. Senthilkumar, K. J. Babu, G. G. Kumar, A. R. Kim and D. J. Yoo, Ind. Eng. Chem. Res., 2014, 53, 10347 CrossRef CAS.
  27. P. Gibson, H. S. Gibson and D. Rivin, Colloids Surf., A, 2001, 187–188, 469 CrossRef CAS.
  28. N. Bhardwaj and S. C. Kundu, Biotechnol. Adv., 2010, 28, 325 CrossRef CAS PubMed.
  29. A. Greiner and J. H. Wendorff, Angew. Chem., Int. Ed., 2007, 46, 5670 CrossRef CAS PubMed.
  30. D. Sabba, S. Agarwala, S. S. Pramana and S. Mhaisalkar, Nanoscale Res. Lett., 2014, 9, 14 CrossRef PubMed.
  31. X. Su, J. Ren, X. Meng, X. Ren and F. Tang, Analyst, 2013, 138, 1459 RSC.
  32. S. Vijayakumar, S. Nagamuthu and G. Muralidharan, ACS Appl. Mater. Interfaces, 2013, 5, 2188 CAS.
  33. S. I. Kim, J. S. Lee, H. J. Ahn, H. K. Song and J. H. Jang, ACS Appl. Mater. Interfaces, 2013, 5, 1596 CAS.
  34. A. M. A. Enizil, A. A. Elzatahry, A. R. I. Soliman and S. S. A. Theyab, Int. J. Electrochem. Sci., 2012, 7, 12646 Search PubMed.
  35. D. Malwal and P. Gopinath, Environ. Sci.: Nano, 2015, 2, 78 RSC.
  36. P. S. Patil and L. D. Kadam, Appl. Surf. Sci., 2002, 199, 211 CrossRef CAS.
  37. N. Dharmaraj, P. Prabu, S. Nagarajan, C. H. Kimb, J. H. Park and H. Y. Kimb, Mat. Sci. Eng B, 2006, 128, 111 CrossRef CAS PubMed.
  38. Y. Wang, J. Zhu, X. Yang, L. Lu and X. Wang, Thermochim. Acta, 2005, 437, 106 CrossRef CAS PubMed.
  39. C. Nethravathi, S. Sen, N. Ravishankar, M. Rajamathi, C. Pietzonka and B. Harbrecht, J. Phys. Chem. B, 2005, 109, 11468 CrossRef CAS PubMed.
  40. Z. P. Xu and H. C. Zeng, J. Mater. Chem., 1998, 8, 2499 RSC.
  41. L. Wu, Y. Wu, H. Wei, Y. Shi and C. Hu, Mater. Lett., 2004, 58, 2700 CrossRef CAS PubMed.
  42. S. K. Meher and G. R. Rao, J. Phys. Chem. C, 2011, 115, 25543 CAS.
  43. Y. Mu, D. L. Jia, Y. Y. He, Y. Q. Miao and H. L. Wu, Biosens. Bioelectron., 2011, 26, 2948 CrossRef CAS PubMed.
  44. X. H. Niu, M. B. Lan, H. L. Zhao and C. Chen, Anal. Chem., 2013, 85, 3561 CrossRef CAS PubMed.
  45. K. Wang, Z. Zhang, X. Shi, H. Wang, Y. Lu and X. Ma, RSC Adv., 2015, 5, 1943 RSC.
  46. J. B. Wu, Z. G. Li, X. H. Huang and Y. Lin, J. Power Sources, 2013, 224, 1 CrossRef CAS PubMed.
  47. K. Xu, R. Zou, W. Li, Y. Xue, G. Song, Q. Liu, X. Liu and J. Hu, J. Mater. Chem. A, 2013, 1, 9107 CAS.
  48. W. D. Zhang, J. Chen, L. C. Jiang, Y. X. Yu and J. Q. Zhang, Microchim. Acta, 2010, 168, 259 CrossRef CAS.
  49. W. Wang, L. Zhang, S. Tong, X. Li and W. Song, Biosens. Bioelectron., 2009, 25, 708 CrossRef CAS PubMed.
  50. L. Luo, F. Li, L. Zhu, Y. Ding, Z. Zhang, D. Deng and B. Lu, Colloids Surf., B, 2013, 102, 307 CrossRef CAS PubMed.
  51. X. Li, A. Hu, J. Jiang, R. Ding, J. Liu and X. Huang, J. Solid State Chem., 2011, 184, 2738 CrossRef CAS PubMed.
  52. L. M. Lu, L. Zhang, F. L. Qu, H. X. Lu, X. B. Zhang, Z. S. Wu, S. Y. Huan, Q. A. Wang, G. L. Shen and R. Q. Yu, Biosens. Bioelectron., 2009, 25, 218 CrossRef CAS PubMed.
  53. X. Li, J. Yao, F. Liu, H. He, M. Zhou, N. Mao, P. Xiao and Y. Zhang, Sens. Actuators, B, 2013, 181, 501 CrossRef CAS PubMed.
  54. S. S. Mahshid, S. Mahshid, A. Dolati, M. Ghorbani, L. Yang, S. Luo and Q. Cai, Electrochim. Acta, 2011, 58, 551 CrossRef CAS PubMed.
  55. N. Q. Dung, D. Patil, H. Jung, J. Kim and D. Kim, Sens. Actuators, B, 2013, 183, 381 CrossRef PubMed.
  56. H. Nie, Z. Yao, X. Zhou, Z. Yang and S. Huang, Biosens. Bioelectron., 2011, 30, 28 CrossRef CAS PubMed.
  57. Y. Ding, Y. Wang, L. Su, M. Bellagamba, H. Zhang and Y. Lei, Biosens. Bioelectron., 2010, 26, 542 CrossRef CAS PubMed.
  58. S. Yu, X. Peng, G. Cao, M. Zhoa, L. Qiao, J. Yao and H. He, Electrochim. Acta, 2012, 76, 512 CrossRef CAS PubMed.
  59. W. Lu, X. Qin, A. M. Asiri, A. O. A. Youbi and X. Sun, Analyst, 2013, 138, 417 RSC.
  60. S. F. Clarke and J. R. Foster, Brit. J. Biomed. Sci., 2012, 69, 83 CAS.

This journal is © The Royal Society of Chemistry 2015
Click here to see how this site uses Cookies. View our privacy policy here.