 Open Access Article
Creative Commons Attribution 3.0 Unported Licence
Direct synthesis of Cu-BDC frameworks on a quartz crystal microresonator and their application to studies of n-hexane adsorption†
Changyong
Yim
and
Sangmin
Jeon
*
Department of Chemical Engineering, Pohang University of Science and Technology (POSTECH), Pohang, Gyeongbuk, Republic of Korea. E-mail: jeons@postech.ac.kr
First published on 31st July 2015
Abstract
We developed a facile route for synthesizing Cu-BDC frameworks using metallic copper as a metal ion source. A thin film of copper was vacuum deposited onto a quartz crystal microresonator (QCM) and converted to Cu-BDC frameworks via a solvothermal reaction. The initially superhydrophilic Cu-BDC surface became superhydrophobic upon being treated with octadecyltrichlorosilane (ODTS). Exposure of the Cu-BDC-coated quartz crystal microresonator (CuBDC-QCM) to various concentrations of n-hexane vapor induced changes in the resonance frequency and Q factor of the resonator that were related to the adsorbed mass of n-hexane and the modulus of the Cu-BDC layer, respectively. The mass of n-hexane vapor adsorbed on the superhydrophobic Cu-BDC layer was found to be three times that on the superhydrophilic Cu-BDC layer. Furthermore, the adsorption of n-hexane on the superhydrophobic Cu-BDC layer induced an increase in the modulus of the framework whereas the adsorption on the superhydrophilic layer induced a decrease in the modulus of the framework. These opposite changes were attributed to differences in the binding sites of n-hexane vapor inside the framework.
Introduction
Metal–organic frameworks (MOFs) are organic–inorganic hybrid crystalline materials containing central metal ions linked by organic ligands. MOFs have attracted much attention due to their wide range of potential applications such as gas storage,1 gas separation,2 catalysts,3 and chemical sensors.4 MOFs are generally synthesized by a solvothermal reaction method: metal ions and organic linkers are dissolved in organic solvents and heated in an autoclave to produce the MOFs. Although it is straightforward to produce crystalline MOF granules in quantity by using the solvothermal reaction method, it is not easy to fabricate a thin film of MOFs on solid substrates to endow conventional surfaces with novel functions. Liquid phase epitaxy methods may be used to grow MOF films on solid substrates but the synthesis process is time consuming and labor intensive.5,6This problem may be overcome by patterning a thin film of metal or metal oxide on a substrate and by using this film as the metal ion source to produce MOFs. Specifically, the dissolution of a metal film or a metal ion film produces metal ions, which are coordinated by organic linkers under solvothermal reaction conditions to produce the MOF.7–13 However, it is quite challenging to characterize the gas adsorption properties of the MOF thin films because conventional methods, which measure changes in pressure or electrical properties during gas adsorption, cannot be used here due to the insufficient amount of sample or the nonconductive nature of MOF films.14–16 In contrast to the conventional methods, nanomechanical gravimetric sensors such as microcantilevers and quartz crystal microresonators (QCMs) are sensitive to changes in mass, especially on the sensor surface.12,13,17–19 Their resonance frequencies decrease with the increasing mass of the adsorbed gas molecules.
Although both QCMs and microcantilevers are sensitive to changes in mass, conventional silicon microcantilevers have been found to be unsuitable for the characterization of MOFs; microcantilevers are thin (∼1 μm) and may bend too much when MOFs are directly grown on their surfaces. Such a problem is not serious for QCMs because the thickness of a 5 MHz quartz crystal is ∼300 μm.20 Hesketh and Kitagawa synthesized MOFs on QCMs using a conventional method and measured the resonance frequency changes during the adsorption or desorption of various gases.21–24 However, they did not measure the change in the quality factor (Q factor, i.e., the ratio of the energy stored to the energy dissipated during vibration) of the quartz crystals during gas adsorption. Note that the change in Q factor is directly associated with the change in the mechanical properties of the MOF film.
In the present study, we deposited a thin film of copper on a quartz substrate and converted the copper film to Cu-BDC framework nanostructures by using this film as the metal ion source. The surface of the Cu-BDC layer-grown quartz crystal microresonator (CuBDC-QCM) was treated with octadecyltrichlorosilane (ODTS) to change the Cu-BDC layer from superhydrophilic to superhydrophobic. To investigate the gas adsorption properties of the Cu-BDC layer, CuBDC-QCMs were exposed to various concentrations of n-hexane vapors, and changes in the resonance frequency and Q factor were measured simultaneously. n-Hexane, which is used as a cleaning solvent in electronic industries, has received great attention because of its potentially hazardous nature, and for this reason was selected as the target gas in this study. This study presents the first report of the direct synthesis of a Cu-BDC layer from a metallic copper film and its application for investigating the adsorption of n-hexane vapor using QCMs.
Experimental
Materials
Benzene-1,4-dicarboxylic acid (BDC, terephthalic acid), ODTS, ethanol, toluene, and polystyrene (MW = 100![[thin space (1/6-em)]](https://www.rsc.org/images/entities/char_2009.gif) 000 g mol−1) were purchased from Sigma-Aldrich and used without further purification. Deionized water (18.3 MΩ cm) was obtained from a reverse osmosis water system (Human Science, Korea). The 5 MHz quartz crystals (1.27 cm in diameter) with gold electrodes were purchased from ICM (Oklahoma City, OK).
000 g mol−1) were purchased from Sigma-Aldrich and used without further purification. Deionized water (18.3 MΩ cm) was obtained from a reverse osmosis water system (Human Science, Korea). The 5 MHz quartz crystals (1.27 cm in diameter) with gold electrodes were purchased from ICM (Oklahoma City, OK).
Synthesis of Cu-BDC on a silicon wafer and quartz resonator
Circular patterns of Ti adhesion layers (10 nm) and Cu layers (300 nm) were sequentially deposited on a silicon wafer, as well as on a quartz resonator, using thermal evaporation under a pressure of 3 × 10⁻⁶ Torr. After cleaning the Cu-deposited substrates with UV irradiation, they were rinsed with deionized water and ethanol several times. The Cu-deposited substrates were immersed in 0.05, 0.5, 1, or 3 mM BDC solutions in a 1![[thin space (1/6-em)]](https://www.rsc.org/images/entities/char_2009.gif) :
:![[thin space (1/6-em)]](https://www.rsc.org/images/entities/char_2009.gif) 1 mixture of water and ethanol (20 mL), and Cu-BDC films were synthesized solvothermally on the substrates at 200 °C for 1 h in an autoclave. Cu-BDC-grown substrates were rinsed with ethanol to remove the unreacted organic linkers, and then dried under nitrogen flow. The Cu-BDC-grown silicon wafer (CuBDC-Si) was used for thermogravimetric analysis (TGA) and to generate the X-ray diffraction (XRD) patterns and scanning electron microscopy (SEM) images whereas the CuBDC-QCM was used for gas adsorption measurements. To modify the surface wettability of the Cu-BDC layers, the CuBDC-QCM was treated with a 10 mM ODTS solution in toluene for 3 h.
1 mixture of water and ethanol (20 mL), and Cu-BDC films were synthesized solvothermally on the substrates at 200 °C for 1 h in an autoclave. Cu-BDC-grown substrates were rinsed with ethanol to remove the unreacted organic linkers, and then dried under nitrogen flow. The Cu-BDC-grown silicon wafer (CuBDC-Si) was used for thermogravimetric analysis (TGA) and to generate the X-ray diffraction (XRD) patterns and scanning electron microscopy (SEM) images whereas the CuBDC-QCM was used for gas adsorption measurements. To modify the surface wettability of the Cu-BDC layers, the CuBDC-QCM was treated with a 10 mM ODTS solution in toluene for 3 h.
Characterization
The morphology and thickness of the Cu-BDC layer were investigated by field-emission scanning electron microscopy (FE-SEM, JEOL). The water contact angle on the Cu-BDC surface was measured by using SmartDrop (Femtofab, Korea). The crystalline structures of the Cu-BDC powder synthesized by the conventional method and the CuBDC-Si were characterized by XRD measurements using an M18XMF (Mac Science) diffractometer with Cu Kα radiation (λ = 1.542 Å). The TGA profile for the Cu-BDC powders was obtained using STA 449C (NETZSCH) under nitrogen atmosphere (see Fig. S1 in the ESI†).Instrument set-up for n-hexane vapor adsorption measurements
After the CuBDC-QCM was mounted in a temperature-controlled flow cell, changes in the resonance frequency and Q factor were measured simultaneously as a function of n-hexane vapor concentration at 25 °C (see Fig. S2 in the ESI†). Dry nitrogen was used as a carrier gas and passed through a gas bubbler containing n-hexane to generate vapor. The n-hexane vapor concentration was adjusted by combining an n-hexane vapor stream with a dry nitrogen stream. The flow rate of each stream was controlled using mass flow controllers (Brooks Instruments, Hatfield, PA) and the total flow rate was fixed at 100 mL min−1. The resonance frequency and Q factor of the QCMs were monitored using an impedance analyzer (QCM Z500, KSV Instruments Inc., Finland).Results and discussion
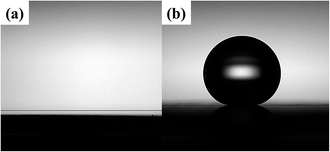
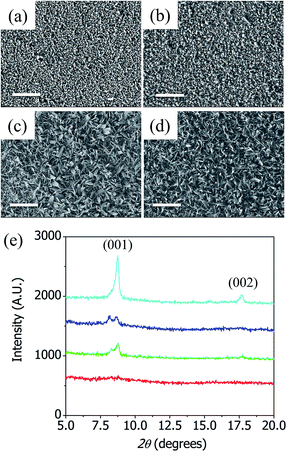
Fig. 1(a–d) show the SEM images of the chemical compounds synthesized on copper-coated silicon wafers using different concentrations of BDC. The average size of the Cu-BDC framework nanostructure increased as the BDC concentration increased, which made the Cu-BDC surface rougher. Fig. 1(e) shows XRD patterns of the CuBDC-Si synthesized using various concentrations of BDC. No peak was observed for the compounds synthesized on the silicon wafer at a low concentration of BDC (0.05 mM) whereas two distinct peaks appeared at a high concentration of BDC (3 mM), at 7.8° and 17.6°, which correspond, respectively, to the (001) and (002) peaks of the Cu-BDC frameworks obtained by the liquid epitaxy method.6 The growth of the Cu-BDC crystal on the copper film was affected by the dissolution rate of the metallic copper. The protons from the carboxylic acids groups in BDC dissolved the copper film and produced copper ions, which reacted with BDC to form the Cu-BDC layer on the substrate. The slow dissolution of the copper film limited the supply of copper ions for the framework and made the crystal grow with preferential orientations with respect to the substrate. The average size of the Cu-BDC nanocrystallites (3 mM) of CuBDC-Si was calculated using the Scherrer equation to be ∼30 nm, which is consistent with the thickness of Cu-BDC nanorods (see Fig. S3 in ESI†) and indicates that the Cu-BDC synthesized on a silicon wafer was highly crystalline.As-synthesized CuBDC-QCM (3 mM BDC) was observed to be superhydrophilic but CuBDC-QCM can be easily made superhydrophobic by treating it with ODTS.25Fig. 2(a) and (b) show optical microscopy images of 5 μL of water placed on as-synthesized CuBDC-QCM and ODTS-treated CuBDC-QCM, respectively. The water contact angles measured at four different locations of each substrate were found to be ∼0° for the as-synthesized CuBDC-QCM (superhydrophilic) and 170° ± 1.2° for the ODTS-treated CuBDC-QCM (superhydrophobic). These different surface properties affect the adsorption of gas molecules onto the Cu-BDC layer, which can be used to modulate the gas adsorption kinetics or gas storage capacities.
 | ||
| Fig. 2 Optical microscopy images of a drop of water on (a) the superhydrophilic Cu-BDC layer and (b) the superhydrophobic Cu-BDC layer. | ||
The gas adsorption kinetics and storage capacities of the superhydrophilic and superhydrophobic Cu-BDC layers were measured in situ by monitoring changes in the resonance frequency. Exposure of the CuBDC-QCMs to various concentrations of n-hexane vapor induced a change in the resonance frequency (Δf), which is directly related to the mass of the adsorbed gas (Δm) according to the Sauerbrey equation:18
 | (1) |
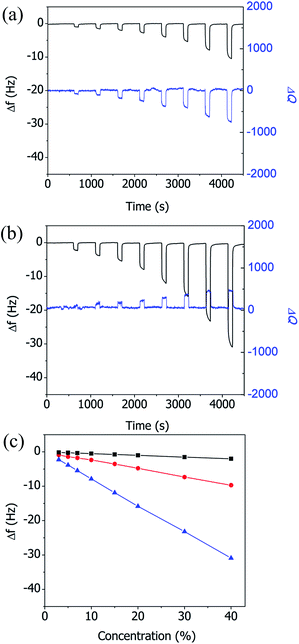
Fig. 3(a) shows changes in the resonance frequency (Δf) and Q factor (ΔQ) of the superhydrophilic CuBDC-QCM as a function of n-hexane vapor concentration. The concentration of n-hexane vapor was varied sequentially as follows: 3%, 5%, 7%, 10%, 15%, 20%, 30%, and 40%. After each exposure of the quartz crystal to n-hexane vapor, the flow cell was rinsed with dry nitrogen to remove the adsorbed n-hexane vapor from the Cu-BDC layer. The change in the resonance frequency of the quartz crystal increased as the concentration of n-hexane vapor was increased, due to the increase in the mass of n-hexane adsorbed on the Cu-BDC layer. The changes in the Q factor of the quartz crystals were measured simultaneously with the changes in the resonance frequency. As with the resonance frequency, the change in the Q factor increased as the concentration of n-hexane vapor was increased, which indicates that the modulus of the superhydrophilic Cu-BDC layer decreased due to the adsorption of n-hexane vapor.
In contrast, exposure of the superhydrophobic CuBDC-QCM to n-hexane vapor induced an increase in the Q factor (Fig. 3(b)). The increase in the Q factor implies that the modulus of the hydrophobic Cu-BDC layer increased as n-hexane was adsorbed. The n-hexane binds to the hydrophobic benzene group in the backbone of superhydrophilic Cu-BDC, making the framework soft. However, n-hexane prefers to bind to the alkyl chains (ODTS) in the superhydrophobic Cu-BDC via hydrophobic interaction,26 which induced an increase in the stiffness of the porous film by bridging the elements of the framework. Fig. 3(c) compares the resonance frequencies of the superhydrophilic CuBDC-QCM and the superhydrophobic CuBDC-QCM as a function of the n-hexane vapor concentration. The superhydrophobic CuBDC-QCM produced frequency changes (−0.78 Hz/%) that were three times the changes measured in the superhydrophilic CuBDC-QCM (−0.25 Hz/%), indicating that the gas storage capacity was three times increased after hydrophobic treatment. These changes appear to have been solely induced by the vapor adsorption on the Cu-BDC layer, since a control experiment using the uncoated QCM showed nearly negligible changes in frequency and Q factor (not shown here) upon exposure to the series of increasing concentrations of n-hexane vapor.
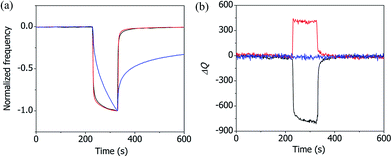
Fig. 4(a) shows how the normalized resonance frequency of the superhydrophilic CuBDC-QCM and the superhydrophobic CuBDC-QCM changed during the adsorption and desorption of 40% n-hexane vapor. A control experiment was conducted using the polystyrene film-coated QCM (PS-QCM) to compare the adsorption and desorption kinetics of n-hexane vapor on different substrates. The PS film was spin-casted on a quartz crystal microresonator and the film thickness was measured to be 80 nm. In contrast to the fast adsorption and desorption kinetics of n-hexane on the Cu-BDC layers, much slower adsorption and desorption kinetics were observed on the PS film (see Fig. S4 in the ESI† for the complete adsorption–desorption curve of the PS-QCM). The fast adsorption and desorption kinetics on the superhydrophilic and superhydrophobic Cu-BDC layers were attributed to the presence of three-dimensionally interconnected pores, which facilitate the transport of gas into the films. Fig. 4(b) shows how the Q factor of the superhydrophilic CuBDC-QCM, the superhydrophobic CuBDC-QCM, and the PS-QCM changed during the adsorption and desorption of 40% n-hexane vapor. In contrast to the relatively large responses in the Q factors of the porous CuBDC-QCMs to n-hexane vapor, the Q factor of the dense PS-QCM remained nearly unchanged. This result supports the hypothesis that the change in the modulus of the Cu-BDC layer is associated with the change in the pore structure due to the n-hexane adsorption.27,28
Conclusions
We synthesized Cu-BDC layers directly on copper film-coated quartz crystal microresonators by using the copper film as a metal ion source. The Cu-BDC layer changed from being superhydrophilic to superhydrophobic upon treating the surface of the as-synthesized Cu-BDC layer with ODTS. After the CuBDC-QCMs were exposed to various concentrations of n-hexane vapor, changes in the resonance frequency and Q factor of the resonator were measured simultaneously. The resonance frequency change of n-hexane vapor adsorbed on the superhydrophobic Cu-BDC layers was found to be three times that on the superhydrophilic Cu-BDC layers, which indicates that the gas storage capacity of this material could be increased by simple chemical modifications. It was also found that the integration of MOF films with QCMs was useful to investigate the gas adsorption-induced changes in the modulus of the MOF films, which had never been studied until now due to the lack of appropriate methods.Acknowledgements
This work was supported by the National Research Foundation of Korea (NRF) grant funded by the Korea government (MSIP) (No. 2014R1A2A2A01007027).References
- Y. He, W. Zhou, G. Qian and B. Chen, Chem. Soc. Rev., 2014, 43, 5657–5678 RSC
.
- J.-R. Li, J. Sculley and H.-C. Zhou, Chem. Rev., 2012, 112, 869–932 CrossRef CAS PubMed
.
- J. Liu, L. Chen, H. Cui, J. Zhang, L. Zhang and C.-Y. Su, Chem. Soc. Rev., 2014, 43, 6011–6061 RSC
.
- L. E. Kreno, K. Leong, O. K. Farha, M. Allendorf, R. P. Van Duyne and J. T. Hupp, Chem. Rev., 2012, 112, 1105–1125 CrossRef CAS PubMed
.
- O. Shekhah, J. Liu, R. A. Fischer and C. Wöll, Chem. Soc. Rev., 2011, 40, 1081–1106 RSC
.
- J. Liu, B. Lukose, O. Shekhah, H. K. Arslan, P. Weidler, H. Gliemann, S. Bräse, S. Grosjean, A. Godt, X. Feng, K. Müllen, I.-B. Magdau, T. Heine and C. Wöll, Sci. Rep., 2012, 2, 921 Search PubMed
.
- Y. Zhang, Q. Gao, Z. Lin, T. Zhang, J. Xu, Y. Tan, W. Tian and L. Jiang, Sci. Rep., 2014, 4, 4947 Search PubMed
.
- K. Khaletskaya, S. Turner, M. Tu, S. Wannapaiboon, A. Schneemann, R. Meyer, A. Ludwig, G. Van Tendeloo and R. A. Fischer, Adv. Funct. Mater., 2014, 24, 4804–4811 CrossRef CAS
.
- K. Okada, R. Ricco, Y. Tokudome, M. J. Styles, A. J. Hill, M. Takahashi and P. Falcaro, Adv. Funct. Mater., 2013, 24, 1969–1977 CrossRef
.
- Y. Yue, N. Mehio, A. J. Binder and S. Dai, CrystEngComm, 2015, 17, 1728–1735 RSC
.
- I. Stassen, N. Campagnol, J. Fransaer, P. Vereecken, D. De Vos and R. Ameloot, CrystEngComm, 2013, 15, 9308 RSC
.
- C. Yim, M. Lee, W. Kim, S. Lee, G.-H. Kim, K. T. Kim and S. Jeon, Chem. Commun., 2015, 51, 6168–6171 RSC
.
- C. Yim, M. Lee, M. Yun, G.-H. Kim, K. T. Kim and S. Jeon, Sci. Rep., 2015, 5, 10674 CrossRef CAS PubMed
.
- P. Mishra, S. Edubilli, B. Mandal and S. Gumma, Microporous Mesoporous Mater., 2013, 169, 75–80 CrossRef CAS
.
- E. D. Bloch, W. L. Queen, R. Krishna, J. M. Zadrozny, C. M. Brown and J. R. Long, Science, 2012, 335, 1606–1610 CrossRef CAS PubMed
.
- E. J. García, J. P. S. Mowat, P. A. Wright, J. Pérez-Pellitero, C. Jallut and G. D. Pirngruber, J. Phys. Chem. C, 2012, 116, 26636–26648 Search PubMed
.
- T. Thundat, E. A. Wachter, S. L. Sharp and R. J. Warmack, Appl. Phys. Lett., 1995, 66, 1695 CrossRef CAS
.
- G. Sauerbrey, Z. Phys., 1959, 155, 206–222 CrossRef CAS
.
- C. Yim, M. Yun, N. Jung and S. Jeon, Anal. Chem., 2012, 84, 8179–8183 CrossRef CAS PubMed
.
- M. C. Dixon, J. Biomol. Tech., 2008, 19, 151 Search PubMed
.
- A. Venkatasubramanian, M. Navaei, K. R. Bagnall, K. C. McCarley, S. Nair and P. J. Hesketh, J. Phys. Chem. C, 2012, 116, 15313–15321 CAS
.
- M. Tsotsalas, P. Hejcik, K. Sumida, Z. Kalay, S. Furukawa and S. Kitagawa, J. Am. Chem. Soc., 2013, 135, 4608–4611 CrossRef CAS PubMed
.
- K. Hirai, K. Sumida, M. Meilikhov, N. Louvain, M. Nakahama, H. Uehara, S. Kitagawa and S. Furukawa, J. Mater. Chem. C, 2014, 2, 3336–3344 RSC
.
- H. Uehara, S. Diring, S. Furukawa, Z. Kalay, M. Tsotsalas, M. Nakahama, K. Hirai, M. Kondo, O. Sakata and S. Kitagawa, J. Am. Chem. Soc., 2011, 133, 11932–11935 CrossRef CAS PubMed
.
- H. K. Arslan, O. Shekhah, D. C. F. Wieland, M. Paulus, C. Sternemann, M. A. Schroer, S. Tiemeyer, M. Tolan, R. A. Fischer and C. Wöll, J. Am. Chem. Soc., 2011, 133, 8158–8161 CrossRef CAS PubMed
.
- D. Sebők, E. Csapó, N. Ábrahám and I. Dékány, Appl. Surf. Sci., 2015, 333, 48–53 CrossRef
.
- C. Serre, S. Bourrelly, A. Vimont, N. A. Ramsahye, G. Maurin, P. L. Llewellyn, M. Daturi, Y. Filinchuk, O. Leynaud, P. Barnes and G. Férey, Adv. Mater., 2007, 19, 2246–2251 CrossRef CAS
.
- A. U. Ortiz, A. Boutin, A. H. Fuchs and F.-X. Coudert, Phys. Rev. Lett., 2012, 109, 195502 CrossRef PubMed
.
Footnote |
| † Electronic supplementary information (ESI) available: TGA data of Cu-BDC powders synthesized using the conventional method and Cu-BDC powders obtained from CuBDC-Si, a schematic diagram of instrument set-up, side-view SEM images of Cu-BDC layers grown on silicon wafers using different concentrations of BDC, and variations in the normalized resonance frequency of superhydrophilic CuBDC-QCM, superhydrophobic CuBDC-QCM and PS-QCM during the adsorption and desorption of 40% n-hexane vapor are included. See DOI: 10.1039/c5ra11686d |
| This journal is © The Royal Society of Chemistry 2015 |


