A prelithiated lithium vanadate anode and the mass balancing of its hybrid capacitor

Hao-Yu Wei, Dah-Shyang Tsai* and Chung-Lung Hsieh
Department of Chemical Engineering, National Taiwan University of Science and Technology, 43, Keelung Road, Section 4, Taipei 10607, Taiwan. E-mail: dstsai@mail.ntust.edu.tw

Received 18th June 2015 , Accepted 29th July 2015

First published on 30th July 2015


Abstract

The electrode of sol–gel derived Li3VO4 (LVO), which exhibits a capacity of 2 mol lithium between 0.01 and 2.0 V (vs. Li/Li+), is studied as an anode of the capacitor in conjunction with a cathode of activated carbon (AC). Before assembling the hybrid capacitor of AC/LVO, Li3VO4 has been prelithiated. The end potential of prelithiation affects the lithium loading and the resultant cell capacity. The cell, with LVO prelithiation ending at 0.5 V (vs. Li/Li+), displays 34% more capacity than the other with LVO ending at 2.0 V (vs. Li/Li+). The higher capacity is caused by reducing the electrode potential of the hybrid capacitor at 0% state-of-charge, which also depends on the AC[thin space (1/6-em)]:[thin space (1/6-em)]LVO mass ratio and the specific current. We develop a scheme to estimate the optimal mass ratio for the capacitor. The optimal ratio is verified later by galvanostatic charge–discharge experiments, involving four capacitors with AC[thin space (1/6-em)]:[thin space (1/6-em)]LVO mass ratios of 0.5[thin space (1/6-em)]:[thin space (1/6-em)]1, 1[thin space (1/6-em)]:[thin space (1/6-em)]1, 2[thin space (1/6-em)]:[thin space (1/6-em)]1, 3[thin space (1/6-em)]:[thin space (1/6-em)]1. The optimal 2[thin space (1/6-em)]:[thin space (1/6-em)]1 cell demonstrates a capacity of specific energy 49.1 W h kg−1 at 0.05 A g−1 and 3.5 V, and 81% retention in the voltage hold test persisting for 100 h.

Introduction

The capacity of an electrochemical capacitor can be upgraded through hybridizing its electrostatic storage mechanism with the battery storage mechanism. The charge transfer reactions of lithium batteries are viewed as ideal candidates in complementing the double layer capacitance because of their swift character.1–4 The high storage capacity of battery electrode may originate from one of the three processes: lithium intercalation of carbonaceous materials,5,6 insertion reactions of oxide materials,7,8 or alloying reactions with tin or silicon metal.9–11 Although usually described as diffusion phenomena, these energetic processes involve bond breaking and formation. Their associated energy barriers mean that cycling operations are met with considerable resistance,12 in contrast to the small resistance of double-layer electricity storage.

One of the popular hybridizations is the series design of lithium ion hybrid capacitors (LIHCs), which allow either the negative or the positive electrode to assume the battery type of charge storage. LIHCs, with a negative battery electrode, are superior to those with a positive battery electrode in terms of energy and power performance.13 Their success is mainly attributed to a high cell voltage (4.0 V) and an ample supply of electrolyte lithium via a lithiated anode.14–16 Thus, lithiated graphite,17–20 soft carbons,21,22 and hard carbons14,16,23,24 have been exploited as the anode. Several ways have been developed to modify the lithiation technique.16,25,26

Lithium vanadates could serve as excellent storage materials, since they tolerate a wide potential window and exhibit a higher volumetric capacity in comparison with graphite.27,28 One of the candidates is Li3VO4 (LVO), which crystallizes in an orthorhombic structure, space group Pmn21, with the lattice parameters a = 0.6326 nm, b = 0.5446 nm, c = 0.4947 nm, and is isotypical to βII phase Li3PO4. The LVO structure can be viewed as hexagonal close-packed oxygen anions along the [100] direction, balanced by lithium and vanadium cations. Its polyhedron model may be described as corner-shared lithium and vanadium tetrahedra, LiO4 and VO4, stacked alternatively.29,30 LVO of the βII phase can accommodate plenty of extra lithium.

Recently, a few research groups have fabricated carbon composite anodes of LVO and studied their battery applications.30–33 In this study, we synthesize LVO nanoparticles using the citric-acid gel method and prepare several half cells to investigate the storage capabilities of the LVO electrode and activated carbon (AC) electrode. A calculation scheme is devised to estimate the adequate mass balancing with known capacities of the LVO and AC electrodes. Accordingly, capacitor cells of various mass ratios are assembled to test the prediction and study the energy storage capacity and cycle stability.

Experimental

LVO powder synthesis

Stoichiometric amounts of Li2CO3 (0.01575 mol, 5% in excess, Aldrich) and V2O5 (0.005 mol, ACROS) were weighed and dissolved, along with citric acid (0.06 mol, ACROS), in a beaker that contained 1.0 M ∼50 ml nitric acid (Panreac). As the mixture turned into a transparent blue solution, the beaker temperature was gradually increased to 70 °C with slow stirring until the solution became a gel. The gel precursor was placed in a furnace and calcined at 400 or 500 °C for 6 h in air. The calcined LVO powder was pulverized with an agate mortar and pestle, mixed with Super P carbon black (TIMCAL) in a weight ratio 95[thin space (1/6-em)]:[thin space (1/6-em)]5 and ball milled for 10 h. We labeled the resulting powder as LVO-g, which was a raw material in electrode preparation.

Electrode preparation

The dry LVO electrode contained 80 wt% LVO-g, 10 wt% Super P, and 10 wt% PVdF binder (Aldrich). To fabricate the LVO electrode, the abovementioned ingredients were blended with a suitable amount of 1-methyl-2-pyrrolidinone (NMP, ACROS) to form a slurry, which was subsequently vacuumed to remove trapped bubbles and a fraction of NMP. The slurry was then dispersed on a polished copper current collector of 2 cm in diameter and dried at 80 °C in an oven for 6 h. After drying, the porous active material was pressed to improve contact among solid particles, and its mass was recorded as the weight difference between the dry LVO electrode and the copper disk. The AC electrode was prepared similarly, through dispersing the slurry of activated carbon on top of a polished and etched aluminum thin disk of 2 cm in diameter, then drying and uniaxial pressing. The AC slurry contained 80 wt% activated carbon (YP-80F, Kuraray Chemical), 10 wt% Super P, and 10 wt% PVdF binder in NMP solvent.

The LVO and the AC electrodes were placed in an argon-filled glove box (GB-100, SunRay Science) and soaked in the electrolyte for ∼10 h to wet their porous interfaces thoroughly. The glove box was equipped with a load lock vacuum chamber and a gas circulating and purifying system to keep oxygen and water less than 1 ppm. The electrolyte was 1.0 M LiPF6 in ethylene carbonate (EC) and dimethyl carbonate (DMC) solution (50[thin space (1/6-em)]:[thin space (1/6-em)]50 by volume, LB-301, Zhangjiagang Guotai-Huarong).

Cell assembly and measurement

The electrodes of LVO and AC were initially tested in half-cell configurations using a lithium metal foil (2 cm in diameter, 99.9%, Alfa Aesa) as the counter electrode, a small piece of lithium metal as the reference, and the LVO (or AC) electrode as the working electrode. Two layers of 25 μm thick porous polypropylene film (Celgard 2500) were used as the separator. The half cells were assembled in an electrochemical test cell (SC-Basic, MikroMasch) under argon atmosphere with a 20-newton spring force clamping the half-cell assembly. Cyclic voltammetries (CV) were performed with a potentiostat (Workstation 5000, Jiehan). In the case of LVO electrode, the CV measurements were carried out in the potential range from 3.0 to 0.01 V (vs. Li/Li+) at 0.2 mV s−1. For the AC electrode, the CV currents were recorded in three potential ranges of 2.5–3.8, 2.5–4.0, 2.5–4.2 V (vs. Li/Li+) with various sweep rates. The lithiation and de-lithiation capacities of LVO were also measured in five galvanostatic charge/discharge cycles at 0.25 C (0.05 A g−1) between 2.0 and 0.01 V (vs. Li/Li+).

Four capacitor cells were assembled in two-electrode configuration with AC[thin space (1/6-em)]:[thin space (1/6-em)]LVO mass ratios of 0.5[thin space (1/6-em)]:[thin space (1/6-em)]1, 1[thin space (1/6-em)]:[thin space (1/6-em)]1, 2[thin space (1/6-em)]:[thin space (1/6-em)]1, and 3[thin space (1/6-em)]:[thin space (1/6-em)]1 in the MikroMasch cell. The LVO electrode was designated as the negative electrode (anode) and the AC electrode as the positive (cathode). The mass loadings of the AC and LVO electrodes were 0.8 and 1.6 mg cm−2 in the 0.5[thin space (1/6-em)]:[thin space (1/6-em)]1 cell, 1.5 and 1.5 mg cm−2 in the 1[thin space (1/6-em)]:[thin space (1/6-em)]1 cell, 3.0 and 1.5 mg cm−2 in the 2[thin space (1/6-em)]:[thin space (1/6-em)]1 cell, 4.4 and 1.5 mg cm−2 in the 3[thin space (1/6-em)]:[thin space (1/6-em)]1 cell, respectively. The thickness of the AC electrode, after uniaxial pressing, was 13 (0.8 mg cm−2), 25 (1.5 mg cm−2), 48 (3.0 mg cm−2), and 72 μm (4.4 mg cm−2). The thickness of the LVO electrode was 20 μm. The electrolyte and separator of the capacitor cell were the same as those of the half cells described earlier, but the LVO electrode was prelithiated. Prelithiation was performed using the half-cell configuration of the Li/LVO cell before assembling the AC/LVO cell. The LVO electrode experienced 5 cycles between 2.0 and 0.1 V (vs. Li/Li+) at 0.05 A g−1 (0.25 C), and the cycling ended at 0.5 V (vs. Li/Li+). After prelithiation, the MikroMasch cell was disassembled under argon. The lithium foil, its current collector, and the separator were taken out of the test cell. A new separator and the AC electrode were substituted, and the test cell was clamped again under the spring force with the addition of a few drops of electrolyte. For comparison purposes, prelithiation of one LVO electrode was carried out, setting the end potential of 2.0 V instead of 0.5 V (vs. Li/Li+). This LVO electrode was used in assembling a capacitor with the AC[thin space (1/6-em)]:[thin space (1/6-em)]LVO mass ratio 2[thin space (1/6-em)]:[thin space (1/6-em)]1.

Galvanostatic tests of the four AC/LVO capacitors were operated with the anode potential being monitored during cycling in the voltage window (ΔU), 3.0 or 3.5 V, using a multichannel potentiostat (1470E, Solartron). With the knowledge of cell voltage and anode potential, the cathode potential was calculated. These electrode potential data were taken after several cycles at the specific current in the preset voltage window and were analyzed to understand the roles of the electrode during charge/discharge.

Materials characterization

Crystalline phases of calcined LVO powder were analyzed with an X-ray diffractometer (D2 Phaser, Bruker), equipped with a CuKα radiation source and nickel filter. The crystallite size was estimated with the Scherrer formula, 0.9λ/B[thin space (1/6-em)]cos[thin space (1/6-em)]θ, in which λ is the wavelength (0.15406 nm) and B is the full width at half maximum (FWHM) of the diffraction line at Bragg angle θ. Nitrogen adsorption and desorption isotherms of YP-80F were measured with a surface-area and pore-size analyzer (ASAP2020, ASAP2010, Micromeritics).

Results and discussion

LVO nanocrystals and the electrodes

The diffraction pattern of 400 °C fired Li3VO4 powder is plotted in Fig. 1. These diffraction lines are indexed to an orthorhombic unit cell with the fitted parameters a = 0.6316 nm, b = 0.5441 nm, c = 0.4945 nm. The crystallite size of 400 °C Li3VO4 powder is estimated as 47 nm, using the FWHM value of its strongest diffraction line (101), at 2θ = 22.88°. If the firing temperature is raised to 500 °C, the pattern looks similar, but the diffraction peaks sharpen and the crystallite size grows to 52 nm. In this study, the 400 °C fired powder is used exclusively in the measurements.
image file: c5ra11664c-f1.tif
Fig. 1 X-ray diffraction result for Li3VO4 nanocrystals. The pulverized LVO powder was calcined at 400 °C for 6 h, and its diffraction pattern contrasts with the orthorhombic Li3VO4 standard file JCPDS 039-0378.

Fig. 2 presents the surface area analysis results of YP-80F carbon and cyclic voltammograms of the AC electrode. The nitrogen adsorption and desorption isotherms for YP-80F are shown in Fig. 2a. When the relative pressure (P/P0) increases from 1.6 × 10⁻⁶ to 0.3, the cumulative adsorbed gas volume reaches 690 cm3 g−1, and the adsorption completed 87.7% of its total adsorption volume 787 cm3 g−1. Evidently, YP-80F is a microporous AC with a small fraction of mesopores, showing the type-I isotherm. The hysteresis between relative pressure 0.4 and 1.0 indicates that the mesopores are featured with an ink-bottle pore shape. The BET plot, as shown in the inset, reports the adsorbed quantity of one monolayer, resulting in a surface area of 2344 m2 g−1. This value approximates the upper limit of the quoted surface area of the manufacturer, 1900–2300 m2 g−1.


image file: c5ra11664c-f2.tif
Fig. 2 Surface area analysis of AC and double layer capacitance of the AC electrode. (a) 77 K nitrogen isotherms of YP-80F AC and the inset of BET plot based on adsorption isotherm. (b) AC voltammograms measured in a Li/AC half cell at 1, 5, 10, 25, 50, 100, 200, 500 mV s−1. (c) The AC capacitance values at various sweep rates in 2.5–3.8 V, 2.5–4.0 V, and 2.5–4.2 V (vs. Li/Li+).

Fig. 2b shows voltammograms of the AC electrode with various sweep rates in the potential range between 2.5 and 4.0 V (vs. Li/Li+). These rectangular-shaped voltammograms display distinctive features of double layer capacitance. Based on these CV results, we calculate the capacitance values according to the following equation, QCV/2(mACΔV), where QCV is the sum of anodic and cathodic charge, mAC is the mass of activated carbon, and ΔV is the scanned potential range. Fig. 2c summarizes these capacitance values in three scanned potential ranges, showing the maximum capacitance of 74–160 F g−1 at 1.0 mV s−1. In general, the capacitance of the AC electrode decreases as the sweep rate increases and increases with a wider scan window.

The capacity of the LVO electrode is reported in Fig. 3a, which shows lithiation and delithiation curves of LVO between 0.01 and 2.0 V (vs. Li/Li+) at 50 mA g−1. Ignoring the first lithiation trace, the other four lithiation curves demonstrate a slightly decreasing storage capacity, ∼400 mA h g−1, which is similar to the capacity reported by Ni and coworkers,30 somewhat higher than that of the CNT/LVO composite,31 but less than the values reported for the LVO/graphene composite32 and carbon coated LVO.33 The capacity of 400 mA h g−1 approximately equals two moles of lithium insertion, knowing that one mole lithium insertion corresponds to 197.4 mA h g−1 for Li3VO4. The delithiation capacity also decreases with increasing cycle number from 400 mA h g−1 to 348 mA h g−1. The potentials of lithiation and delithiation plateaus are marked in Fig. 3a.


image file: c5ra11664c-f3.tif
Fig. 3 Electrochemical characterization of the LVO electrode. (a) Five cycles of lithiation and delithiation at 50 mA g−1 (0.25 C) between 2.0 and 0.01 V (vs. Li/Li+) with the plateau potentials marked. (b) Five CV cycles of the LVO electrode at 0.2 mV s−1 between 3.0 and 0.01 V (vs. Li/Li+), noting the peak shifts.

Fig. 3b presents the first five CV cycles of the LVO electrode between 0.01 and 3.0 V (vs. Li/Li+). Consistent with the earlier result, the first cycle is distinctively different from the other four in the cathodic scans. Fig. 3b shows that the two cathodic peaks at 0.5 and 0.79 V of the first cycle shift to 0.55 and 0.90 V (vs. Li/Li+) in the latter cycles. The two anodic peaks at 1.3 and 2.6 V (vs. Li/Li+) exhibit no shifting in the anodic scans. Shifting in the cathodic peak positions may result from solid electrolyte interface (SEI) formation during lithiation.

LVO prelithiation

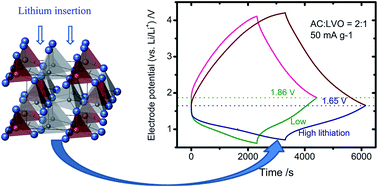
When matching with an AC electrode, the extra lithium loading of the LVO electrode decreases the potential value at 0% state-of-charge (U0% SOC) and draws more capacity out of the matching electrode. U0% SOC is defined as the potential value of the positive and negative electrodes when it begins to split during capacitor charging, as well as when they merge at the end of discharging during steady operation. The difference of two cells with different prelithiation levels is shown in Fig. 4. The two cells, with the same AC[thin space (1/6-em)]:[thin space (1/6-em)]LVO ratio of 2[thin space (1/6-em)]:[thin space (1/6-em)]1, are operated in ΔU = 3.5 V and 50 mA g−1. Fig. 4a shows that when the cell is equipped with a prelithiated LVO electrode ending at 2.0 V, U0% SOC is 1.86 V (vs. Li/Li+), higher than 1.65 V (vs. Li/Li+) of the cell equipped with a LVO electrode ending at 0.5 V, Fig. 4b. Referring to Fig. 3, we understand that the 0.5 V LVO electrode is richer in lithium than the 2.0 V LVO electrode, i.e., 1.42 mol more lithium per gram of LVO. This cell, equipped with a prelithiated anode ending at 0.5 V, begins charging at 1.65 V (vs. Li/Li+); moreover, its negative electrode potential is situated at a superior location in exploiting the LVO capacity, since this part of the lithiation curve is flatter compared to the location of 1.86 V (vs. Li/Li+). A flatter potential curve means the negative electrode utilizes a smaller fraction of voltage window; consequently, the positive AC electrode takes up a larger share of 3.5 V, resulting in a higher cell capacity. Fig. 4b shows that discharge of this cell with U0% SOC 1.65 V persists 2824 s at 50 mA g−1, longer than that of the cell with U0% SOC 1.86 V, which lasts 2097 s. The cell with U0% SOC 1.65 V demonstrates a 34% increase in capacity.
image file: c5ra11664c-f4.tif
Fig. 4 Effects of extra lithium in LVO on the capacitor with a 2[thin space (1/6-em)]:[thin space (1/6-em)]1 ratio. Cell voltage, positive, and negative electrode potentials are plotted against time in charge and discharge of an AC/LVO cell in 50 mA g−1 and 3.5 V, but their prelithiation differs, ending at (a) 2.0 V and (b) 0.5 V (vs. Li/Li+).

The electrode potentials of the two 2[thin space (1/6-em)]:[thin space (1/6-em)]1 cells provide more details on why their capacities differ. Fig. 4a shows an initial potential drop, 0.47 V (marked), in charging the negative electrode, larger than 0.26 V of Fig. 4b. This potential drop is undesirable or even wasteful, because only a very small quantity of electricity is stored during this sudden potential drop. In other words, the cell with a prelithiated anode ending at 0.5 V wastes a smaller fraction of voltage window, compared with the cell with a prelithiated anode ending at 2.0 V. With the same amount of AC loading, Fig. 4b shows a potential difference of 2.55 V on the positive electrode, less than 2.25 V of Fig. 4a. It means more charge accumulated at the positive AC electrode in Fig. 4b, which is attributed to the lower U0% SOC position due to extra loaded lithium at the anode. Hence, all the capacitors, discussed later, implement the prelithiated LVO electrode that ended at 0.5 V (vs. Li/Li+).

AC[thin space (1/6-em)]:[thin space (1/6-em)]LVO mass ratio

Knowing the individual electrode capacities, we can calculate the mass ratio for when the cell capacity reaches its maximum. The first step is to convert the LVO capacity in mA h g−1 into potential dependent capacitance F g−1, as illustrated in Fig. 5a. The negative electrode of the capacitor is assumed to perform just like the 200 mA g−1 lithiation curve of the fifth cycle between 0.5 and 2.0 V (vs. Li/Li+), as shown in the inset of Fig. 5a. The negative electrode capacitance (C) is calculated using eqn (1), when the LVO potential decreases from 2.0 V (U0) to a minimum potential (Umin).
 
image file: c5ra11664c-t1.tif(1)
in which Q is the accumulated charge when lithiation occurs between U0 and Umin. ΔU denotes the potential difference (U0Umin), I is the specific current, and Δt is the time span. When ΔU is less than 0.6 V, Fig. 5a indicates that the capacitance C increases slowly with increasing ΔU. When ΔU is increased over 0.6 V, the capacitance C increases sharply, since Umin enters the potential region of ample lithium storage. We further assume that the positive electrode of the capacitor behaves just like the 5 mV s−1 CV result of AC, because the anodic current of 5 mV s−1 CV is near 200 mA g−1, which is the specific current flowing through the negative electrode. The capacitance of the AC positive electrode is denoted as C+, 70.2 F g−1, marked in Fig. 5b. With known C+ and C, we calculate the cell capacitance of the AC/LVO capacitor, CLIHC, in various mass ratios, m+[thin space (1/6-em)]:[thin space (1/6-em)]m, using the following equation.
 
image file: c5ra11664c-t2.tif(2)

image file: c5ra11664c-f5.tif
Fig. 5 Estimation of the optimal AC[thin space (1/6-em)]:[thin space (1/6-em)]LVO ratio. (a) LVO electrode capacitance in F g−1 versus the potential difference of the negative electrode ΔU that starts at 2.0 V (vs. Li/Li+). The inset shows the lithiation curve at 200 mA g−1 of LVO electrode that this calculation is based on. (b) The AC capacitance being selected in calculating the optimal mass ratio. (c) Calculated values of the cell capacitance versus the AC[thin space (1/6-em)]:[thin space (1/6-em)]LVO mass ratio, based on eqn (2).

Fig. 5c presents the predicted values of cell capacitance, according to eqn (2). Three curves of CLIHC, assuming that ΔU equals 1.0, 1.25, or 1.5 V, climax at the m+[thin space (1/6-em)]:[thin space (1/6-em)]m ratio 2.0[thin space (1/6-em)]:[thin space (1/6-em)]1, 2.2[thin space (1/6-em)]:[thin space (1/6-em)]1, 2.4[thin space (1/6-em)]:[thin space (1/6-em)]1; individually. Evidently, the predicted m+[thin space (1/6-em)]:[thin space (1/6-em)]m ratio is not a precise value, because this ratio varies with ΔU, which varies with the specific current and voltage window of capacitor. Still it is reasonable to conclude that the maximum cell capacity is located near the 2[thin space (1/6-em)]:[thin space (1/6-em)]1 ratio.

We assemble four capacitors with AC[thin space (1/6-em)]:[thin space (1/6-em)]LVO ratios of 0.5[thin space (1/6-em)]:[thin space (1/6-em)]1, 1[thin space (1/6-em)]:[thin space (1/6-em)]1, 2[thin space (1/6-em)]:[thin space (1/6-em)]1, 3[thin space (1/6-em)]:[thin space (1/6-em)]1, to examine the calculation result. The voltage window is preset to be 3.5 V. The specific cell capacities, listed in Table 1, are 27.4 (0.5[thin space (1/6-em)]:[thin space (1/6-em)]1), 36.2 (1[thin space (1/6-em)]:[thin space (1/6-em)]1), 39.2 (2[thin space (1/6-em)]:[thin space (1/6-em)]1), and 26.8 (3[thin space (1/6-em)]:[thin space (1/6-em)]1) mA h g−1, confirming that 2[thin space (1/6-em)]:[thin space (1/6-em)]1 is the optimal mass ratio. Although the optimal ratio is correct, we note the dependence of cell capacity on the mass ratio is quite different from that of Fig. 5c. The experimental capacity of 3[thin space (1/6-em)]:[thin space (1/6-em)]1 cell is obviously too low. According to Fig. 5c, the capacity of the 3[thin space (1/6-em)]:[thin space (1/6-em)]1 cell is expected to be at least 40% higher than that of the 0.5[thin space (1/6-em)]:[thin space (1/6-em)]1 cell. Our assembled 0.5[thin space (1/6-em)]:[thin space (1/6-em)]1 and 3[thin space (1/6-em)]:[thin space (1/6-em)]1 cells have a nearly equal capacity. The cell capacities of ΔU = 3.0 V, not listed in Table 1, display the same trend.

Table 1 Cell capacities, U0% SOC (vs. Li/Li+), ΔU+ and ΔU of the cells with four AC[thin space (1/6-em)]:[thin space (1/6-em)]LVO mass ratios, operated at 50 mA g−1 in the voltage window ΔU = 3.5 V
AC[thin space (1/6-em)]:[thin space (1/6-em)]LVO 0.5[thin space (1/6-em)]:[thin space (1/6-em)]1 1[thin space (1/6-em)]:[thin space (1/6-em)]1 2[thin space (1/6-em)]:[thin space (1/6-em)]1 3[thin space (1/6-em)]:[thin space (1/6-em)]1
Cell capacity (mA h g−1) 27.4 36.2 39.2 26.8
U0% SOC (V) 1.34 1.38 1.65 1.95
ΔU+ (V) 3.00 2.70 2.55 2.10
ΔU (V) 0.50 0.80 0.95 1.40


Table 1 indicates the U0% SOC value is not a constant, and this potential value is strongly influenced by the AC[thin space (1/6-em)]:[thin space (1/6-em)]LVO mass ratio. Operated at 50 mA g−1, U0% SOC of 1.34 V for the 0.5[thin space (1/6-em)]:[thin space (1/6-em)]1 cell increases to 1.38 V for the 1[thin space (1/6-em)]:[thin space (1/6-em)]1 cell, further increases to 1.65 V for the 2[thin space (1/6-em)]:[thin space (1/6-em)]1 cell and 1.95 V (vs. Li/Li+) of the 3[thin space (1/6-em)]:[thin space (1/6-em)]1 cell. Moreover, the potential is also affected by the operating current for a particular AC[thin space (1/6-em)]:[thin space (1/6-em)]LVO ratio. Table 2 indicates that for the 2[thin space (1/6-em)]:[thin space (1/6-em)]1 cell, the U0% SOC value increases with increasing specific current; 1.65 V at 50 mA g−1 and 2.04 V (vs. Li/Li+) at 1.0 A g−1. For the 1[thin space (1/6-em)]:[thin space (1/6-em)]1 cell, the rising trend is less steep, varying from 1.38 V at 50 mA g−1 to 1.54 V (vs. Li/Li+) at 1.0 A g−1.

Table 2 Variations of U0% SOC (vs. Li/Li+) with respect to specific current for two capacitors with AC[thin space (1/6-em)]:[thin space (1/6-em)]LVO ratios of 2[thin space (1/6-em)]:[thin space (1/6-em)]1 and 1[thin space (1/6-em)]:[thin space (1/6-em)]1. Both cells are operated in ΔU = 3.5 V. The mass loadings are 1.5 (AC) and 1.5 (LVO) mg cm−2 in the 1[thin space (1/6-em)]:[thin space (1/6-em)]1 cell and 3.0 (AC) and 1.5 (LVO) mg cm−2 in the 2[thin space (1/6-em)]:[thin space (1/6-em)]1 cell. The electrode thickness is 25 (1.5 mg cm−2) and 48 (3.0 mg cm−2) μm for the AC electrode, and 20 μm for the LVO electrode
Current (mA g−1) 50 70 100 200 500 1000
U0% SOC (V) for 2[thin space (1/6-em)]:[thin space (1/6-em)]1 1.65 1.68 1.72 1.79 1.92 2.04
U0% SOC (V) for 1[thin space (1/6-em)]:[thin space (1/6-em)]1 1.38 1.38 1.38 1.39 1.45 1.54


Fig. 6 shows how the U0% SOC position affects the voltage partition of a capacitor with ΔU = 3.5 V and I = 50 mA g−1. We denote the difference between U0% SOC and the maximum positive potential as ΔU+, and the difference between U0% SOC and the minimum negative potential as ΔU. The sum of ΔU+ and ΔU equals the voltage window. For the 0.5[thin space (1/6-em)]:[thin space (1/6-em)]1 cell, Fig. 6a, the U0% SOC value is relatively low and the negative electrode exploits the most capacitive region of prelithiated LVO. Therefore, when ΔU is small, 0.5 V, ΔU+ occupies a major fraction of the voltage window, ΔU+ = 3.0 V. Evidently, the capacity of the positive electrode restricts the cell capacity because the positive electrode capacity is much less than that of the in-series negative electrode. When the AC[thin space (1/6-em)]:[thin space (1/6-em)]LVO ratio is increased to 1[thin space (1/6-em)]:[thin space (1/6-em)]1, ΔU+ decreases to 2.70 V and ΔU increases to 0.80 V, as shown in Fig. 6b; moreover, the cell capacity is improved. The AC capacity is still the limiting factor of cell capacity. Moreover, we note a subtle difference between Fig. 6a and b; a small drop in negative potential 0.06 V emerges in Fig. 6b, which cannot be found in Fig. 6a. Electrode potentials of the 2[thin space (1/6-em)]:[thin space (1/6-em)]1 cell have been plotted in Fig. 4b, showing a larger drop 0.26 V in the negative potential trace. Further increasing the AC[thin space (1/6-em)]:[thin space (1/6-em)]LVO ratio to 3[thin space (1/6-em)]:[thin space (1/6-em)]1, the drop increases to 0.55 V and the voltage partition becomes ΔU+ 2.1 V and ΔU 1.40 V. The abovementioned statement emphasizes again that the potential drop at the beginning of charging is a waste of the voltage window. Hence, the increasing potential drop with respect to increasing mass ratio means that the LVO electrode becomes less capacitive with increasing mass ratio. Consequently, a rising U0% SOC value produces a more rapid decline than the model predicts in cell capacity with respect to the increasing mass ratio.


image file: c5ra11664c-f6.tif
Fig. 6 Electrode potentials of the AC/LVO capacitors with three mass ratios. Cell voltage, positive and negative electrode potentials of the cell with AC[thin space (1/6-em)]:[thin space (1/6-em)]LVO = (a) 0.5[thin space (1/6-em)]:[thin space (1/6-em)]1; (b) 1[thin space (1/6-em)]:[thin space (1/6-em)]1; (c) 3[thin space (1/6-em)]:[thin space (1/6-em)]1 at 50 mA g−1. Note that the plot of the 2[thin space (1/6-em)]:[thin space (1/6-em)]1 cell has been shown in Fig. 4b. Values of ΔU+ and ΔU are marked, along with U0% SOC.

Energy, power, and stability

Fig. 7 presents the energy and power capacities of the 2[thin space (1/6-em)]:[thin space (1/6-em)]1 cell, operated in two voltage windows, 3.0 and 3.5 V. Values of specific energy (Ecell) and specific power (Pcell) are calculated with the following equations.
 
image file: c5ra11664c-t3.tif(3)
 
image file: c5ra11664c-t4.tif(4)
where I is the specific current based on the combined mass of the two electrodes; ti and tf are the start time and the end time of cell discharge; and U is the cell voltage. As expected, a wider voltage window stores more energy. The specific energy of Fig. 7b is generally higher than that of Fig. 7a at the same specific current. For example, at 50 mA g−1, the specific cell energy reaches 49.1 W h kg−1 with ΔU = 3.5 V, whereas the specific energy is 29.3 W h kg−1 with ΔU = 3.0 V. Because of the sluggish LVO electrode, the power of hybrid capacitor is often considered insufficient. One way to increase the power performance is lifting the cutoff voltage. When the cutoff voltage is increased to 1.0 V, instead of 0.01 V (practical zero), energy performance is traded for power performance. Fig. 7b shows that the specific energy and power are 49.1 W h kg−1 and 72.5 W kg−1, respectively, with cutoff voltage 0.01 V, and these become 40.9 W h kg−1 and 103.1 W kg−1 with a cutoff voltage of 1.0 V. On further lifting the cutoff voltage to 2.0 V, which results in an increase in power that costs too much energy reduction, the specific energy and power become 24.5 W h kg−1 and 129.7 W kg−1 at 50 mA g−1. A similar trade-off is shown in Fig. 7a.

image file: c5ra11664c-f7.tif
Fig. 7 Ragone plots of the AC/LVO capacitor with a 2[thin space (1/6-em)]:[thin space (1/6-em)]1 ratio. Specific energy values of the cell are plotted against specific power values, operated with (a) ΔU = 3.0 V and the cut-off voltage of 0.01, 1.0, 2.0 V; (b) ΔU = 3.5 V and the cut-off voltage of 0.01, 1.0, 2.0 V.

Fig. 8 shows the stability of this AC/LVO capacitor with a 2[thin space (1/6-em)]:[thin space (1/6-em)]1 mass ratio. We employ the voltage hold test, which has been described as more demanding than the uninterrupted cycling test.34,35 The cell voltage of the 2[thin space (1/6-em)]:[thin space (1/6-em)]1 cell is first held at 3.5 V for 4 h, then the cell charges and discharges at 200 mA g−1 in ΔU = 3.5 V. After 3 galvanostatic cycles, the cell voltage is held at 3.5 V for another 4 h. The procedure of holding at 3.5 V and cycling 3 times is repeated until the hold time totals up to 100 h. Fig. 8 shows the values of capacitance and coulombic efficiency, measured in the third cycle every 4 h. Initially, the cell capacitance is 28.8 F g−1, gradually decreases with the hold time down to 23.3 F g−1 at the end of 100 h, which is 81% retention in capacity. The coulombic efficiency maintains at 97–95% throughout the period. This stability performance is similar to that of a lithium ion capacitor made of prelithiated graphite, which shows 83% capacity retention after 100 h voltage hold.36 If the 2[thin space (1/6-em)]:[thin space (1/6-em)]1 cell of AC/LVO undergoes the voltage hold test in a wider window, 3.8 V, the cell capacitance decays much faster. After 100 h, the capacity loss is 37%. Hence, we conclude that 3.5 V is a suitable voltage window for the 2[thin space (1/6-em)]:[thin space (1/6-em)]1 cell, taking lifetime into consideration.


image file: c5ra11664c-f8.tif
Fig. 8 Stability of the AC/LVO cell with a 2[thin space (1/6-em)]:[thin space (1/6-em)]1 mass ratio. Variations of cell capacitance and coulombic efficiency during a 100 h voltage hold in ΔU = 3.5 V.

Conclusions

Nanometer sized LVO powder has been synthesized at 400 °C and investigated as the active material for a hybrid capacitor. Prelithiation of the LVO electrode has been conducted and ended at 0.5 V to load a sufficient amount of lithium ion in the LVO host. The preloaded lithium augments the storage capacity of LVO/AC by 34%. The optimal matching quantity of AC is approximately twice the amount of LVO. Unfortunately, the calculation scheme does not yield a more precise value because the U0% SOC value shifts with the AC[thin space (1/6-em)]:[thin space (1/6-em)]LVO ratio and the specific current considerably. The 2[thin space (1/6-em)]:[thin space (1/6-em)]1 cell shows a sufficient stability in ΔU = 3.5 V. It demonstrates large capacities at low specific currents, and resumes high power attributes of a capacitor at high specific currents.

Acknowledgements

This study is financially supported by the Ministry of Science and Technology of Taiwan through the project MOST-103-2221-E-011-153-MY3. The miscellaneous fees are paid through one of the Top University Projects 104H45140 via the National Taiwan University of Science and Technology.

References

  1. W. Cao, J. Zheng, D. Adams, T. Doung and J. P. Zheng, J. Electrochem. Soc., 2014, 161, A2087–A2092 CrossRef CAS.
  2. D. Cericola and R. Kotz, Electrochim. Acta, 2012, 71, 1–17 CrossRef.
  3. N. Omar, M. Daowd, O. Hegazy, M. Al Sakka, Th. Coosemans, P. van den Bossche and J. van Mierlo, Electrochim. Acta, 2012, 86, 305–315 CrossRef CAS.
  4. P. H. Smith, T. N. Tran, T. L. Jiang and J. Chung, J. Power Sources, 2013, 243, 982–992 CrossRef CAS.
  5. C. Decaux, G. Lota, E. Raymundo-Pinero, E. Frackowiak and F. Beguin, Electrochim. Acta, 2012, 86, 282–286 CrossRef CAS.
  6. M. S. Balogun, W. Qiu, W. Wang, P. Fang, X. Lu and Y. Tong, J. Mater. Chem. A, 2015, 3, 1364–1387 CAS.
  7. V. Aravindan, J. Gnanaraj, Y. S. Lee and S. Madhavi, Chem. Rev., 2014, 114, 11619–11635 CrossRef CAS PubMed.
  8. K. Naoi, Fuel Cells, 2010, 10, 825–833 CrossRef CAS.
  9. J. Graetz, C. C. Ahn, R. Yazami and B. Fultz, Electrochem. Solid-State Lett., 2003, 6, A194–A197 CrossRef CAS.
  10. M. T. McDowell, S. W. Lee, W. D. Nix and Y. Cui, Adv. Mater., 2013, 25, 4966–4985 CrossRef CAS PubMed.
  11. X. Li, X. Meng, J. Liu, D. Geng, Y. Zhang, M. N. Banis, Y. Li, J. Yang, R. Li, X. Sun, M. Cai and M. W. Verbrugge, Adv. Funct. Mater., 2012, 22, 1647–1654 CrossRef CAS.
  12. M. D. Levi and D. Aurbach, J. Phys. Chem. B, 1997, 101, 4641–4647 CrossRef CAS.
  13. A. Brandt and A. Balducci, Electrochim. Acta, 2013, 108, 219–225 CrossRef CAS.
  14. W. J. Cao and J. P. Zheng, J. Electrochem. Soc., 2013, 160, A1572–A1576 CrossRef CAS.
  15. J. P. Zheng, J. Electrochem. Soc., 2009, 156, A500–A505 CrossRef CAS.
  16. W. J. Cao and J. P. Zheng, J. Power Sources, 2012, 213, 180–185 CrossRef CAS.
  17. S. R. Sivakkumar and A. G. Pandolfo, Electrochim. Acta, 2012, 65, 280–287 CrossRef CAS.
  18. J. H. Lee, W. H. Shin, S. Y. Lim, B. G. Kim and J. W. Choi, Mater. Renew. Sustain Energy, 2014, 3, 22 CrossRef (8 pages).
  19. V. Khomenko, E. Raymundo-Pinero and F. Beguin, J. Power Sources, 2008, 177, 643–651 CrossRef CAS.
  20. T. Aida, K. Yamada and M. Morita, Electrochem. Solid-State Lett., 2006, 9, A534–A536 CrossRef CAS.
  21. M. Schroeder, M. Winter, S. Passerini and A. Balducci, J. Power Sources, 2013, 238, 388–394 CrossRef CAS.
  22. M. Schroeder, M. Winter, S. Passerini and A. Balducci, J. Electrochem. Soc., 2012, 159, A1240–A1245 CrossRef CAS.
  23. X. Sun, X. Zhang, H. Zhang, N. Xu, K. Wang and Y. Ma, J. Power Sources, 2014, 270, 318–325 CrossRef CAS.
  24. Y. G. Lim, J. W. Park, M. S. Park, D. Byun, J. S. Yu, Y. N. Jo and Y. J. Kim, Bull. Korean Chem. Soc., 2015, 36, 150–155 CAS.
  25. J. P. Zheng, J. Electrochem. Soc., 2009, 156, A500–A505 CrossRef CAS.
  26. M. S. Park, Y. G. Lim, J. H. Kim, Y. J. Kim, J. Cho and J. S. Kim, Adv. Energy Mater., 2011, 1, 1002–1006 CrossRef CAS.
  27. C. J. Peng, D. S. Tsai, C. Chang and H. Y. Wei, J. Power Sources, 2015, 274, 15–21 CrossRef CAS.
  28. N. Bockenfeld and A. Balducci, J. Power Sources, 2013, 235, 265–273 CrossRef.
  29. R. D. Shannon and C. Calvo, J. Solid State Chem., 1973, 6, 538–549 CrossRef CAS.
  30. S. Ni, X. Lv, J. Ma, X. Yang and L. Zhang, J. Power Sources, 2014, 248, 122–129 CrossRef CAS.
  31. Q. Li, J. Sheng, Q. Wei, Q. An, X. Wei, P. Zhang and L. Mai, Nanoscale, 2014, 6, 11072–11077 RSC.
  32. Z. Jian, M. Zheng, Y. Liang, X. Zhang, S. Gheytani, Y. Lan, Y. Shi and Y. Yao, Chem. Commun., 2015, 51, 229–231 RSC.
  33. Z. Liang, Z. Lin, Y. Zhao, Y. Dong, Q. Kuang, X. Lin, X. Liu and D. Yan, J. Power Sources, 2015, 274, 345–354 CrossRef CAS.
  34. D. Weingarth, A. Foelske-Schmitz and R. Kotz, J. Power Sources, 2013, 225, 84–88 CrossRef CAS.
  35. D. Weingarth, A. Foelske-Schmitz, A. Wokaun and R. Kotz, Electrochim. Acta, 2013, 103, 118–224 CrossRef.
  36. S. Kumgai, T. Ishikawa and N. Sawa, J. Energy Storage, 2015, 2, 1–7 CrossRef.

This journal is © The Royal Society of Chemistry 2015