DOI:
10.1039/C5RA11502G
(Paper)
RSC Adv., 2015,
5, 67149-67156
Upconversion NaYF4:Yb:Er nanoparticles co-doped with Gd3+ and Nd3+ for thermometry on the nanoscale†
Received
16th June 2015
, Accepted 30th July 2015
First published on 31st July 2015
Abstract
In the present work, the upconversion luminescence properties of oleic acid capped NaYF4:Gd3+:Yb3+:Er3+ upconversion nanoparticles (UCNP) with pure β crystal phase and Nd3+ ions as an additional sensitizer were studied in the temperature range of 288 K < T < 328 K. The results of this study showed that the complex interplay of different mechanisms and effects, causing the special temperature behavior of the UCNP can be developed into thermometry on the nanoscale, e.g. to be applied in biological systems on a cellular level. The performance was improved by the use of Nd3+ as an additional dopant utilizing the cascade sensitization mechanism in tri-doped UCNP.
1. Introduction
Temperature is a fundamental parameter of key importance in many different fields of science and technology. Respective sensors are widely used in on a daily basis in climate and marine research as well as in chemistry, biology, metrology, and medicine.1–3 It is estimated that the share of temperature sensors amounts to as much as 75–80% of the world's sensor market.4 Indeed, current technological demands like microfluidics or nano medicine have reached a point at which a spatial resolution on the submicron scale is needed.5 For example the mapping of the temperature in living cells, i.e. cancer cells compared to normal tissue have a higher temperature due to the increased metabolic activity, which strongly improves the perception of their pathology and physiology and in turn can help to optimize diagnosis and therapeutic approaches, e.g., hydrothermal treatment or photodynamic therapy. In particular a thermometer capable of subdegree temperature resolution as well as integration on a cellular level could provide a powerful new tool in many areas of biochemical and biophysical research.5,6 Many promising approaches for local temperature sensing are being explored at present such as Raman spectroscopy,6 scanning probe microscopy6 and luminescent based measurements using organic dyes,7,8 nanomaterials9–11 such as quantum dots (QD) or proteins.8 Many of these already existing methods suffer on several drawbacks such as low sensitivity, low reproducibility or systematic errors due to fluctuations in the luminescence rate or local chemical environment.10
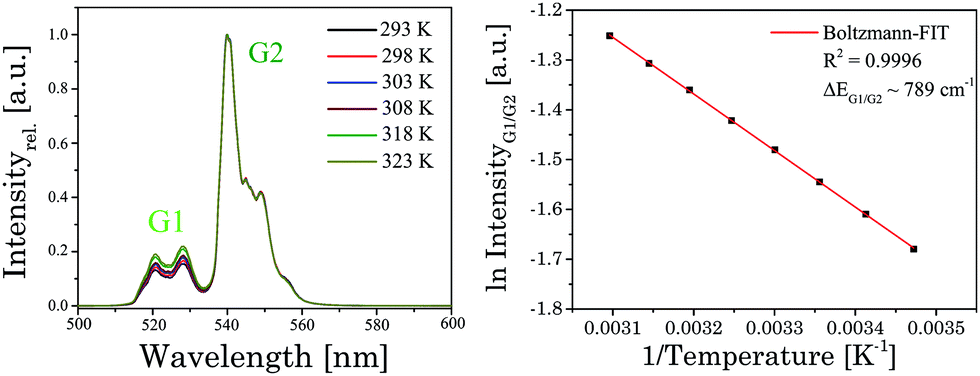
Our approach to nanoscale thermometry uses luminescence upconversion nanoparticles (UCNP), which are suitable for investigation in different biological matrices. The UCNP are excited with light in the near infrared range (NIR), where interferences from background fluorescence can be neglected.12 In the chosen excitation wavelength range between 795 nm < λex < 976 nm many biological matrices are nearly transparent.13 Consequently, the penetration depth in this spectral range is very high for a human skin or in blood (see Fig. 1) and a high sensitivity in sensing applications without additional sample preparations can be established.13 One of the first promising approaches for upconversion nanoparticle based thermometry on nanoscale was developed by Zink et al.14 They used a dual core (made of UCNP and smaller superparamagnetic nanocrystal) mesoporous silica nano-particle that acted as nanothermometer as well as nanoheater. An in-depth investigation of the potential of UCNP as nanothermometer was carried out by Wolfbeis et al. using different lanthanide combination and capping agents.15 Here, the best results were found for NaYF4:Yb3+:Er3+ core/shell nanoparticles. Moreover, UCNP can be developed into multimodal probes, e.g., with additives like gadolinium (Gd3+) ions UCNP can be used for magnet resonance imaging or with the appropriate functionalization for optical imaging or assay applications.16–18 Apart from the excitation at λex = 976 nm Han et al. report on UCNP with additional Nd3+ doping which could be excited at λex = 800 nm. This type of UCNP showed a better biocompatibility due to lower impact on biological tissues and a higher penetrability for the excitation light.19
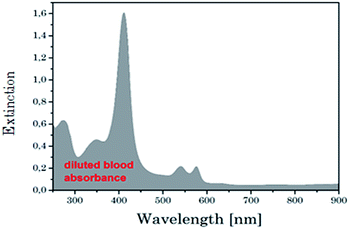 |
| | Fig. 1 Absorption spectra of diluted blood. | |
In the present work, the potential of oleic acid-capped NaYF4:Gd3+:Yb3+:Er3+ upconversion nanoparticles (UCNP) for thermometry on nanometer scales was studied in the temperature range of 288 K < T < 328 K. Both, the overall luminescence intensity and the ratio of luminescence bands were found to be highly sensitive on temperature. For the temperature determination the intensity ratio of the luminescence signal in the green Er3+ luminescence bands (2H11/2 → 4I15/2 (G1) and 4S3/2 → 4I15/2 (G2)) was used. The relative sensitivity (Sr) with 1.49% K−1 of the UCNP under investigation is one of the highest Sr value which found in literature for NaYF4:Yb3+:Er3+ type nanoparticles or other host lattices like GdVO4:Yb3+:Er3+ or Na2Y2B2O7:Yb3+:Tm3+.20,21
The overlapping of the excitation light at λex = 976 nm with the absorption of water (see Fig. 2), which may induce heating damage in cells and tissues, is a drawback e.g., for nanoparticle-based imaging or for deep tissue imaging (this experiments require high excitation energy and long-term excitation). To overcome this limitation, Nd3+ was used as additional lanthanide. Nd3+ has an absorption maximum around λ = 800 nm, which can be used for the initial excitation of the UCNP. At this excitation wavelength the intrinsic water absorption is one order of magnitude lower compared to λex = 976 nm resulting in less heating of the sample by the laser irradiation (see Fig. 2). Subsequently a better biocompatibility and higher penetration depth in aqueous systems can be envisaged. Colloidal tri-doped (Yb3+, Er3+ and Gd3+ ions) UCNPs with Nd3+ were successfully generated and optimized for maximum upconversion efficiency with an excitation wavelength of λex = 800 nm.
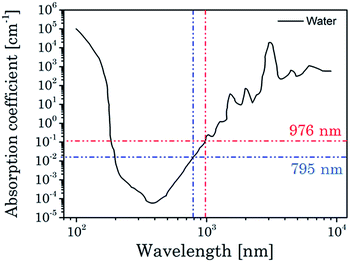 |
| | Fig. 2 Absorption coefficient of water in a spectral range of 100 to 10![[thin space (1/6-em)]](https://www.rsc.org/images/entities/char_2009.gif) 000 nm. Values for typically excitation of Yb3+ ions at 976 nm and Nd3+ ions are high lighted.11 000 nm. Values for typically excitation of Yb3+ ions at 976 nm and Nd3+ ions are high lighted.11 | |
2. Experimental
2.1 Materials
All rare earth chloride hydrates RECl3·xH2O (RE: Y, Yb, Gd, Nd and Er, 99.9%) were purchased from Sigma Aldrich and Alfa Aesar. Ammonium fluoride (NaF, 99.99%), ethanol (absolute) and chloroform (99.8%) were purchased from Sigma Aldrich. Sodium hydroxide (NaCl, 99%) was purchased from Carl Roth and oleic acid (90%) from Alfa Aesar. 2-Aminoethyl dihydrogen phosphate (AEP) (98%) and octadecen (91%) were obtained from Merck. Argon (Ar, 5.0) was received from Praxair and was dried with sicapent. All further chemical reagents used in experiments were directly used without any further purification. For the experiments double distilled water was used.
2.2 Synthesis of NaYF4:Yb3+:Gd3+:Er3+ (UCNP) and UCNP:Nd3+ (UCNPNd)
The UCNP were synthesized according to a previously reported procedure in which a thermal decomposition method with oleic acid as a capping agent was used.22,23 The synthesis was designed to keep a constant overall amount of lattice ions (Y3+, Yb3+, Er3+, Nd3+, and Gd3+) in the different samples to study the effect of neodymium. The concentration of the lanthanides (Ln) Er3+ and Yb3+ was constant for all samples whereas parts of the Y3+ ions were replaced by Nd3+ ions. GdCl3 hexahydrate (0.61 mmol), ErCl3 (0.06 mmol), YbCl3 (0.34 mmol), NdCl3 (0.02 mmol) and YCl3 (0.99 mmol) were dissolved under Ar atmosphere in a mixture of oleic acid (13.4 g) and octadecen (35 mL) under stirring. The solution was evacuated (1 mbar) for 45 minutes until evolution of gas had stopped. The reaction mixture was heated to 140 °C under Ar atmosphere until a yellowish clear solution occurs. After the solution had been cooled to 45 °C, ammonium fluoride (300 mg) and sodium hydroxide (150 mg) was added to the reaction mixture under stirring until a clear solution was formed. The solution was heated to 310 °C for 90 minutes using a heating mantle. A discoloration (yellow/brown) of the reaction mixture as well as a white precipitation occurs. When the reaction mixture reached room temperature, the nanoparticles were separated via centrifugation (6000 rpm for 25 min) and further purified by several redispersion and centrifugation steps in ethanol. The obtained white powder was dissolved in cyclohexane and filtrated using a 0.2 μm PTFE syringe filter. The as-synthesized UCNPs disperse readily in non polar solvents such as cyclohexane, forming a clear colloidal solution. The oleic acid capped UCNP stored at room temperature were colloidal stable for several months.
2.3 Synthesis of water soluble AEP-capped UCNP
In a typically ligand exchange reaction 150 mg AEP was diluted in solvents mixture of ethanol and ultrapure water (4 mL/6 mL) and 20 mg UCNP dispersed in 5 mL chloroform were added slowly drop wise.24 The reaction mixture was stirred for 48 h at room temperature, whereas the UCNP moved obviously from the chloroform to the watery phase. After the phase separation the watery phase was centrifuged at 6000 rpm for 25 minutes and the obtained modified UCNP were redispersed in ultrapure water. The AEP-modified UCNP were stored under exclusion of light and different temperature between −10 and 20 °C to get information of the long-term colloidal stability.
2.4 Structural characterization
The size and morphology of as-prepared UCNPs were observed on a JEM 1011 transmission electron microscope (Jeol Ltd, Tokyo, Japan) (TEM) using a wolfram hairpin cathode, an accelerating voltage of 80 kV and a molybdenum panel. The measurements were recorded using a side-mounted Olympus Mega View G2 (Olympus Germany GmbH, Hamburg, Germany). Particle size characterizations were also carried out with dynamic light scattering (DLS) by using a ZETASIZER Nano ZS (Malvern Instruments Ltd, Herrenberg, Germany) as well. As light source a He–Ne laser at λ = 633 nm was used.
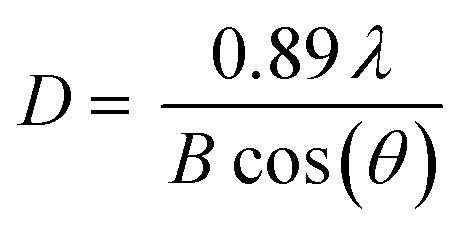
X-ray powder diffraction patterns were obtained using a D5005 (Siemens AG, Munich, Germany) in a range of 3–70°/2θ with divergence aperture, scattering ray aperture and graphite monochromatized Cu Kα radiation (λ = 0.15406 nm). The scanning step was 0.02°/2θ with a counting time of 4 s per step. The nanocrystalline domain sizes were calculated using the Debye–Scherrer equation (eqn (1)):
| |  | (1) |
D is the domain size to be determined,
λ is the wavelength of the X-ray,
B is the FWHM of the diffraction peak of interest and
θ is the angle of the corresponding diffraction peak.
2.5 Room temperature steady state luminescence spectra
Room temperature (ν = 23 °C) steady state luminescence spectra were obtained using a wavelength tunable pulsed Nd:YAG/OPO laser system (laser: Quanta Ray, Spectra-Physics, Mountain View, CA, USA; OPO: GWU-Lasertechnik Vertriebsges. mbH, Erftstadt, Germany) operating at 10 Hz as excitation light source (at 26 mJ/130 mW) and recorded using an intensified CCD-camera (iStar DH720-18V-73, Andor Technology, Belfast, Great Britain) coupled to a spectrograph (Shamrock SR 303i, Andor Technology, Belfast, Great Britain) equipped with a 600 L mm−1 grating blazed at 500 nm.
2.6 Upconversion luminescence measurements at various temperature (288 to 328 K)
In order to study the upconversion luminescence properties at various temperature the experimental set up mentioned above was extended by a water-cooled Peltier element-based temperature adjustable sample holder (temperature controller GR2012 itron 32, JUMO GmbH & Co, Fulda, Germany). In order to ensure the temperature stability the samples were temperated for 15 minutes at the certain temperature. As an additional control a conventional temperature sensor (Testo 945, Testo AG, Lenzkirch, Germany) was used to monitor the temperature of UCNP containing solution under investigation. For all spectroscopic measurements quartz cuvettes sealed with Parafilm® were used.
2.7 Power dependency of upconversion luminescence at room temperature
The intensity of upconversion emission was measured as function of excitation power at λex = 976 nm (further details on equipment vide supra). The attenuation of excitation light was achieved by the use of neutral density filters (optical density (OD) 0.1–1.0). The upconversion emission intensity IUC strongly depends on the excitation power IP (see eqn (2)):21here n is the number of photons required to populate the emitting state of the lanthanides. The power dependence of the Er3+ transitions 2H11/2 → 4I15/2 (G1), 4S3/2 → 4I15/2 (G2) and 4F9/2 → 4I15/2 (R) is shown in ESI Fig. 1† using a logIP − logIUC plot, in which n was calculated from the slope.
3. Results and discussion
3.1 Structural investigations
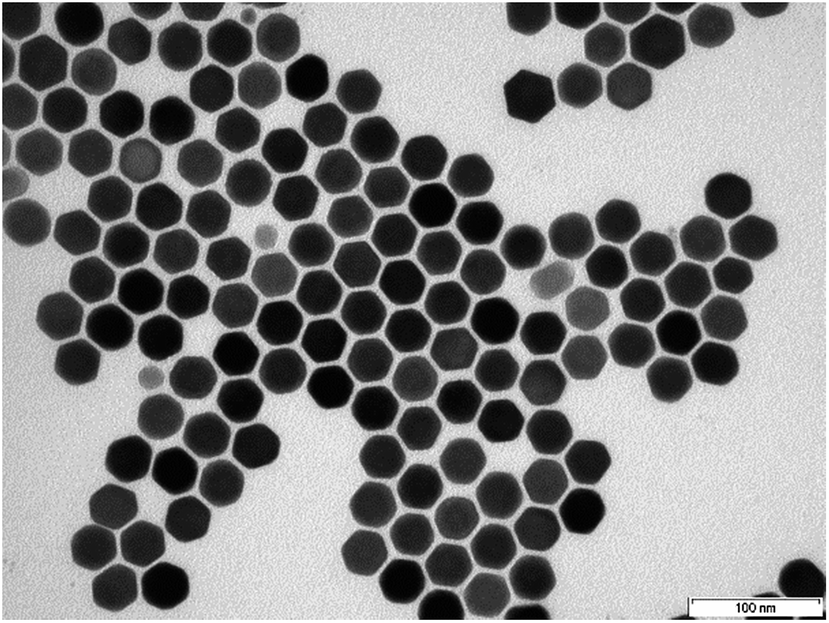
The particle size and morphology of UCNP and UCNPNd were studied using TEM, XRD and DLS, respectively. The TEM images of the different UCNP showed that the particles were hexagonal in shape (Fig. 3).25 In order to determine the average particle size from TEM images approximately 200 particles were included in the statistical analysis (see Table 1).
 |
| | Fig. 3 TEM image of NaYF4:Yb3+:Er3+:Nd3+ doped upconversion nanoparticles. | |
Table 1 Results (full width at halt maximum (FWHM) and particle diameter) of the DLS-, TEM- and XRD analysis of several UCNP synthesis with the same composition and additionally Nd3+ doping (n.d.: not determined)
| Sample |
UCNP |
UCNPNd |
UCNPNd,AEP |
| Particle diameter-DLS (nm) |
30.2 ± 0.2 |
29.7 ± 0.1 |
81.1 ± 0.3 |
| Particle diameter-TEM (nm) |
n.d. |
34.5 ± 0.1 |
n.d. |
| Particle diameter-XRD (nm) |
33.9 ± 3.1 |
32.7 ± 4.2 |
n.d. |
| FWHM-DLS |
3.3 ± 0.1 |
3.1 ± 0.1 |
19.3 ± 0.8 |
| FWHM-TEM |
n.d. |
1.8 ± 0.3 |
n.d. |
In addition, DLS and XRD was used as a complementary method for particle size determination. The results of the DLS, TEM and XRD measurements are also shown in Table 1 (see ESI Fig. 2 and 3†). Corroborating the results of the TEM images, DLS and XRD showed as well no particle size alteration upon addition of Nd3+, which was expected due to the very similar atomic radius of the different lanthanides used. Furthermore, it can be assumed that the UCNP/UCNPNd are highly crystalline, due to the similar particle diameter obtained from TEM/XRD and the fact that only crystalline parts can be observed in XRD. The AEP capped UCNPNd are 2.7 times larger than the oleic acid capped UCNP, which could be due to the different ligand on the surface resulting in an increase of the hydrodynamic radius or the possible formation of small aggregates. In comparison to the TEM investigations the particle size obtained from the DLS measurements are nearly similar. The deviations in particles size of TEM in comparison to the DLS are due to the fact that calculation algorithm for DLS is optimized for spherical particles whereas variations in shape leads to a change in the scattering behaviour and finally to an inaccuracy in the calculated particle diameter.
3.2 Upconversion luminescence spectroscopy studies
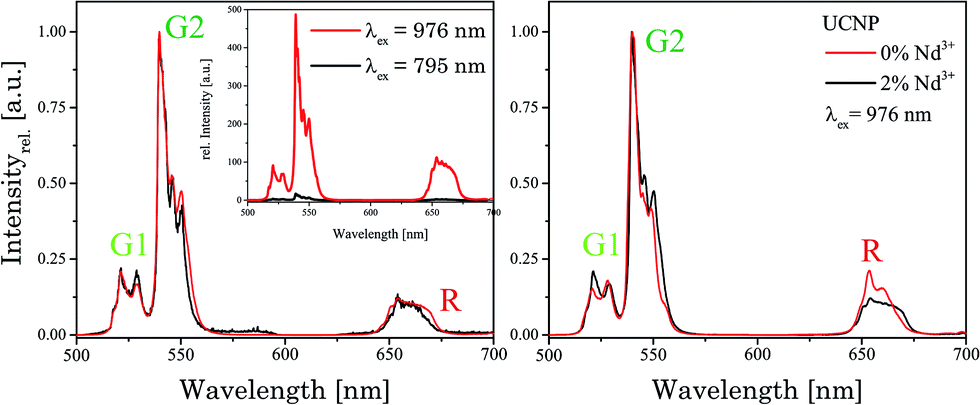
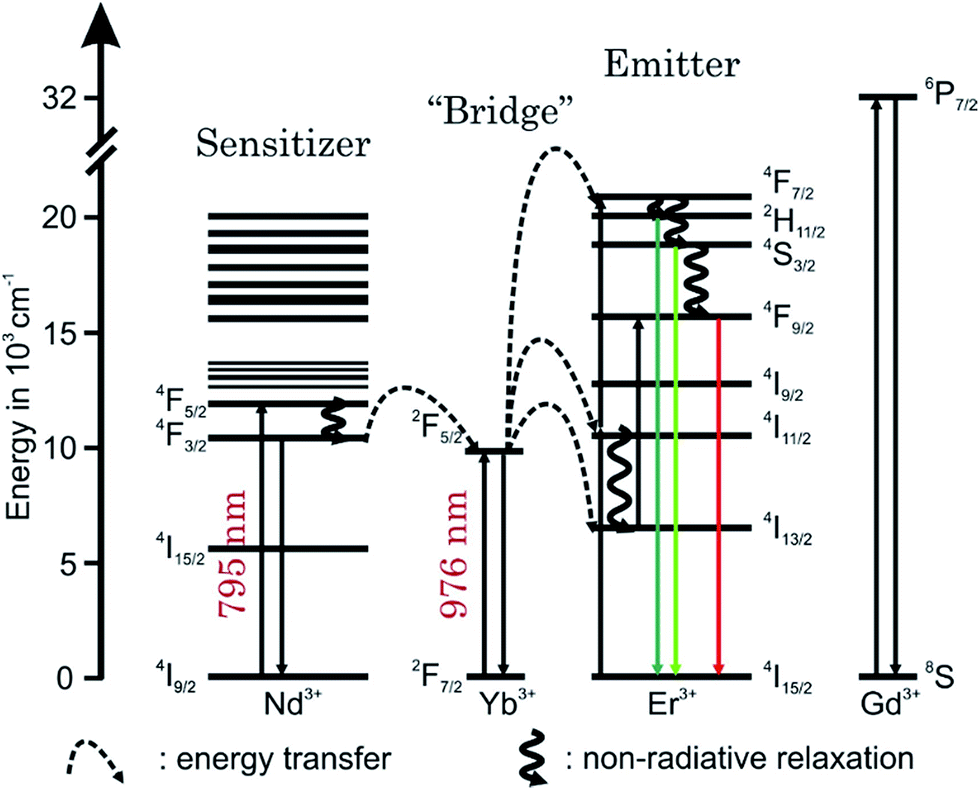
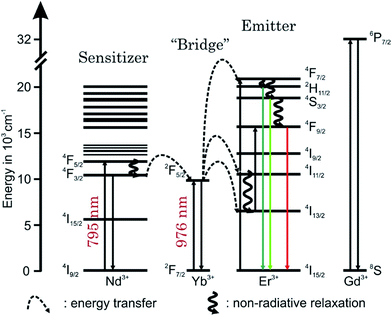
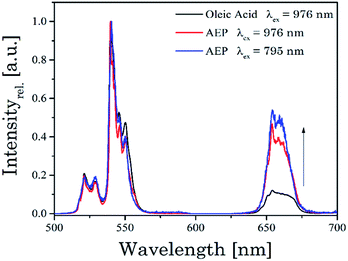
In Fig. 4 the luminescence spectra of the UCNP and UCNPNd are shown. The optimal excitation wavelengths chosen for the samples under investigation are based on matrices of excitation emission spectra, shown in ESI Fig. 4.† The spectra were recorded in cyclohexane with λex = 976 nm and are the result of energy upconversion processes between Yb3+ and Er3+ ions (see Scheme 1).26 The three most intense emission bands can be observed in the green spectral region centered at λem = 525 nm (2H11/2 → 4I15/2 transition, G1), 545 nm (4S3/2 → 4I15/2 transition, G2), and in the red spectral region centered at λem = 660 nm (4F9/2 → 4I15/2 transition, R).27–32 The observed fine structure (Stark splitting) is induced by the crystal field splitting due to small differences in the coordination environment.29,32,33 The Nd3+ containing UCNPNd can be excited at λex = 976 nm and additionally at λex = 795 nm. For the excitation at λex = 795 nm the mechanism of the upconversion processes is extended by an initial energy transfer step between Nd3+ and Yb3+. First the Nd3+ ions are excited from the 4I9/2 to the 4F5/2 energy level, followed by a non-radiative relaxation step to 4F3/2 level. Originating from this energy level the energy transfer to the 2F5/2 level of the Yb3+ ions can take place. In such cases the Yb3+ acts like a “relay” between the sensitizer Nd3+ and the activator Er3+.1,34–39 The subsequent energy transfer steps and relaxation processes from the Yb3+ to the Er3+ are identical to the regular UCNP. The cross-relaxation between different excited Er3+ ions can be neglected in both cases due to the low Er3+ ion concentration used.31,40 The Gd3+ ion doping was chosen to enhance the absolute upconversion luminescence intensity, due to the favoured formation of the β-phase.41 Since the 6P7/2 level, which represents the next electronic state above the ground state of Gd3+, its emission is found in the ultra violet spectral region and is therefore much higher in energy than the relevant excited state levels of Er3+, Nd3+, and Yb3+, respectively. Consequently, a Gd3+-related luminescence quenching by energy transfer of these ions can be ruled out. The upconversion emission spectra (λex = 976 nm) shown in Fig. 3 (right) reveal no significant differences between the UCNP and UCNPNd investigated, except the G1, G2/R ratio, which is slightly increased. The additional doping of the host lattice with Nd3+ ions has no significant impact on the upconversion emission spectra. Also no significant differences in the shape or fine structure of the upconversion emission spectra can be seen for different excitation wavelength, due to the fact that the Nd3+ ion doping only influence the population of the emitting energy level of Yb3+.
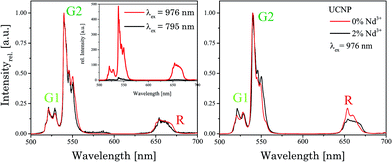 |
| | Fig. 4 [Left]: normalized upconversion luminescence spectra of UCNPNd (in cyclohexane) at λex = 976 nm and 795 nm, respectively. [Inset]: comparison of upconversion emission of UCNPNd excited at different λex. [Right]: typical upconversion emission of UCNP and UNCPNd excited at λex = 976 nm. | |
 |
| | Scheme 1 Schematic energy level diagram of the upconversion mechanism of a Yb3+ and Er3+ dopant ion system following an excitation at λex = 976 nm. Furthermore, the upconversion mechanism of a Nd3+, Yb3+ and Er3+ dopant ion system following an excitation at λex = 795 nm is shown as well. The full lines pointing upwards represent energy absorption, the dotted lines represent energy transfer, the waved lines represents non radiative relaxation processes and the colored full lines pointing downwards represents the visible emission. | |
On the other hand the absolute upconversion luminescence intensity is much lower (1/10 intensity) for the excitation at 795 nm (see Fig. 4 inset). The lower upconversion intensity at λex = 795 nm is related to several additional energy transfer steps between Nd3+ ions and Yb3+ ions as well as relaxation steps of excited Nd3+ ions itself. The possibility for non-radiative deactivation channels is increased, subsequently leading to a less effective upconversion.
In Fig. 5 normalized upconversion emission spectra of UCNPNd with different capping agents at λex = 795 nm as well as 976 nm are shown. The ratio of the emission bands G1, G2 to R is decreased when the nanoparticles are capped with AEP. The change in the G1, G2 to R ratio could be connected to the new chemical environment at the surface of the nanoparticles with different phonon coupling processes influencing the luminescence upconversion. Due to fact that the probability for the non-radiative transition 4I11/2 to 4I13/2 of Er3+ ions is increased, the population efficiency for the energy level R is increased too, whereas of the population of G1 and G2 is decreased, because it is populated by different upconversion mechanisms. The excitation wavelength has no impact on the spectral intensity distribution including the position of the emission bands or emission band ratio as in the case of oleic acid capped UCNP in cyclohexane (see Fig. 4 above).
 |
| | Fig. 5 Normalized upconversion emission spectra of UCNPNd stabilized with the capping agents oleic acid and AEP. The excitation wavelength λex was also varied. | |
3.3 Temperature dependent upconversion luminescence
In ESI Fig. 5† emission spectra of UCNP in cyclohexane (λex = 976 nm) for the temperature range of 288 K < T < 328 K are shown, which are representative for the observed temperature dependence of all UCNP and UCNPNd investigated.
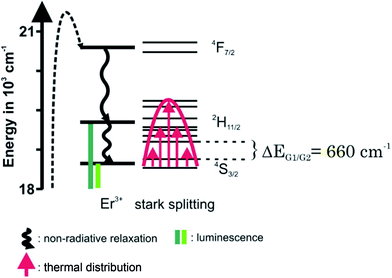
The following trends were observed for the different luminescence bands of Er3+: (i) the luminescence intensity of the 2H11/2 → 4I15/2 transition (G1) gradually increased with increasing temperature and (ii) in contrast to the G1 emission band, the intensity of the G2- and R-related emission bands initially decreased slightly with increasing temperature. The difference in the temperature dependence of the G1 and G2 emission bands is connected to the population pathways of the related energy levels 2H11/2 and 4S3/2, respectively. In Scheme 2 a detail view of the respective Stark levels of 2H11/2 and 4S3/2 is shown. The Stark levels are calculated from the excitation and emission spectra of the UCNP under investigation. The population of the green emitting levels G1 and G2 (2H11/2 and 4S3/2) usually occurs by successive energy transfer processes from the excited 2F5/2 state of Yb3+ ions to the Er3+ ions exciting it first to the 4I11/2 state and in a second step to the 4F7/2 excited state. Followed by a non-radiative relaxation process the Er3+ ion deactivates to the 2H11/2 and – due to the moderate energy gap between 2H11/2 and 4S3/2 states (about 700 cm−1) – the Er3+ ions can relax fast to the 4S3/2 state. Finally, the 2H11/2 level is re-populated via thermal agitation (see Scheme 2) resulting in the observed two Er3+-emission bands G1 and G2 as shown in Fig. 5 (see also Scheme 1).28–30,42,43
 |
| | Scheme 2 Close-up of energy levels related to G1 and G2 emission in erbium. | |
The thermal equilibration of the two levels is fast, hence the observed intensity ratio of G1 and G2 will be dependent on the temperature.
3.4 UCNP for nanoscale thermometry
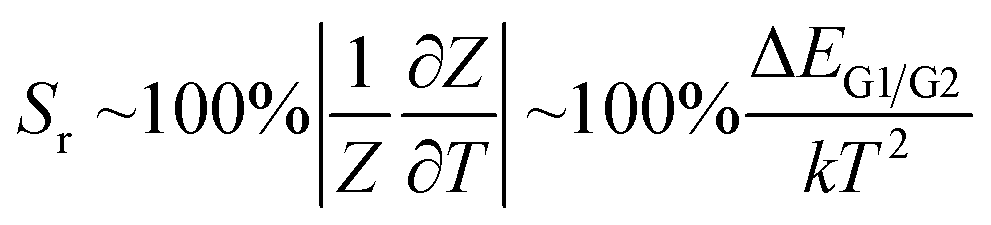
For T > 273 K the correlation of the luminescence intensity ratio (Z = IG1/IG2) and the temperature T can be described by an Arrhenius type equation.34,35,44| | 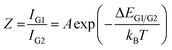 | (3) |
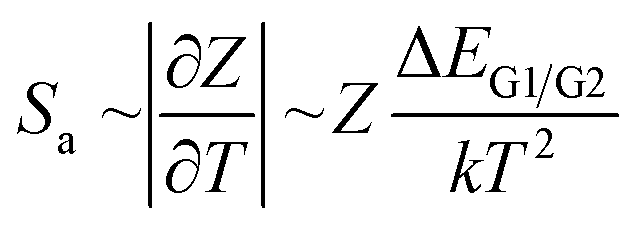
Z is the ratio of integrated luminescence intensity originating from band G1 and G2 which are separated by the energy gap ΔEG1/G2, kB is the Boltzmann constant, T is the temperature and A is a constant which depends on the spontaneous emission rate and devolution of the energy levels of the emitting states in the host material. From Fig. 6 (left) it can be seen that Z is changing with temperature, because the relative intensity of the G1-related luminescence is increasing. This is a consequence of the thermally induced re-distribution in population between the energy levels 2H11/2 and 4S3/2 (see Scheme 2). Especially for higher temperatures (T > 273 K) a distinct change with temperature was found, which is connected to the fact that the energy gap ΔEG1/G2 is in the order of 600–800 cm−1 depending on the host lattice. For UCNP an energy gap ΔEG1/G2 = 789 ± 9 cm−1 was determined, which correlates very well with the data of Carnall et al. who studied the energy level assignments for Er3+ in several host lattices.42 Based on eqn (3) the absolute sensitivity Sa and relative sensitivity Sr can be obtained.1,45–48| |  | (4) |
| |  | (5) |
 |
| | Fig. 6 [Left]: normalized upconversion emission spectra of UCNP at different temperatures. [Right]: analysis of the integrated emission intensity ratio of band G1 and G2 according to eqn (3). | |
The temperature sensitive calculated value of Sa and Sr are shown in Fig. 7. The maximum value of Sr of 1.37% K−1 was found at 288 K which is in the range typically found for NaYF4:Yb3+:Er3+ or other new host lattices of upconverters like GdVO4:Yb3+:Er3+.16 The temperature resolution of ∼0.4 K was obtained from δR/Sa where δR is the standard deviation of the residuals in the polynomial interpolation of the experimental data points (temperature vs. Z = IG1/IG2). In Table 2 the absolute and relative sensitivity of oleic acid capped UCNP and AEP capped UCNP are shown. It is obvious that the type of ligand and the surrounding medium (cyclohexane and water) has no significant impact on Sa and Sr.
 |
| | Fig. 7 Absolute (black line) and relative (blue line) sensitivity of the temperature sensor based on Z (Z = IG1/IG2) of the upconversion luminescence of UCNPs. | |
Table 2 Absolute Sa and relative sensitivity Sr of UCNPOA and UCNPAEP at 288 K
| Sample |
UCNP |
UCNP |
| Capping agent |
Oleic acid |
AEP |
| Solvent |
Cyclohexane |
Water |
|
S
a 10−3 [K−1] |
2.6 |
3.0 |
|
S
r [% K−1] |
1.37 |
1.38 |
3.5 UCNPNd as optical probes for thermometry
A big challenge for measurements in “real” biological system are the different optical properties of biological tissues like skin, muscles, connective tissue or vertebral column which only enables a sharp window (700–1000 nm) for optical measurements (see Fig. 8). Based on the water and tissue transmission, which are shown in Fig. 2 and 8, wavelengths around λex ∼ 800 nm are more suitable for UCNP based thermometry measurements in contrast to the typical used excitation wavelength of λex = 976 nm, at which also a heating effect by the excitation laser due to water absorption is induced and which is distinctly reduced at λex ∼ 800 nm.13 For UCNP related thermometry the excitation wavelength can be shifted to λex ∼ 800 nm upon co-doping with Nd3+ (vide supra).
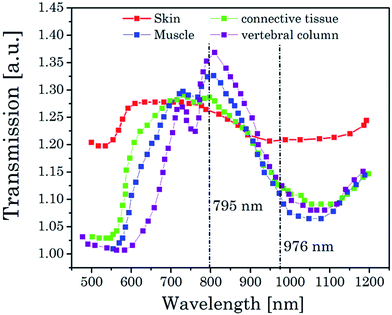 |
| | Fig. 8 Transmission spectra of different biological tissue in a spectral range of 500–1200 nm.13 | |
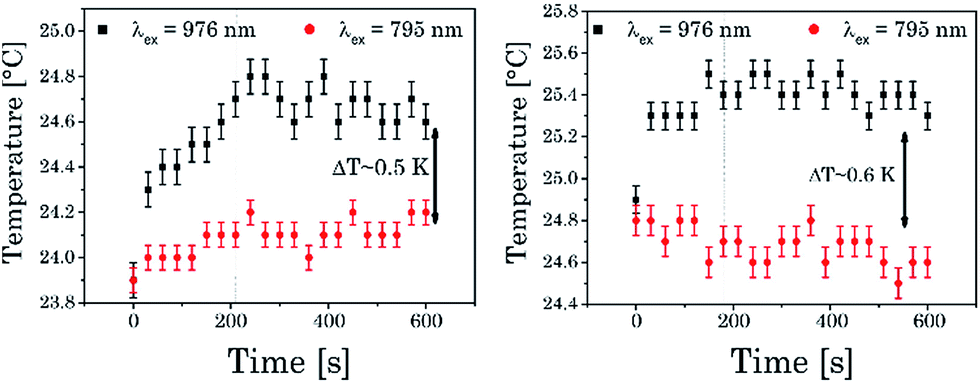
The influence of the excitation wavelength on the temperature within the observation volume and near surrounding was monitored using a resistance thermometer in an optical cuvette during the irradiation of the sample with light at λex = 795 nm and 976 nm, respectively (see Fig. 9 and ESI Fig. 6†). It was found that the temperature after irradiation at λex = 795 nm is nearly constant whereas for λex = 976 nm (excitation power ∼ 170 mW at both wavelength) an increase in temperature of about ΔT ∼ 0.6 K was found in both cases (pure water and water containing UCNPNd). The maximum ΔT was reached at ∼200 seconds of irradiation with λex = 976 nm (since a conventional thermometer was used to measure the temperature change in the nearby bulk phase, the temperature increase at the laser spot is larger).
 |
| | Fig. 9 [Left]: temperature dependence of pure water on the excitation wavelength. [Right]: temperature dependence of UCNPNd dissolved in water at different at different λex. | |
For biological systems such an increase could induce cellular damage or could significantly influence protein-related processes.6 On the other hand an excitation wavelength of λex = 795 nm, which is used in the case of UCNPNd, did not show a comparable heating effect in the sample and therefore offers a promising alternative for investigations of biological systems (using UCNP for sensing purposes as well as nanothermometer). As already shown for UCNP (Fig. 6 and 7) the absolute and relative sensitivity of UCNPNd with different ligands and different excitation wavelength (λex) were calculated based on luminescent spectra at different temperatures (see Table 3). The absolute sensitivity is unaffected by the λex applied in the measurement and by the solvent. For the relative sensitivity the same was found when comparing the different solvents (for λex = 795 nm Sr was slightly smaller than for λex = 976 nm). The obtained values for Sr are in good agreement with literature data reported for other host materials.20
Table 3 Absolute Sa and relative sensitivity Sr (at 288 K) of UCNPNd. In different solvents excited at 976 nm and 795 nm
|
λ
ex [nm] |
976 |
795 |
| Solvents |
Cyclohexane |
Water |
Cyclohexane |
Water |
|
S
a 10−3 [K−1] |
2.7 |
2.9 |
2.9 |
3.0 |
|
S
r [% K−1] |
1.44 |
1.41 |
1.31 |
1.30 |
4. Conclusions
The upconversion luminescence properties of oleic acid and AEP stabilized nanoparticles (UCNP) based on a NaYF4 host matrix, which was doped with Yb3+ (UCNP) and Yb3+:Nd3+ (UCNPNd) as sensitizer and Er3+ as activator, respectively, were studied. The focus of this work was the surface modification with AEP to obtain water soluble nanoparticles as well as to investigate possible thermometry applications based on the temperature sensitivity of the upconversion luminescence. The temperature dependence of different luminescence parameters especially the spectral intensity distribution were analysed for the temperature range of 288 K < T < 328 K. Not only the overall luminescence intensity was dependent on the type of capping agent but also the spectral distribution which is effected as well by the phonon coupling possibilities at the surface of the nanoparticles. On the other hand Nd3+ ions as additional co-dopant had no effect on the spectral properties of the Er3+ related luminescence.
The possibility to excite the UCNP at λex = 795 nm could be realized by the use of Nd3+ ions as new sensitizer with no further impact on the spectral distribution. The interplay between spectral distribution and the temperature dependence of photophysical parameters was further investigated. The intensity distribution (e.g., ratio of the green emission G1 and G2) was strongly depending on the temperature and can be used in thermometry applications. In practical applications, efficient collection of fluorescence signal ensures a high signal to noise ratio (SNR) for improving the sensitivity and resolution of QD, fluorescent dyes or upconversion nanoparticle.49,50 A variety of highly promising approaches of external optical coupling structures for enhancing the excitation and emission of the luminescence from QD or fluorescent dyes are being investigated using cascaded photonic crystal surfaces, which could also be a powerful tool for application based on upconversion nanoparticles.49,50 Furthermore, the heating effect due to the irradiated excitation light in the observed sample volume was investigated. Whereas for λex = 795 nm only minor increase of the sample temperature was found, the excitation at λex = 976 nm lead to an increase up to 0.6 K which is rather high especially with regards to possible application in biological tissue. In addition to avoiding heating effects the performance of UCNPNd are comparable to the regular UCNP with respect to absolute and relative sensitivity of temperature sensing. The intensity ratio of the different Er3+ luminescence bands in combination with an excitation wavelength of λex = 795 nm can be envisioned to be used as a nanothermometer, e.g., to measure the temperature spatially resolved in tissues with submicron resolution.
Acknowledgements
We are thankful to Dr C. Günter as well as Dr C. Prietzel and Prof. J. Koetz (University of Potsdam) who performed the structural studies (XRD and TEM measurements, respectively) of the samples.
References
- X.-D. Wang, O. S. Wolfbeis and R. J. Meier, Chem. Soc. Rev., 2013, 42, 7834 RSC.
- E. F. J. Ring, Infrared Phys. Technol., 2007, 49, 297–301 Search PubMed.
- J. B. Weaver, Nat. Nanotechnol., 2010, 5, 630–631 CrossRef CAS PubMed.
- P. R. N. Childs, R. Greenwood and C. A. Long, Rev. Sci. Instrum., 2000, 71, 2959–2978 CrossRef CAS.
- C. D. S. Brites, P. P. Lima, N. J. O. Silva, A. Millan, V. S. Amaral, F. Palacio and L. D. Carlos, Nanoscale, 2012, 4, 4799–4829 RSC.
- G. Kucsko, P. C. Maurer, N. Y. Yao, M. Kubo, H. J. Noh, P. K. Lo, H. Park and M. D. Lukin, Nature, 2013, 500, 54–58 CrossRef CAS PubMed.
- K. Okabe, N. Inada, C. Gota, Y. Harada, T. Funatsu and S. Uchiyama, Nature Commun., 2012, 3, 705 CrossRef PubMed.
- L. Donner, S. Thompson, M. Kreuzer, G. Baffou and R. Quidant, Nano Lett., 2012, 12, 2107–2111 CrossRef PubMed.
- J. Yang, H. Yang and L. Lin, ACS Nano, 2011, 5, 5067–5071 CrossRef CAS PubMed.
- F. Vetrone, ACS Nano, 2010, 4, 3254–3258 CrossRef CAS PubMed.
- C. Brites, C. P. P. Lima, N. J. O. Silva, A. Millan, V. S. Amaral, F. Palacio and L. D. Carlos, New J. Chem., 2011, 35, 1177–1183 RSC.
- G. Chen, H. Qiu, P. N. Prasad and X. Chen, Chem. Rev., 2014, 114, 5161–5214 CrossRef CAS PubMed.
- K. R. Byrnes, R. W. Waynant, I. K. Ilev, X. Wu, K. Smith, R. Heckert, H. Gerst and J. J. Anders, Lasers Surg. Med., 2005, 36, 171–185 CrossRef PubMed.
- J. Dong and J. I. Zink, ACS Nano, 2014, 8, 5199–5207 CrossRef CAS PubMed.
- A. Sedlmeier, D. E. Achatz, L. H. Fischer, H. H. Gorris and O. S. Wolfbeis, Nanoscale, 2012, 4, 7090–7096 RSC.
- C. Liu, Z. Gao, J. Zeng, Y. Hou, F. Fang, Y. Li, R. Qiao, L. Shen, H. Lei, W. Yang and M. Gao, ACS Nano, 2013, 7, 7227–7240 CrossRef CAS PubMed.
- B. Sikora, K. Fronc, I. Kaminska, K. Koper, S. Szewczyk, B. Paterczyk, T. Wojciechowski, K. Sobczak, R. W. Minikayev, W. Paszkowicz, P. Stepien and D. Elbaum, Nanotechnology, 2013, 24, 235702 CrossRef PubMed.
- G. Shan, R. Weissleder and S. A. Hilderbrand, Theranostics, 2013, 3, 267–274 CrossRef CAS PubMed.
- J. Shen, G. Chen, A.-M. Vu, W. Fan, O. S. Bilsel, C.-C. Chang and G. Han, Adv. Opt. Mater., 2013, 1, 644–650 CrossRef.
- T. Gavrilovic, D. Jovanovic, V. Lojpur and M. Dramicanin, Sci. Rep., 2014, 4, 4209 Search PubMed.
- A. K. Soni, R. Dey and V. K. Rai, RSC Adv., 2015, 5, 34999–35009 RSC.
- F. Shi and Y. Zhao, J. Mater Chem. C., 2014, 2, 2198–2203 RSC.
- C. Liu, H. Wang, X. Zhang and D. Chen, J. Mater. Chem., 2009, 19, 489–496 RSC.
- K. Liu, X. Liu, Q. Zeng, Y. Zhang, L. Tu, T. Liu, X. Kong, Y. Wang, F. Cao, S. A. G. Lambrechts, M. C. G. Aalders and H. Zhang, ACS Nano, 2012, 6, 4054–4062 CrossRef CAS PubMed.
- B. Voß, J. Nordmann, A. Uhl, R. Komban and M. Haase, Nanoscale, 2013, 5, 806–812 RSC.
- F. Wang, R. Deng, J. Wang, Q. Wang, Y. Han, H. Zhu, X. Chen and X. Liu, Nat. Mater., 2011, 10, 968–973 CrossRef CAS PubMed.
- J. Shan, M. Uddi, N. Yao and Y. Ju, Adv. Funct. Mater., 2010, 20, 3530–3537 CrossRef CAS.
- K. Wu, J. Cui, X. Kong and Y. Wang, J. Appl. Phys., 2011, 110 Search PubMed.
- J. Suyver, J. Grimm, K. Krämer and H. Güdel, J. Lumin., 2005, 114, 53–59 CrossRef CAS.
- F. Vetrone, J. C. Boyer, J. A. Capobianco, A. Speghini and J. Bettinelli, J. Phys. Chem. B, 2003, 107, 1107–1112 CrossRef CAS.
- A. Shalav, B. S. Richards, K. Krämer and H. Güdel, IEEE Photovoltaic Specialists Conference, 2005, 114–117 CAS.
- J.-C. G. Bünzli and S. V. Eliseeva, Chem. Soc. Rev., 2010, 39, 189–227 RSC.
- J. M. F. van Dijk and M. F. H. Schuurmans, J. Chem. Phys., 1983, 78, 5317–5323 CrossRef CAS.
- Y. Guyot, H. Manaa, J. Y. Rivoire and R. Moncorgé, Phys. Rev. B: Condens. Matter Mater. Phys., 1995, 51, 784–799 CrossRef CAS.
- R. Balda, J. I. Pena, M. A. Arriandiaga and J. Fernández, Opt. Express, 2010, 18, 13842–13850 CrossRef CAS PubMed.
- L. Lu, Q. Nie, T. Xu, S. Dai, X. Shen and X. Zhang, J. Lumin., 2007, 126, 677–681 CrossRef CAS.
- A. S. Gouveia-Neto, E. B. da Costa, P. V. dos Santos, L. A. Bueno and S. J. L. Ribeiro, J. Appl. Phys., 2003, 94, 5678 CrossRef CAS.
- D. Wawrzynczyk, A. Bednarkiewicz, M. Nyk, W. Strek and M. Somac, Nanoscale, 2012, 4, 6959–6961 RSC.
- L. C. Courrol, I. M. Ranieri, L. V. G. Tarelho, S. L. Baldochi, L. Gomes and N. D. V. Junior, J. Appl. Phys., 2005, 98, 113504 CrossRef.
- R. B. Anderson, S. J. Smith, P. S. May and M. T. Berry, J. Phys. Chem. Lett., 2014, 5, 36–42 CrossRef CAS PubMed.
- D. T. Klier and M. U. Kumke, J. Phys. Chem. C, 2015, 119, 3363–3373 CAS.
- W. T. Carnall, P. R. Fields and B. G. Wybourne, J. Chem. Phys., 1965, 42, 3797–3806 CrossRef CAS.
- A. Shalav and B. S. Richards, IEEE Transactions on Electron Devices, 2007, 54, 2679–2684 CrossRef.
- L. H. Fischer, G. S. Harms and O. S. Wolfbeis, Angew. Chem., Int. Ed., 2011, 50, 4546–4551 CrossRef CAS PubMed.
- C. T. Xu, Q. Zhan, H. Liu, G. Somesfalean, J. Qian, S. He and S. Andersson-Engels, Laser Photonics Rev., 2013, 7, 663–697 CrossRef CAS.
- Y. Tian, B. Tian, C. Cui, P. Huang, L. Wang and B. Chen, Opt. Lett., 2014, 39, 4164–4167 CrossRef CAS PubMed.
- M. Debasu, Adv. Mater., 2013, 25, 3254–3258 Search PubMed.
- L. Hao and L. Y. Wang, Chin. Sci. Bull., 2013, 58, 4051–4056 CrossRef.
- W. Chen, K. D. Long, H. Yu, Y. Tan, J. S. Choi, B. A. Harley and B. T. Cunningham, Analyst, 2014, 139, 5954–5963 RSC.
- Z.-H. Chen, Y. Wang, Y. Yang, N. Qiao, Y. Wang and Z. Yu, Nanoscale, 2014, 6, 14708–14715 RSC.
Footnotes |
| † Electronic supplementary information (ESI) available: DLS analysis of UCNPNd,OA NaYF4:Yb/Er (17/3 mol%) with a Nd3+ dopant concentration of 2 mol% and UCNP. Excitation emission matrices of UCNPNd are shown. Power dependence of the Er3+ transitions G1, G2 and R of oleic acid capped UCNP at different excitation wavelength are shown as well as the temperature dependence of the upconversion luminescence of UCNPNd dissolved in water at different irradiation wavelength and thermostat temperature over time. See DOI: 10.1039/c5ra11502g |
| ‡ These authors equally contributed to this study. |
|
| This journal is © The Royal Society of Chemistry 2015 |
Click here to see how this site uses Cookies. View our privacy policy here. 
 Open Access Article
 This Open Access Article is licensed under a