Energy transfer properties of a novel boron dipyrromethene–perylenediimide donor–acceptor dyad

Eugeny A. Ermilov*a, Martin Schlaka, Ronald Steffena, Xiao-Qiong Liub, Jian-Yong Liub and Beate Rödera
aInstitut für Physik, Photobiophysik, Humboldt-Universität zu Berlin, Newtonstr. 15, D-12489 Berlin, Germany. E-mail: ermilov@physik.hu-berlin.de; Fax: +49 3020937666; Tel: +49 3020937935
bState Key Laboratory of Photocatalysis on Energy and Environment & Fujian Engineering Research Center of Functional Materials, College of Chemistry, Fuzhou University, Fuzhou 350002, P. R. China

Received 28th May 2015 , Accepted 31st July 2015

First published on 31st July 2015


Abstract

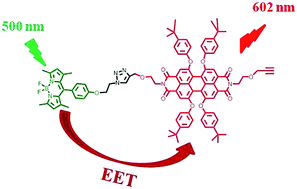
Borron dipyrromethenes (BDPs) and perylenediimides (PDIs) are excellent building blocks for the design of artificial light-harvesting systems. In the present work, we report the results of photophysical studies of a novel dyad, in which BDP and PDI chromophores are covalently linked to each other via a 4-(ethoxymethyl)-1-(phenoxyethyl)-1,2,3-triazole unit. It was found that efficient excitation energy transfer (EET) from the initially photoexcited BDP moiety to the PDI chromophore in its ground state resulted in strong quenching of the BDP first excited singlet state as well as in the appearance of the PDI fluorescence. The efficiency of EET was calculated to be 0.99 and the rate of this process was found to be 1.85 × 10¹⁰ s−1.

Introduction

Excitation energy transfer (EET) between organic molecules is a vital process in nature and of the utmost importance in complex molecular systems for photonic applications. In photosynthetic organisms the electromagnetic energy captured by chromophore-rich antenna proteins is delivered via an efficient EET process to a reaction centre where a multi-step electron transfer reaction occurs, leading to conversion of the absorbed photon energy into chemical energy.1 EET can also be exploited in artificial photosynthetic systems,2–5 in molecular devices and machines for information processing,6–8 and in molecular-based sensors for biomedical research.9–12 A great variety of donor–acceptor systems with different combination of chromophores have been reported in the literature with the aim of enhancing their energy transfer efficiency and facilitating subsequent use in generation of chemical and electrical potential energies.2–5,13–18 Among the different chromophores, boron dipyrromethenes (BDP) and perylenediimides (PDI) are of particular interest. The former exhibit large extinction coefficients around 500 nm, high fluorescence quantum yields, reasonably long excited singlet state lifetimes, good solubility in many solvents and excellent photostability.19,20 The latter are well-known and widely used chromophores with moderate high absorption in green-red spectral region (spectral position of the absorption band can be tuned by modification of the PDI structure), high fluorescence quantum yield, high photostability and negligible intersystem crossing (ISC) efficiency.21 These advantageous characteristics make BDP and PDI excellent candidates for application in artificial photosynthetic systems. A substantial number of systems where BDP or PDI are coupled to other chromophores, such as porphyrins, C60, phthalocyanines, Fe, carbazoles, just to mention a few, were synthesized as models for applications in e.g. solar cells, molecular electronics and photonics devices.21–31 A combination of BDP and PDI chromophores can extend the absorption of the resulting multicomponent molecular system to better overlap with the solar spectrum. The fluorescence of BDP can also overlap with the absorption spectrum of PDI, which is desirable for efficient intramolecular energy transfer. As a result, the conjugation of these two classes of compounds is expected to give excellent light-harvesting systems. However, BDP–PDI molecular systems remain rare. Akkaya et al. described the synthesis of two dendrimer-like BDP–PDI dyes where tetra-alkynyl-substituted at the bay positions PDI was coupled to BDP chromophores via click reactions, and it was demonstrated that light energy absorbed by BDP units is efficiently funneled to the PDI core.32,33

In the present paper we report synthesis and detailed photophysical studies of a BDP–PDI donor–acceptor dyad (see Fig. 1). In this dyad, the BDP moiety was linked to an amide position of PDI core with four aryloxy groups on the 1, 6, 7, 12 bay positions. Introduction of aryloxy groups not only increased the solubility, but also significantly modified the molecular-level optical properties of PDI, which led to the major absorption of BDP to be complementary to that of PDI. This is desirable for an efficient light-harvesting system. Moreover, 4-(ethoxymethyl)-1-(phenoxyethyl)-1,2,3-triazole linker hinders strong coupling between BDP and PDI moieties in their ground as well as excited states, thus preventing possible unwanted energy losses via e.g. strong excitonic interactions between BDP and PDI chromophores in the dyad.


image file: c5ra10077a-f1.tif
Fig. 1 The structure of the BDP–PDI dyad as well as the BDP and PDI reference compounds.

The BDP–PDI dyad exhibits a highly efficient EET as has been shown by steady-state and time-resolved spectroscopic techniques.

Experimental

General

All the reactions were performed under an atmosphere of nitrogen. Tetrahydrofuran (THF), toluene, and dichloromethane were distilled from sodium benzophenone ketyl, and calcium hydride, respectively. Chromatographic purifications were performed on silica gel (Qingdao Ocean, 200–300 mesh) columns with the indicated eluents. All other solvents and reagents were of reagent grade and used as received. 1,6,7,12-Tetra(p-tertiobutyl)phenoxyperylene-3,4:9,10-perylenetetracarboxylic dianhydride (1),34 2-(prop-2-ynyloxy)ethanamine (2)35 and BDP36 were prepared as described. All spectroscopic investigations were performed at room temperature (298 K) with toluene (Sigma-Aldrich) of spectroscopic grade (without further purification) as a solvent.

1H and 13C{1H} NMR spectra were recorded on a Bruker AVANCE II 400 (1H, 400; 13C, 100.6 MHz) spectrometer in CDCl3. Spectra were referenced internally using the residual solvent [1H: CDCl3 (δ 7.26)] or solvent [13C: CDCl3 (δ 77.0)] resonances relative to SiMe4. Matrix assisted laser desorption/ionization time-of-flight (MALDI-TOF) mass spectra were taken on a Bruker Daltonics Autoflex MALDI-TOF mass spectrometer.

Preparation of the dyad

To a solution of 1,6,7,12-tetra(p-tertiobutyl)phenoxyperylene-3,4:9,10-perylenetetracarboxylic dianhydride (1)34 (0.32 g, 0.32 mmol) in toluene were added 2-(prop-2-ynyloxy)ethanamine (2) (0.32 g, 3.23 mmol) and imidazole (0.15 g, 2.20 mmol). The resulting mixture was refluxed for 16 h. After cooling to room temperature the mixture was washed by water. The organic extracts were collected, dried over anhydrous MgSO4, filtered and evaporated to dryness under reduced pressure. The crude product was purified by silica gel column chromatography using CH2Cl2/petroleum ether (1[thin space (1/6-em)]:[thin space (1/6-em)]1 v/v) as the eluent to give PDI as a purple red solid (0.26 g, 71%). 1H NMR (400 MHz, CDCl3): δ = 8.23 (s, 4H, ArH), 7.23 (d, J = 8.4 Hz, 8H, ArH), 6.83 (d, J = 8.4 Hz, 8H, ArH), 4.40 (s, 4H, OCH2), 4.16 (br s, 4H, OCH2), 3.84 (t, J = 5.0 Hz, 4H, NCH2), 2.35 (s, 2H, alkyne-H), 1.29 (s, 36H, CH3) ppm; 13C{1H} NMR (100.6 MHz, CDCl3): δ = 162.4, 162.3, 135.5, 133.1, 133.0, 131.5, 128.8, 128.7, 123.4, 123.3, 123.2, 79.5 74.9, 67.9, 66.4, 58.1, 39.8, 39.7 ppm; HRMS (MALDI-TOF): m/z calcd for C74H70N2O10 [M]+: 1146.5030, found 1146.5048.

Preparation of the BDP–PDI dyad

A mixture of BDP (38 mg, 0.09 mmol), PDI (140 mg, 0.12 mmol), CuSO4·5H2O (10 mg, 0.04 mmol), and sodium ascorbate (20 mg, 0.10 mmol) in a mixture of CHCl3 (2 mL), t-BuOH (2 mL) and water (2 mL) was stirred at room temperature for 24 h. After removing the volatiles in vacuo, the residue was mixed with CHCl3 (30 mL) and water (30 mL). The aqueous layer was separated and extracted with CHCl3 (30 mL × 3). The combined organic fractions were dried over anhydrous Na2SO4, then filtered. The filtrate was collected and evaporated to dryness. The residue was purified by silica gel column chromatography using CH2Cl2/methanol (20[thin space (1/6-em)]:[thin space (1/6-em)]1, v/v) as the eluent to give BDP–PDI dyad as a purple red solid (60 mg, 42%). 1H NMR (400 MHz, CDCl3): δ = 8.24 (s, 2H, ArH), 8.22 (s, 2H, ArH), 7.71 (s, 1H, triazole-H), 7.23 (d, J = 8.0 Hz, 8H, ArH), 7.11 (d, 2H, J = 7.6 Hz, ArH), 6.88 (d, 2H, J = 7.6 Hz, ArH), 6.81 (d, J = 6.4 Hz, 8H, ArH), 5.93 (s, 2H, pyrrole-H), 4.72 (s, 2H, OCH2), 4.69 (s, 2H, OCH2), 4.54–4.30 (m, 6H, OCH2), 4.16 (br s, 2H, NCH2), 3.92–3.72 (m, 4H, NCH2), 2.53 (s, 6H, CH3), 2.35 (s, 1H, alkyne-H), 1.34 (s, 6H, CH3), 1.29 ppm (s, 36H, CH3); 13C NMR (100.6 MHz, CDCl3): δ = 163.6, 158.4, 156.1, 156.0, 155.5, 153.0, 152.9, 147.4, 145.4, 143.1, 141.3, 133.0, 133.0, 131.8, 129.5, 128.2, 126.8, 123.9, 122.5, 122.4, 121.2, 120.8, 120.6, 120.1, 120.1, 119.6, 119.4, 115.1, 79.6, 74.8, 67.3, 66.7, 66.3, 64.5, 58.1, 49.7, 39.5, 34.5, 31.6, 14.8, 14.7 ppm; HRMS (MALDI-TOF): m/z calcd for C95H92BF2N7NaO11 [M + Na]+ 1578.6814, found 1578.6746.

Steady-state absorption and fluorescence spectroscopy

The ground-state absorption spectra were recorded using a commercial spectrophotometer Shimadzu UV-1800. Steady-state fluorescence spectra were measured in 1 cm × 1 cm quartz cells using a combination of a cw-xenon lamp (XBO 150) and a monochromator (Lot-Oriel, bandwidth 10 nm) for excitation and a polychromator with a cooled CCD matrix (Lot-Oriel, Instaspec IV) as the detector system in a conventional 0°/90° measurement geometry. For determination of the fluorescence quantum yields, the following expression was used:
 
image file: c5ra10077a-t1.tif(1)
where Φxfl, Sxfl, ODx(λexc) and Φreffl, Sreffl, ODref (λexc) are the fluorescence quantum yield, the integrated fluorescence intensity, and the optical density at the excitation wavelength, λexc, of a sample and a reference substance respectively, nx and nref are the refractive index of the solvent used for the sample (toluene, nx = 1.497) and the reference (ethanol, nref = 1.36), respectively. Rhodamine 6G in ethanol was used as the reference (Φfl = 0.95).37 In order to avoid reabsorption of the fluorescence light passing through the samples their optical density at the absorption maximum was set to be lower than 0.1.

Time-resolved fluorescence spectroscopy

The time-correlated single photon counting (TCSPC) technique was used to measure time-resolved fluorescence of the dyad and the reference compounds. The experimental setup was previously described.38 The pulsed, frequency doubled, linear polarized radiation of a Nd:VO4 laser (Cougar, Time Bandwidth Products) with a wavelength of 532 nm, a pulse width of 12 ps and a repetition rate of 60 MHz was used for excitation of the samples. Fluorescence was detected under a “magic” polarization angle39 relative to excitation with a thermo-electrical cooled micro-channel plate (R3809-01, Hamamatsu). Detection wavelength was chosen by a computer-controlled monochromator (77200, Lot-Oriel). Electrical signals were processed by a PCI TCSPC controller card (SPC630, Becker&Hickl). The instrument response function was 42 ps, as measured at an excitation wavelength with Ludox. Data were analysed by a home-made program. The Nelder–Mead simplex algorithm40 was used for optimisation of the nonlinear parameters, and the support plane approach39 to compute error estimates of the decay times.

Picosecond transient absorption spectroscopy

To measure the transient absorption spectra, a white light continuum was generated as a test beam in a cell with a D2O/H2O mixture using intense 25 ps pulses from a Nd3+:YAG laser (Pl 2143A, Ekspla) at 1064 nm. Before passing through the sample, the continuum radiation was split to obtain a reference spectrum. The transmitted as well as the reference beams were focused into two optical fibres and were recorded simultaneously at different traces on a cooled CCD-matrix (Lot-Oriel, Instaspec IV). Tuneable radiation from an OPG/OPA (Ekspla PG 401/SH, tuning range 200–2300 nm) pumped by the third harmonic of the same laser was used as an excitation beam. The mechanical delay line allowed the measurement of light-induced changes of the absorption spectrum at different delays up to 15 ns after excitation. Analysis of experimental data was performed using the compensation method.41

Femtosecond transient absorption spectroscopy

Femtosecond transient absorption spectroscopy was conducted with a home build system42 based on a 130 fs seed laser (Coherent, Mira 900) at 800 nm and an amplified Ti:sapphire laser (Spitfire, Spectra Physics, 1 kHz repetition rate). Part of the beam was used to generate excitation pulses by means of an optical parametric amplifier (TOPAS 800, Light Conversion). The remaining energy was sent through a variable attenuator, a linear delay line stage and a λ/2 plate before entering a 2 mm thick CaF2 crystal for white light generation. The variable attenuator was adjusted as to generate polarization clean continuum probe pulses. Two equivalent detector systems based on two Oriel MS125 polychromators and two Hamamatsu S5930-512S NMOS linear image sensors were used for the detection of signal and reference beams. The custom build control electronics, in combination with a chopper in the excitation beam path, allowed for acquiring difference spectra single-shot referencing mode with real-time display. The sample (about 5 mL) was flown by a pump through a home-made flow cell having a light pass of 200 μm.

Results

Synthesis

The synthetic route for the BDP–PDI dyad is shown in Scheme 1. Treatment of 1,6,7,12-tetra(p-tertiobutyl)phenoxyperylene-3,4:9,10-perylenetetracarboxylic dianhydride (1) with amine 2 in the presence of imidazole in toluene afforded PDI in 71% yield. This compound then underwent a typical click reaction with BDP,36 which was prepared as described, in the presence of CuSO4·5H2O and sodium ascorbate to give the BDP–PDI dyad in 42% yield. It was fully characterized by various spectroscopic methods including 1H and 13C NMR (ESI) and high-resolution mass spectra (HRMS).
image file: c5ra10077a-s1.tif
Scheme 1 The synthetic route of the BDP–PDI dyad.

Steady-state measurements

The UV/Vis absorption spectra of the dyad as well as the reference BDP and PDI compounds in toluene are presented in Fig. 2. BDP shows a strong absorption with a maximum at 504 nm which can be attributed to the S0,0 → S1,0 transition. PDI features the π–π* absorption along the long molecular axis with a maximum at 575 nm for the S0,0 → S1,0 transition. The minor peaks at shorter wavelengths are vibronic progressions of the same electronic transition. A broad featureless absorption band around 450 nm is attributed to the π–π* transition along the short molecular axis.43
image file: c5ra10077a-f2.tif
Fig. 2 UV/Vis absorption spectra of the BDP–PDI dyad and the reference BDP and PDI chromophores solved in toluene. The concentration for all samples was 6 μM.

The absorption of the BDP–PDI dyad can be interpreted qualitatively as a superposition of the absorption of its parts (see Fig. 2). It can be seen that the absorption positions of the dyad are essentially the same as those of the reference compounds, showing that the BDP and PDI chromophores in this dyad exhibit negligible ground-state interactions.

Both BDP and PDI exhibit a strong fluorescence signal (Fig. 3). The fluorescence maximum of BDP is at 514 nm thus displaying a small Stokes shift of 386 cm−1. PDI shows a broad fluorescence band which mirrors the vibronic progressions of the corresponding absorption spectrum with a Stokes shift of 780 cm−1 (fluorescence maximum is at 602 nm). The corresponding fluorescence quantum yield values were calculated to be 0.83 and 0.81 for BDP and PDI, respectively, by using Rhodamine 6G in ethanol as the reference (ΦR6Gfl = 0.95).37


image file: c5ra10077a-f3.tif
Fig. 3 Fluorescence spectra of the BDP–PDI dyad (upon BDP-part excitation at λexc = 480 nm), and the reference BDP (λexc = 480 nm) and PDI (λexc = 550 nm).

Upon excitation of the dyad at 480 nm, where the BDP moiety primary absorbs, the fluorescence of the BDP-part of the dyad was strongly reduced compared to the reference BDP compound. At the same time, a strong emission band with maximum at 603 nm appears which is attributed to the PDI-part fluorescence (see Fig. 3). The latter is the clear indicator of the EET process between the initially photoexcited energy donor (BDP moiety) and the energy acceptor (PDI in its ground state). The fluorescence quantum yield of BDP-part emission does not exceed 0.01. At the same time the fluorescence quantum yield of PDI emission was found to be 0.62 which is lower compared to the corresponding value measured for the reference PDI compound. Upon direct excitation of the PDI moiety of the dyad at 550 nm the PDI-part fluorescence quantum yield was found to be 0.64 and this value is very close to that one measured in the case of BDP-part excitation.

Time-resolved measurements

The time-resolved properties of the BDP–PDI dyad, and the reference BDP and PDI compounds were investigated using the time-correlated single photon counting (TCSPC) technique (for time-resolved fluorescence measurements) as well as the transient absorption spectroscopy (TAS) with picosecond and femtosecond time resolution.

The fluorescence decays of the reference BDP and PDI compounds were found to be mono-exponential with lifetimes of 3.1 ns and 6.0 ns respectively. As expected, the lifetime of the first excited singlet state of the BDP moiety in the BDP–PDI dyad decreased significantly and was measured to be 50 ps. The fluorescence signal at 605 nm (PDI-part emission) was found to decay mono-exponentially with a lifetime of 4.74 ns, which is shorter compared to that of the reference PDI.

In order to obtain information about the non-fluorescent intermediates (such as e.g. formation of triplet and/or charge-separated state) and the recovery of the ground state population after photo-excitation, transient absorption (TA) spectra of all compounds were firstly recorded using ps-TAS technique. The results are presented in Fig. 4. The TA spectrum of the reference BDP shows strong negative ΔOD band with a minimum at around 508 nm which is due to superposition of ground state bleaching and transient amplification signals (Fig. 4a). Three transitions were resolved in the TA spectrum of the reference PDI (Fig. 4b), namely ground state bleaching and transient amplification (broad negative band at around 600 nm), and transient absorption S1 → Sn (positive ΔOD signal in red spectral region). Using the compensation method,41 the recovery of the ground state population of the reference compounds was found to be mono-exponential with characteristic times similar to the fluorescence decay times. Moreover, the intersystem crossing (ISC) S1 → T1 quantum yields were estimated to be zero for both BDP and PDI chromophores.


image file: c5ra10077a-f4.tif
Fig. 4 Transient absorption spectra of BDP (a), PDI (b) and the BDP–PDI dyad (c) in toluene at different delay times after excitation. Excitation of the dyad was performed at 470 nm (BDP-part absorption). For comparison, the corresponding absorption spectra are also shown.

Fig. 4c shows TA spectra of the BDP–PDI dyad in toluene upon excitation of the BDP moiety at 470 nm. Two negative ΔOD signals (with minima at around 508 and 600 nm, respectively) and one broad TA band with positive amplitude between 680 and 900 nm are seen in the TA spectra of the dyad. Based on their spectral positions and shapes (see Fig. 4a and b), they can be attributed to the bleaching of the BDP ground state absorption (the negative ΔOD signal at around 508 nm) and to the ground state depletion and transient absorption of the PDI moiety (the negative ΔOD peak at around 600 nm as well as broad positive TA band). The recovery of the BDP-part ground state population was very fast and could not be fitted adequately due to limited time resolution of the ps-TAS setup (ca. 35 ps). At the same time, repopulation of the ground state of the PDI moiety occurs mono-exponentially with the characteristic time of 4.5 ± 0.2 ns. It is worth to mention, that no remaining TA signal was observed at delay time of 15 ns after photoexcitation, and, therefore, one can conclude that ISC quantum yield remains zero in the BDI–PDI dyad.

Transient absorption spectroscopy with femtosecond time resolution (fs-TAS) was used to investigate fast excitation energy transfer between BDP and PDI moieties in the dyad. The corresponding TA spectra of the dyad at different delay times after excitation at 475 nm (BDP-part absorption) are shown in Fig. 5a. The EET process corresponds to the fast decrease of the negative ΔOD band at 508 nm (overlap of ground state bleaching and transient amplification of the BDP moiety) as well as simultaneous rise of the negative ΔOD signal at around 600 nm (corresponds to the depletion of the PDI ground state population as well as PDI transient amplification). After 140 ps the former band has completely vanished (see Fig. 5a and b) whereas the latter one has reached its maximum. The analysis has shown, that the decay of the BDP first excited state population as well as the recovery of its ground state occurs with averaged characteristic time of 54 ps (see Discussion part for details), which correlates very good with the fluorescence decay time of the BDP moiety of the dyad measured by TCSPC technique.


image file: c5ra10077a-f5.tif
Fig. 5 (a) fs-TA spectra of the BDP–PDI dyad in toluene at different delay times after excitation at 475 nm (BDP-part absorption). The corresponding absorption spectra of BDP and PDI are shown for comparison. (b) Kinetics of the ground state bleaching signal of the BDP moiety at 495 nm and its fit according to the eqn (4).

Discussion

As it is clearly seen (Fig. 2 and 3) that the absorption and fluorescence spectra of the BDP–PDI dyad can be described as a superposition of the corresponding spectra of the reference BDP and PDI compounds. Therefore, BDP and PDI moieties of the dyad are neither strongly coupled in the ground state nor in the first excited singlet state.

To explain the above-presented results, efficient EET process from initially photoexcited BDP moiety to the PDI chromophore in its ground state was taken into account. EET via excitonic mechanism requires strong coupling between chromophores, and, since this is not the case in the BDP–PDI dyad, was excluded from further discussion. From the general point of view, two mechanisms of EET in the dyad are possible, namely the exchange (Dexter)44 and the dipole–dipole (Förster)45 mechanisms. An indispensable condition for efficient exchange EET is an overlap of the electron clouds of the participating in the transfer process molecules, and the probability of EET falls exponentially with increasing the distance between the donor and acceptor chromophores. The centre-to-centre distance between the BDP and PDI moieties of the dyad estimated from molecular dynamics simulations in vacuum (using the HyperChem 5.02 programme package) was found to be ca. 23 Å. This distance is far enough to prevent overlap of electronic orbitals of the energy donor and acceptor species, thus making exchange energy transfer unfavourable. Therefore, the results of the present study were analysed using the Förster dipole–dipole approach.

In order to estimate the efficiency of EET, the Förster radius, R0, was calculated using eqn (2)45–47

 
image file: c5ra10077a-t2.tif(2)
where n is the refractive index of the solvent used (i.e. 1.497 for toluene), Φfl is the fluorescence quantum yield of an energy donor in absence of an acceptor, ε([small nu, Greek, tilde]) is the molar absorbance of the acceptor at wavenumber [small nu, Greek, tilde], Ifln([small nu, Greek, tilde]) is the donor's normalized fluorescence spectrum, NA is Avogadro's number and κ2 is the averaged orientation factor, which was approximated as 2/3 due to the flexibility of the linker between BDP and PDI moieties of the dyad. The spectral overlap between fluorescence spectrum of the energy donor (BDP) and absorption spectrum of the energy acceptor (PDI) is shown in Fig. S5 (ESI). Using the spectroscopic data, the value of R0 was estimated to be ca. 49 Å. It is seen that the Förster radius is much greater than the centre-to-centre distance between the chromophores within the dyad and, therefore, the probability of EET is very high.

The energy transfer rate between two particular donor and acceptor chromophores separated by the distance r, kEET(r), can be expressed by

 
image file: c5ra10077a-t3.tif(3)
where τD0 is the lifetime of the first excited singlet state of the donor molecule in absence of the acceptor. High flexibility of the linker between BDP and PDI moieties in the dyad allows for variation of the distance between these two chromophores resulting, and, in turn, in variation of kEET. This should be taken into account when fitting the decay of BDP ground state bleaching in fs-TAS experiments. This could be done by a probability-weighted fit for the range of possible BDP–PDI distances. It is generally not possible to resolve the shape of the distance distribution from spectroscopic data. One has to set the shape in advance and run the analysis with a limited set of parameters. The kinetics of the BDP ground state bleaching in this case could be written in the following form:
 
image file: c5ra10077a-t4.tif(4)
where A is a constant and P(r) is the Gaussian distribution
 
image file: c5ra10077a-t5.tif(5)
r〉 is the mean of the distribution, σ is its standard deviation (it should be mentioned, that the full width at half maximum (FWHM) of the distribution is FWHM = 2.354σ), and the integration limit rmax is the maximal distance between BDP and PDI chromophores in the dyad. The fit of the BDP ground state population recovery (fs-TAS experiment, detection wavelength is 495 nm) with eqn (4) and (5) resulted in 〈r〉 = 18.9 Å and FWHM = 12.9 Å (see Fig. 5b). This is in very good agreement with the value obtained be geometric optimization of the BDP–PDI structure in MD simulations. It is worth to mention, that analysis of the rise kinetics of the PDI ground state bleaching (negative ΔOD band at around 600 nm) as well as its induced absorption (positive ΔOD band at wavelengths > 700 nm, see Fig. 5a) resulted in the same 〈r〉 and FWHM values. The average rate of EET, 〈kEET〉, was calculated to be 1.85 × 10¹⁰ s−1. The efficiency of EET BDP* → PDI, ΦEET = 〈kEET〉/(1/τD0 + 〈kEET〉), was estimated be 0.99.

The lifetime of the first excited singlet state of the PDI moiety of the BDP–PDI dyad is reduced to τdyadPDI = 4.7 ns compared to that of the reference PDI (τPDI = 6.0 ns). This shortening of the fluorescence lifetime is in good agreement with the reduction of the fluorescence quantum yield of the PDI-part of the dyad, and is due to increased probability of non-radiative internal conversion for the PDI moiety in the dyad. Indeed, one can carry out simple estimations as follows:

 
image file: c5ra10077a-t6.tif(6)
where ΦdyadPDI and ΦPDI are the fluorescence quantum yields of the PDI moiety in the dyad and the reference PDI in toluene. By substituting the experimental values of ΦPDI = 0.81, τPDI = 6.0 ns and τdyadPDI = 4.7 ns into eqn (6), the fluorescence quantum yield of the PDI moiety in the BDP–PDI dyad, ΦdyadPDI, was calculated to be 0.63, which is in good agreement with the value obtained by steady-state fluorescence spectroscopy (0.64). Taking into account, that kPDI,dyadnr = 1/τdyadPDIΦPDIPDI and kPDInr = (1 − ΦPDI)/τPDI, the rates of nonradiative relaxation of the first excited singlet state of the PDI moiety in the dyad, kPDI,dyadnr and of the reference PDI, kPDInr, were calculated to be 7.7 × 10⁷ s−1 and 3.2 × 10⁷ s−1, respectively. It is seen, that kPDI,dyadnr is approximately twofold faster than kPDInr and is due to weak interactions between BDP and PDI moieties in the dyad.

Conclusion

In summary, we have prepared a novel BDP–PDI donor–acceptor dyad and studied in details its photophysical properties. It was shown, that efficient EET from initially photoexcited BDP moiety to the PDI chromophore in its ground state results in strong quenching of the BDP first excited singlet state as well as in appearance of the PDI fluorescence. The efficiency of EET was calculated to be 0.99 and the rate of this process was found to be 1.85 × 10¹⁰ s−1. This dyad could therefore be used as an energy antenna in artificial photosynthesis systems.

Acknowledgements

This work was supported by the National Natural Science Foundation of China (Projects No. 21471033 and 21101028) and by the Independent Research Project of State Key Laboratory of Photocatalysis on Energy and Environment (Project No. 2014C04).

References

  1. R. K. Clayton, Photosynthesis: Physical Mechanisms and Chemical Patterns, Cambridge University Press, New York, 1980 Search PubMed .
  2. V. Balzani, A. Credi and M. Venturi, ChemSusChem, 2008, 1, 26–58 CrossRef CAS PubMed .
  3. D. Gust, T. A. Moore and A. L. Moore, Faraday Discuss., 2012, 155, 9–26 RSC .
  4. L. Giribabu and K. Sudhakar, J. Photochem. Photobiol., A, 2015, 296, 11–18 CrossRef CAS PubMed .
  5. J.-Y. Liu, E. A. Ermilov, B. Röder and D. K. P. Ng, J. Porphyrins Phthalocyanines, 2013, 17, 831–835 CrossRef CAS .
  6. F. Laquai, Y.-S. Park, J.-J. Kim and T. Basché, Macromol. Rapid Commun., 2009, 30, 1203–1231 CrossRef CAS PubMed .
  7. D. Holten, D. F. Bocian and J. S. Lindsey, Acc. Chem. Res., 2001, 35, 57–69 CrossRef PubMed .
  8. V. Balzani, A. Credi and M. Venturi, Chem.–Eur. J., 2008, 14, 26–39 CrossRef CAS PubMed .
  9. R. Moussa, A. Baierl, V. Steffen, T. Kubitzki, W. Wiechert and M. Pohl, J. Biotechnol., 2014, 191, 250–259 CrossRef CAS PubMed .
  10. I. L. Medintz, A. R. Clapp, H. Mattoussi, E. R. Goldman, B. Fisher and J. M. Mauro, Nat. Mater., 2003, 2, 630–638 CrossRef CAS PubMed .
  11. A. I. Zamaleeva, M. Collot, E. Bahembera, C. Tisseyre, P. Rostaing, A. V. Yakovlev, M. Oheim, M. de Waard, J. M. Mallet and A. Feltz, Nano Lett., 2014, 14, 2994–3001 CrossRef CAS PubMed .
  12. O. Adegoke and T. Nyokong, Synth. Met., 2014, 188, 35–45 CrossRef CAS PubMed .
  13. B. Brizet, N. Desbois, A. Bonnot, A. Langlois, A. Dubois, J.-M. Barbe, C. P. Gros, C. Goze, F. Denat and P. D. Harvey, Inorg. Chem., 2014, 53, 3392–3403 CrossRef CAS PubMed .
  14. R. Menting, J.-Y. Liu, Y.-S. Huang, D. K. P. Ng, B. Roder and E. A. Ermilov, Phys. Chem. Chem. Phys., 2013, 15, 6912–6919 RSC .
  15. A. O. Bozdemir, S. Erbas-Cakmak, O. O. Ekiz, A. Dana and E. U. Akkaya, Angew. Chem., Int. Ed., 2011, 50, 10907–10912 CrossRef PubMed .
  16. M.-S. Choi, T. Yamazaki, I. Yamazaki and T. Aida, Angew. Chem., Int. Ed., 2004, 43, 150–158 CrossRef CAS PubMed .
  17. E. A. Ermilov, J.-Y. Liu, D. K. P. Ng and B. Roder, Phys. Chem. Chem. Phys., 2009, 11, 6430–6440 RSC .
  18. E. A. Ermilov, S. Tannert, T. Werncke, M. T. M. Choi, D. K. P. Ng and B. Röder, Chem. Phys., 2006, 328, 428–437 CrossRef CAS PubMed .
  19. A. Loudet and K. Burgess, Chem. Rev., 2007, 107, 4891–4932 CrossRef CAS PubMed .
  20. G. Ulrich, R. Ziessel and A. Harriman, Angew. Chem., Int. Ed., 2008, 47, 1184–1201 CrossRef CAS PubMed .
  21. S. Suzuki, M. Kozaki, K. Nozaki and K. Okada, J. Photochem. Photobiol., C, 2011, 12, 269–292 CrossRef CAS PubMed .
  22. P. E. Hartnett, A. Timalsina, H. S. S. R. Matte, N. Zhou, X. Guo, W. Zhao, A. Facchetti, R. P. H. Chang, M. C. Hersam, M. R. Wasielewski and T. J. Marks, J. Am. Chem. Soc., 2014, 136, 16345–16356 CrossRef CAS PubMed .
  23. J.-Y. Liu, Y. Huang, R. Menting, B. Roder, E. A. Ermilov and D. K. P. Ng, Chem. Commun., 2013, 49, 2998–3000 RSC .
  24. S. I. Yang, S. Prathapan, M. A. Miller, J. Seth, D. F. Bocian, J. S. Lindsey and D. Holten, J. Phys. Chem. B, 2001, 105, 8249–8258 CrossRef CAS .
  25. C. Kirmaier, H.-E. Song, E. Yang, J. K. Schwartz, E. Hindin, J. R. Diers, R. S. Loewe, K.-Y. Tomizaki, F. Chevalier, L. Ramos, R. R. Birge, J. S. Lindsey, D. F. Bocian and D. Holten, J. Phys. Chem. B, 2010, 114, 14249–14264 CrossRef CAS PubMed .
  26. Z. E. X. Dance, S. M. Mickley, T. M. Wilson, A. B. Ricks, A. M. Scott, M. A. Ratner and M. R. Wasielewski, J. Phys. Chem. A, 2008, 112, 4194–4201 CrossRef CAS PubMed .
  27. C. J. Ziegler, K. Chanawanno, A. Hasheminsasab, Y. V. Zatsikha, E. Maligaspe and V. N. Nemykin, Inorg. Chem., 2014, 53, 4751–4755 CrossRef CAS PubMed .
  28. B. Dhokale, P. Gautam and R. Misra, Tetrahedron Lett., 2012, 53, 2352–2354 CrossRef CAS PubMed .
  29. R. Misra, B. Dhokale, T. Jadhav and S. M. Mobin, Dalton Trans., 2014, 43, 4854–4861 RSC .
  30. R. Misra, B. Dhokale, T. Jadhav and S. M. Mobin, New J. Chem., 2014, 38, 3579–3585 RSC .
  31. R. Misra, T. Jadhav, B. Dhokale, P. Gautam, R. Sharma, R. Maragani and S. M. Mobin, Dalton Trans., 2014, 43, 13076–13086 RSC .
  32. O. A. Bozdemir, M. D. Yilmaz, O. Buyukcakir, A. Siemiarczuk, M. Tutas and E. U. Akkaya, New J. Chem., 2010, 34, 151–155 RSC .
  33. M. D. Yilmaz, O. A. Bozdemir and E. U. Akkaya, Org. Lett., 2006, 8, 2871–2873 CrossRef CAS PubMed .
  34. J. Baffreau, S. Leroy-Lhez, N. Vân Anh, R. M. Williams and P. Hudhomme, Chem.–Eur. J., 2008, 14, 4974–4992 CrossRef CAS PubMed .
  35. M. Fukuoka, T. Yokogawa, S. Miyahara, H. Miyakoshi, M. Yano, J. Taguchi and Y. Takao, Japan Pat., JP2011231015, 2011 .
  36. X. Zhang, Y. Xiao and X. Qian, Org. Lett., 2008, 10, 29–32 CrossRef CAS PubMed .
  37. D. Magde, R. Wong and P. G. Seybold, Photochem. Photobiol., 2002, 75, 327–334 CrossRef CAS .
  38. S. Tannert, E. A. Ermilov, J.-O. Vogel, M. T. M. Choi, D. K. P. Ng and B. Röder, J. Phys. Chem. B, 2007, 111, 8053–8062 CrossRef CAS PubMed .
  39. J. R. Lakowicz, Principles of Fluorescence Spectroscopy, Springer, New York, 3rd edn, 2006 Search PubMed .
  40. J. A. Nelder and R. Mead, Comput. J., 1965, 7, 308–313 CrossRef .
  41. I. Rückmann, A. Zeug, R. Herter and B. Röder, Photochem. Photobiol., 1997, 66, 576–584 CrossRef PubMed .
  42. J. Megow, T. Plehn, R. Steffen, B. Röder and V. May, Chem. Phys. Lett., 2013, 585, 178–183 CrossRef CAS PubMed .
  43. M. Adachi, Y. Murata and S. Nakamura, J. Phys. Chem., 1995, 99, 14240–14246 CrossRef CAS .
  44. D. L. Dexter, J. Chem. Phys., 1953, 21, 836–850 CrossRef CAS PubMed .
  45. T. Förster, Ann. Phys., 1948, 437, 55–75 CrossRef PubMed .
  46. T. Förster, Z. Naturforsch., 1949, 4a, 321–327 Search PubMed .
  47. T. Förster, Discuss. Faraday Soc., 1959, 27, 7–17 RSC .

Footnote

Electronic supplementary information (ESI) available: NMR spectra of PDI and BDP–PDI in CDCl3; spectral overlap between normalized fluorescence spectrum of BDP and normalized absorption spectrum of PDI. See DOI: 10.1039/c5ra10077a

This journal is © The Royal Society of Chemistry 2015
Click here to see how this site uses Cookies. View our privacy policy here.