 Open Access Article
Creative Commons Attribution 3.0 Unported Licence
A methanol VOC sensor using divalent metal ion-modified 2D DNA lattices†
Hyeong-U
Kim‡
a,
Sreekantha Reddy
Dugasani‡
ab,
Atul
Kulkarni
c,
Bramaramba
Gnapareddy
ab,
Jang Ah
Kim
a,
Sung Ha
Park
*ab and
Taesung
Kim
*ac
aSKKU Advanced Institute of Nano Technology (SAINT), Sungkyunkwan University, Suwon, Gyeonggi Do 440-746, South Korea. E-mail: tkim@skku.edu; sunghapark@skku.edu
bDepartment of Physics, Sungkyunkwan University, Suwon, Gyeonggi Do 440-746, South Korea
cSchool of Mechanical Engineering, Sungkyunkwan University, Suwon, Gyeonggi Do 440-746, South Korea
First published on 29th July 2015
Abstract
In the present study, an optical fiber sensor using pristine DNA and metal ion-modified DNA (M-DNA) double-crossover (DX) lattices was fabricated for detecting volatile organic compounds (VOCs) in the range of their threshold limit values (TLVs). The selective incorporation of metal ions, such as cobalt ions (Co2+), with appropriate concentrations into the DNA DX lattice has to be considered since excess metal ions can be bound nonspecifically and degrade the functions of the M-DNA DX lattices. The peak intensity of light reflected from a Co2+-modified DNA (Co-DNA) DX lattice was observed to be about 32% greater than that from the pristine DNA DX lattice in the presence of a relatively high 11![[thin space (1/6-em)]](https://www.rsc.org/images/entities/char_2009.gif) 897 ppm concentration of the VOC methanol, and was also observed to be greater in the presence of 95 to 475 ppm methanol. The change in the intensity of the reflected light due to the VOC interaction with the pristine DNA and the Co-DNA lattices corresponded to the differences in surface morphology visualized by atomic force microscopy and the differences in intensities from Raman spectroscopy.
897 ppm concentration of the VOC methanol, and was also observed to be greater in the presence of 95 to 475 ppm methanol. The change in the intensity of the reflected light due to the VOC interaction with the pristine DNA and the Co-DNA lattices corresponded to the differences in surface morphology visualized by atomic force microscopy and the differences in intensities from Raman spectroscopy.
Introduction
There is growing public concern about environmental pollution. Among pollutants in the air, volatile organic compounds (VOCs) are the most common and most hazardous for human health1,2 as evaluated by their threshold limit values (TLVs).3 Hence, it is necessary to monitor VOCs,4 and to do so with reliable, fast and accurate sensing technology. Numerous reports regarding sensors of VOCs and other gases are available, and these reports have mainly been about devices based on electrical and optical sensing technologies.5,6 Field-effect transistor sensors and electrochemical sensors are popular electrical sensors, but they come with certain disadvantages owing to their sensing materials, e.g., metal oxides, needing elevated temperatures to achieve desired sensitivity and selectivity. Such temperatures can limit their applications at hazardous locations. On the other hand, optical sensors—especially optical fiber-based sensors—are gaining significant attention recently for their detection of VOCs and other gases, because of their low operating temperatures as well as ease of operation, implementation, and remote monitoring. Among optical fiber sensors, those that form a thin film to measure optical reflections are convenient for detecting various VOCs and other gases as well as nuclear radiation. From our previous experiments, we realized that DNA can be utilized as a good sensing material for the construction of alpha/beta radiation sensors2,7 and biosensors.8Structural DNA nanotechnology has influenced the construction of a wide range of artificially designed nanostructures with diverse geometries.9–13 DNA is considered to be one of most promising biomaterials to fabricate nanostructures due to its Watson–Crick base-pairing rules, and its ability to self-assemble.14 There are well-established mechanisms for the binding of DNA to functional groups, which allows DNA to be a useful host material to incorporate functional nano- and bio-materials, including ions, nanoparticles, and proteins. DNA molecules that can be effectively conjugated to other species and hence be used in various devices including sensors have been envisioned to have potential applications in electronics, spintronics, photonics, biosensors, and energy science.15–21 In particular, ions can be incorporated into DNA molecules in order to transfer their physical functionalities efficiently for practical use by a well-established methodology of M-DNA DX lattices without inducing structural deformations.22,23 With aid of this, the selective incorporation of metal ions with optimum concentration (without structural deformation) into a given DNA has to be considered because excess metals can bind non-specifically and degrade the functions of metal ion-modified DNA (M-DNA) double-crossover (DX) lattices. In the present study, we selected the divalent metal ion, Co2+ for use in the detection of volatile organic compounds (VOCs).
In order to enhance the sensitivity and efficiency of DNA as a sensor, we introduce the use of Co2+-modified DNA (Co-DNA) lattice for detecting VOC by measuring the change in the intensity of light reflected when the VOC interact with these lattices. Here, we constructed a reflection-mode sensor consisting of optical fibers as well as Co-DNA DX lattice for the sensing of various VOCs, such as methanol, dichloromethane (DCM), diethylamine (DEA), toluene, tetrahydrofuran (THF) and ammonia. The surface morphologies of the M-DNA lattices before and after exposure to these VOCs were studied by atomic force microscopy (AFM) and Raman spectroscopy. Finally we discuss the relationship between the change in the intensity of the reflected light and the change of the surface morphology of the Co-DNA DX lattice upon exposure to the VOCs.
Experimental
Preparation of DNA and Co2+-modified DNA lattices
A 5 × 5 mm2 glass substrate was treated with O2 plasma by using a plasma cleaner (Plasma Processing System, Model: CUTE-1MP/R, Korea) with a base pressure of 5 × 10⁻² torr, working pressure of 7.8 × 10⁻¹ torr, power of 50 watt, oxygen flow rate of 45 sccm, and plasma generation time of 5 min. The samples were then rinsed with de-ionized (DI) water. Synthetic oligonucleotides purified using high-performance liquid chromatography was purchased from BIONEER (Daejeon, Korea). The complexes were then formed by mixing a stoichiometric quantity of each strand in physiological buffer, 1× TAE/Mg2+ [40 mM Tris, 20 mM acetic acid, 1 mM EDTA (pH 8.0), and 12.5 mM magnesium acetate]. For annealing, the plasma-treated glass and the individual DNA strands were inserted into a polypropylene test tube (1.5 mL, AXYGEN, CA, USA) that was then placed in a Styrofoam box with 2 L of boiled water and was allowed to subsequently cool from 95 to 25 °C gradually over 24 hours to facilitate the hybridization process. A final concentration of 50 nM DNA was achieved, which allowed for full coverage on the given substrate. After growing the DNA DX lattice on the glass substrates by substrate-assisted growth, the appropriate amount of 1 M cobalt ion [CoCl2] was added to yield a final Co2+ concentration of 1 mM. It was worth noted that the care has been taken for the structural stability of the DNA lattices even with existence of Co2+ controlled by ion concentration.24 The samples were then incubated at room temperature for 24 hours.Fiber optical reflectance sensor setup for detecting VOCs
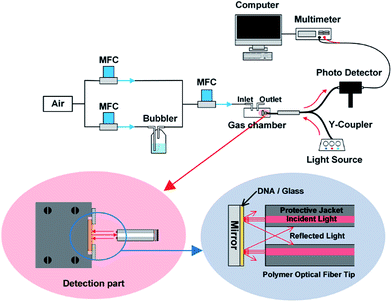
The experimental setup for the fiber optical reflectance sensor is depicted in Fig. 1. Compressed air was passed through two channels using mass flow controllers (MFCs), where the first channel was only for air and second channel was for the evaluated VOCs, which were passed through the bubbler system to a gas chamber. With the help of the MFC, the VOCs concentration in the gas chamber can be controlled in the ppm range. This laboratory-designed gas chamber was made with an internal volume of 0.22 m3, and with the interior walls anodized to avoid corrosion from VOCs. The pristine DNA and Co-DNA DX lattices on the glass substrates were placed in the chamber and the light reflected from the lattice was measured using a polymer optical fiber (POF) with 1 × 2 Y-coupler (R600-8 UV-VIS RS, StellarNet Inc, USA). For evaluating the maximum reflected intensity from DNA DX lattice, initially we used different light sources, such as blue (λ = 455 nm), green (λ = 530 nm) and red (λ = 660 nm). The reflected light was measured using a Si photodiode detector (Thorlabs PDA36A). The arrangement of a pristine DNA or Co-DNA DX lattice sample and a POF tip are shown in the red circular region of Fig. 1 where the incident light, provided by the six fibers in the POF, was directed perpendicularly to the DNA DX lattices. The light reflected from the DNA DX lattice was collected by the center fiber as shown in the blue circular region of Fig. 1. All experiments were carried out at ambient temperature (20–22 °C) under normal atmospheric pressure.Characterization of samples using AFM imaging and Raman spectroscopy
For AFM imaging, a Co-DNA DX lattice sample whose growth was substrate assisted was placed on a metal puck using instant glue. 30 μL of the 1× TAE/Mg2+ buffer described above was dropped onto the substrate and another 10 μL of the 1× TAE/Mg2+ buffer was dispensed onto the SiN AFM tip (NP-S10, Veeco Inc., USA). AFM images were obtained using a Multimode Nanoscope (Veeco Inc., USA) in the liquid tapping mode. The effect of VOCs on Co-DNA DX lattices was also studied using Raman spectroscopy and was compared to similar experiments with pristine DNA DX lattice. The wavelength and power of the laser used in the Raman spectrometer (Alpha300 M+, WITec GmbH, Germany) were 532 nm and 2 mW, respectively.Results and discussion
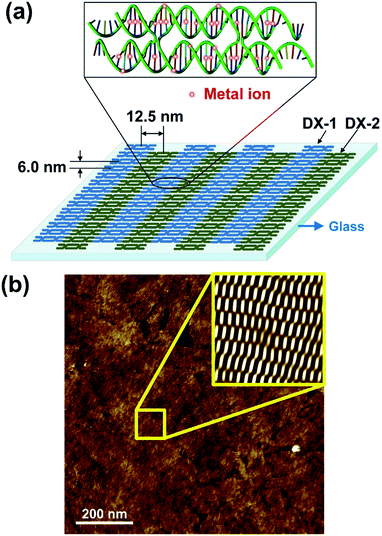
A schematic diagram and representative AFM image of the DNA DX lattice is shown in Fig. 2. The DNA DX lattice was composed of DX-1 and DX-2 tiles designed by programming sticky-end associations based on the Watson–Crick base-pairing rules. Each DX tile consisted of four strands of DNA with both.DNA helices from each strand linked to helices from another strand at two crossover junctions; these linkages improve the stiffness of the structure (see Fig. S1, ESI†). The nucleotide sequence and shape of the DX tile was computer designed to impart on the tile a dimension of 12.5 × 6 nm2 (length × width) as shown in Fig. 2(a).25,26 Divalent Co2+ ions were intercalated into DNA DX lattice grown on the glass substrate via substrate-assisted growth (SAG) as depicted in Fig. 2(a) (enlarged view).27,28 Here, the nucleobases and phosphate backbones were the appropriate sites for the metal ions to bind to the DNA molecules (metal ion sites were indicated by red circles). We added metal ions to the DNA after formation of the DNA DX lattice in order to avoid structural deformation of the DNA DX lattice on the glass substrates. We noticed that 1 mM of Co2+ was optimally incorporated into the DNA without structural deformation. The AFM image (Fig. 2(b)) shows periodic DNA DX lattice with 1 mM Co2+. The periodicity in the DNA DX lattice is shown in the inset of Fig. 2(b) which is a noise-filtered 2D spectrum image obtained using the fast Fourier transform (FFT).
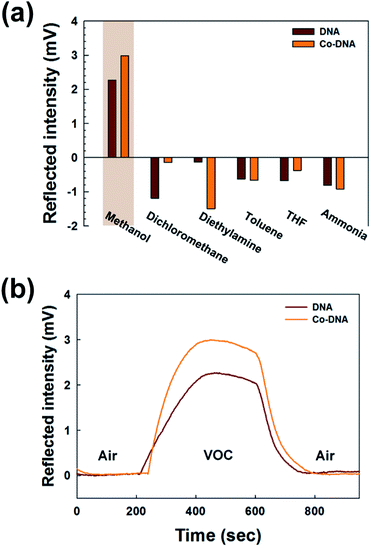
Various M-DNA (M = Co2+, Cu2+, Ni2+, Zn2+) DX lattices were first evaluated to determine their responses to various VOCs (Fig. S2, ESI†). Among them, Co-DNA DX lattices showed the best response to a VOC, which occurred when methanol was tested as the VOC. Hence, a further detailed evaluation was carried out for the Co-DNA DX lattice. The peak intensities of light reflected by pristine DNA and Co-DNA DX lattices in response to same concentration of various VOCs are shown in Fig. 3(a). A relatively high 11![[thin space (1/6-em)]](https://www.rsc.org/images/entities/char_2009.gif) 897 ppm concentration of the VOC was used in these experiments in order to obtain the strongest possible reflected intensities. From our observation, we realized that the reflected intensities were almost identical (after measuring multiple sets of the DNA and the Co-DNA lattices) at a given VOC concentration. This might be due to the high concentration of VOCs, which means VOCs were already over the saturation concentration to react with either the DNA or the Co-DNA lattices maximally. The wavelength chosen was based on tests of light sources with λ = 455, 530 and 660 nm; those with λ = 660 nm produced the most intense reflected light from the pristine DNA and Co-DNA DX lattices, respectively (see Fig. S3, ESI†).29 Consequently, we chose to use the light source with λ = 660 nm in these experiments. Of the various VOCs tested, the intensity of the light reflected from the lattices exposed to methanol was found to be the greatest, as seen in Fig. 3(a).
897 ppm concentration of the VOC was used in these experiments in order to obtain the strongest possible reflected intensities. From our observation, we realized that the reflected intensities were almost identical (after measuring multiple sets of the DNA and the Co-DNA lattices) at a given VOC concentration. This might be due to the high concentration of VOCs, which means VOCs were already over the saturation concentration to react with either the DNA or the Co-DNA lattices maximally. The wavelength chosen was based on tests of light sources with λ = 455, 530 and 660 nm; those with λ = 660 nm produced the most intense reflected light from the pristine DNA and Co-DNA DX lattices, respectively (see Fig. S3, ESI†).29 Consequently, we chose to use the light source with λ = 660 nm in these experiments. Of the various VOCs tested, the intensity of the light reflected from the lattices exposed to methanol was found to be the greatest, as seen in Fig. 3(a).
The intensity of light reflected by the Co-DNA DX lattice in response to methanol as well as by the pristine DNA lattice in response to methanol was then followed as a function of time elapsed after the injection of the methanol into the testing chamber, as shown in Fig. 3(b). On the one hand, pristine DNA started to respond to methanol sooner after the injection—that is, when the level of the methanol was still low—than did the Co-DNA DX lattice. This rapid response by pristine DNA may be due to the weak hydrogen bonds between its base pairs,30 and the delayed response to methanol by the Co-DNA DX lattice may be explained by Co2+ replacing OH− groups in this lattice and hence stabilizing its structure. On the other hand, the peak intensity of the reflected light in the presence of methanol was observed to be about 32% greater from the Co-DNA DX lattice than from the pristine DNA DX lattice. This enhanced sensitivity of the Co-DNA DX lattice to methanol at the later time points may also be explained by the stabilization of the lattice imparted by Co2+. In contrast to the case of pristine DNA, whose weak bonds would continue to be broken as more time elapses and the concentration of the methanol increases in the chamber, the stabilized Co-DNA DX lattice could continue to react with methanol. Overall, the Co-DNA DX lattice reflected light at higher intensities than did the pristine DNA DX lattice due to the presence of the Co2+ ions, which also caused a shift of the absorbed light to higher wavelengths. Furthermore, the appreciable binding of Co2+ to the intrinsically charged DNA molecules may increase the hydrophilicity of the lattice, which in turn might enhance the binding of VOCs to these Co-DNA DX lattice, thus resulting in the observed larger response.
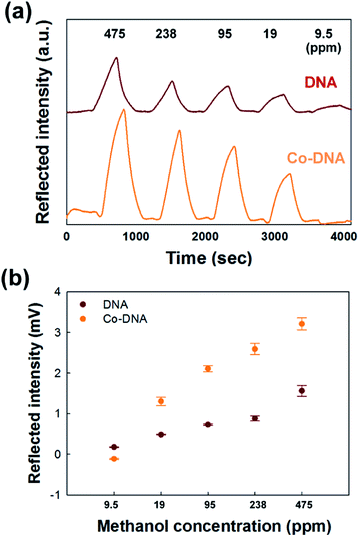
We also tested various concentrations of methanol vapor to determine whether the sensing limits of the pristine DNA and Co-DNA DX lattices satisfy TLVs according to international chemical safety cards (ICSCs). Fig. 4(a) shows time courses of the peak intensities of light reflected from the pristine DNA and Co-DNA DX lattices in the presence of methanol concentrations ranging from 475 to 9.5 ppm. For each of the two lattices, the peak intensity did as expected decrease with decreasing methanol concentration in this range, with the peak intensity of the reflected light being particularly weak from each lattice in the presence of 9.5 ppm methanol. The peak intensities of light reflected from the pristine DNA and the Co-DNA DX lattices in the presence of various concentrations of methanol vapor are plotted in Fig. 4(b). These reflected light intensity values for 475 and 19 ppm of methanol from the pristine DNA lattice were 1.3 mV and 0.5 mV, respectively, and from the Co-DNA DX lattice were 3.2 mV and 1.6 mV, respectively, indicative of a greater intensity of the reflected light in the TLV limits provided by the addition of Co2+ to the DNA. In order to obtain reliable and reproducible data, we measured each sample of the DNA and the Co-DNA DX lattices more than five times for sensing methanol in the concentration range from 9.5 to 475 ppm shown in Fig. 4(b). Additionally we prepared about 5 sets of the DNA and the Co-DNA lattices for verifying the measurement repeatability and data consistency of samples affected by methanol. From them, we observed deviations of the reflected intensities with whole range of methanol concentration up to 8%. For references, we displayed and discussed the multiple measurements of the reflected intensities under 95 ppm of methanol through the DNA and the Co-DNA lattices in Fig. S4, ESI.†
Moreover, between 19 ppm and 475 ppm, the relationship between the change in the methanol concentration and the change in the intensity of the reflected light was more linear for the Co-DNA DX lattice than for the pristine DNA DX lattice (Fig. 4(b)). Taken together, the Co-DNA DX lattices showed an overall improved performance as compared with the DNA DX lattice.
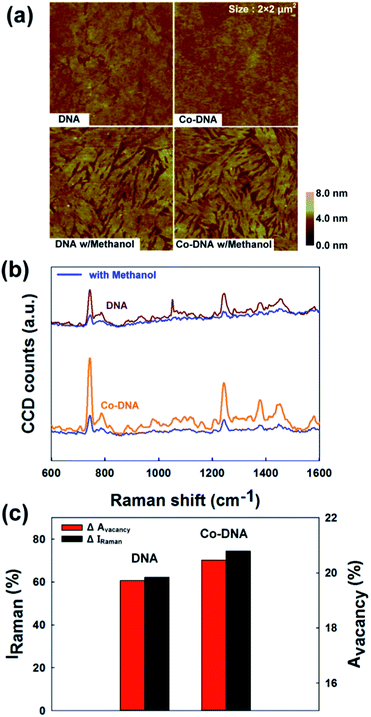
To provide a physical basis for the relative intensities of the reflected light under the different conditions, we used AFM to analyze surface morphologies. AFM images of the pristine DNA and Co-DNA DX lattices before and after exposure to methanol vapor are displayed in Fig. 5(a). The topologies of the pristine DNA and Co-DNA DX lattices changed upon exposure to methanol, appearing to show a change from full to partial coverage. Such a change may have been caused by a methanol-induced dissociation of the DX lattices. These changes allow dissociation followed by significant attributions in reflected intensity. The topological change is eventually enhanced the reflected intensity of DNA and Co-DNA due to the surface coverage is reduced, the incident light to penetrate through the DNA and get reflected from the back mirror, hence explaining the increase in the reflected intensity upon exposure to methanol (Fig. S5, ESI†). To quantify surface coverage, we evaluated the surface vacancy area percentages, and found them to be between ∼16 to ∼20% for the pristine DNA and Co-DNA DX lattices.
Raman spectra of pristine DNA and Co-DNA DX lattices are shown in Fig. 5(b). The intensities of the specific bands corresponding to the nucleobases and phosphate backbones of the DNA (shown in Table S1 in ESI†) became reduced by up to ∼70% upon exposure to methanol vapor. Such a reduction may be explained by the relatively high polarity of this VOC affecting DNA bonds as described above. We noticed that the change of Raman intensity (ΔIRaman) corresponds to the change of vacancy area (ΔAvacancy) as shown in Fig. 5(c): based upon the experimental data obtained from the pristine DNA and Co-DNA DX lattices, we observed that when ΔIRaman is large, so is ΔAvacancy, which can be explained by the dissociation of DNA DX lattice on the given substrate after exposure to methanol vapor.
Conclusions
We developed a simple method to fabricate DNA DX lattice, with and without metal ion, by growing them via substrate-assisted growth method. The pristine DNA and the Co-DNA DX lattices were used in an optical fiber sensor in reflection mode for detecting various VOCs. Due to the influences of VOCs on the topologies of the pristine DNA and the Co-DNA lattices, the intensity of reflected light from these lattices changed in proportion to the concentration of the VOC as measured by a photodetector. By our observation, we can conclude the detection limits through the DNA and the Co-DNA lattices were 9.5 and 11 ppm, respectively. Interestingly, sensitivity of the DNA lattices around the detection limit was slightly better than the Co-DNA lattices, but the Co-DNA lattices had higher sensitivities than the DNA above the detection limit concentration.Acknowledgements
This work was supported by the National Research Foundation of Korea (NRF), (NRF-2009-0083540) to TK, and (NRF-2014R1A2A1A11053213) to SHP funded by the Korea government, Ministry of Science, ICT & Future Planning (MSIP).Notes and references
- H. Zhang, A. Kulkarni, H. Kim, D. Woo, Y.-J. Kim, B. H. Hong, J.-B. Choi and T. Kim, J. Nanosci. Nanotechnol., 2011, 11, 5939–5943 CrossRef CAS PubMed.
- S. R. Dugasani, J. A. Kim, B. Kim, P. Joshirao, B. Gnapareddy, C. Vyas, T. Kim, S. H. Park and V. Manchanda, ACS Appl. Mater. Interfaces, 2014, 6, 2974–2979 CAS.
- M. Zuraimi, C.-A. Roulet, K. Tham, S. Sekhar, K. D. Cheong, N. Wong and K. Lee, Build. Environ., 2006, 41, 316–329 CrossRef PubMed.
- J. M. Greatorex, JTI – Institutet för jordbruks-och miljöteknik, Uppsala, 2000 Search PubMed.
- H.-Y. Park, S. R. Dugasani, D.-H. Kang, J. Jeon, S. K. Jang, S. Lee, Y. Roh, S. H. Park and J.-H. Park, ACS Nano, 2014, 8, 11603–11613 CrossRef CAS PubMed.
- S. Some, Y. Xu, Y. Kim, Y. Yoon, H. Qin, A. Kulkarni, T. Kim and H. Lee, Sci. Rep., 2013, 3, 1868 Search PubMed.
- A. Kulkarni, B. Kim, S. R. Dugasani, P. Joshirao, J. A. Kim, C. Vyas, V. Manchanda, T. Kim and S. H. Park, Sci. Rep., 2013, 3, 2062 Search PubMed.
- R. Amin, A. Kulkarni, T. Kim and S. H. Park, Current Applied Physics, 2012, vol. 12, pp. 841–845 Search PubMed.
- H. Pei, L. Liang, G. Yao, J. Li, Q. Huang and C. Fan, Angew. Chem., 2012, 124, 9154–9158 CrossRef PubMed.
- O. I. Wilner, R. Orbach, A. Henning, C. Teller, O. Yehezkeli, M. Mertig, D. Harries and I. Willner, Nat. Commun., 2011, 2, 540 CrossRef PubMed.
- R. Jungmann, C. Steinhauer, M. Scheible, A. Kuzyk, P. Tinnefeld and F. C. Simmel, Nano letters, 2010, 10, 4756–4761 CrossRef CAS PubMed.
- W. Cheng, M. J. Campolongo, J. J. Cha, S. J. Tan, C. C. Umbach, D. A. Muller and D. Luo, Nat. Mater., 2009, 8, 519–525 CrossRef CAS PubMed.
- H. Yan, S. H. Park, G. Finkelstein, J. H. Reif and T. H. LaBean, science, 2003, 301, 1882–1884 CrossRef CAS PubMed.
- J. D. Watson and F. H. Crick, Nature, 1953, 171, 737–738 CrossRef CAS PubMed.
- G. L. Rikken, science, 2011, 331, 864–865 CrossRef CAS PubMed.
- S. J. Kim, J. Jung, K. W. Lee, D. H. Yoon, T. S. Jung, S. R. Dugasani, S. H. Park and H. J. Kim, ACS Appl. Mater. Interfaces, 2013, 5, 10715–10720 CAS.
- J.-M. Nam, C. S. Thaxton and C. A. Mirkin, science, 2003, 301, 1884–1886 CrossRef CAS PubMed.
- S. J. Kim, B. Kim, J. Jung, D. H. Yoon, J. Lee, S. H. Park and H. J. Kim, Appl. Phys. Lett., 2012, 100, 103702 CrossRef PubMed.
- Y. Lu, B. R. Goldsmith, N. J. Kybert and A. C. Johnson, Appl. Phys. Lett., 2010, 97, 083107 CrossRef PubMed.
- J. Jung, S. J. Kim, K. W. Lee, D. H. Yoon, Y.-g. Kim, H. Y. Kwak, S. R. Dugasani, S. H. Park and H. J. Kim, Biosens. Bioelectron., 2014, 55, 99–105 CrossRef CAS PubMed.
- K. W. Lee, K. M. Kim, J. Lee, R. Amin, B. Kim, S. K. Park, S. K. Lee, S. H. Park and H. J. Kim, Nanotechnology, 2011, 22, 375202 CrossRef PubMed.
- S. L. Labiuk, L. T. Delbaere and J. S. Lee, JBIC, J. Biol. Inorg. Chem., 2003, 8, 715–720 CrossRef CAS PubMed.
- K. Tanaka, A. Tengeiji, T. Kato, N. Toyama and M. Shionoya, science, 2003, 299, 1212–1213 CrossRef CAS PubMed.
- S. R. Dugasani, M. Kim, I.-y. Lee, J. A. Kim, B. Gnapareddy, K. W. Lee, T. Kim, N. Huh, G.-H. Kim and S. C. Park, Nanotechnology, 2015, 26, 275604 CrossRef PubMed.
- E. Winfree, F. Liu, L. A. Wenzler and N. C. Seeman, Nature, 1998, 394, 539–544 CrossRef CAS PubMed.
- S. H. Park, M. W. Prior, T. H. LaBean and G. Finkelstein, Appl. Phys. Lett., 2006, 89, 033901–033903 CrossRef PubMed.
- S. Hamada and S. Murata, Angew. Chem., 2009, 121, 6952–6955 CrossRef PubMed.
- X. Sun, S. Hyeon Ko, C. Zhang, A. E. Ribbe and C. Mao, J. Am. Chem. Soc., 2009, 131, 13248–13249 CrossRef CAS PubMed.
- J. C. Sutherland and K. P. Griffin, Radiat. Res., 1981, 86, 399–410 CrossRef CAS.
- C. F. Matta, N. Castillo and R. J. Boyd, J. Phys. Chem. B, 2006, 110, 563–578 CrossRef CAS PubMed.
Footnotes |
| † Electronic supplementary information (ESI) available: Schematics of DX structure, control experiments, and repeatability data. See DOI: 10.1039/c5ra11371g |
| ‡ These authors contributed equally to this work. |
| This journal is © The Royal Society of Chemistry 2015 |

