Cotton-based porous activated carbon with a large specific surface area as an electrode material for high-performance supercapacitors
Guofu Ma*a,
Dongyang Guoa,
Kanjun Sunb,
Hui Penga,
Qian Yanga,
Xiaozhong Zhoua,
Xiaolong Zhaoa and
Ziqiang Lei*a
aKey Laboratory of Eco-Environment-Related Polymer Materials of Ministry of Education, Key Laboratory of Polymer Materials of Gansu Province, College of Chemistry and Chemical Engineering, Northwest Normal University, Lanzhou 730070, China. E-mail: magf@nwnu.edu.cn; Leizq@nwnu.edu.cn
bCollege of Chemistry and Environmental Science, Lanzhou City University, Lanzhou 730070, China
First published on 23rd July 2015
Abstract
Cotton-based porous activated carbons (CACs) are prepared through a simple chemical activation method using cotton fiber as carbon source and ZnCl2 as activating agent. Powder X-ray diffraction, scanning electron microscopy, and N2 adsorption–desorption tests demonstrate that the carbons activated with different amounts of ZnCl2 have a large number of mesopores, notably, a maximum specific surface area of 2548.6 m2 g−1 and ultrahigh pore volume of 1.54 cm3 g−1 for CAC2 sample are obtained when the cotton/ZnCl2 mass ratio is 1![[thin space (1/6-em)]](https://www.rsc.org/images/entities/char_2009.gif) :
:![[thin space (1/6-em)]](https://www.rsc.org/images/entities/char_2009.gif) 2. As an electrode material for supercapacitors, the CAC2 possesses a high specific capacitance of 239 F g−1 at 0.5 A g−1 and good rate capability (82% capacitance retention even at 8 A g−1) in 2 mol L−1 KOH aqueous electrolyte. Moreover, the as-assembled CAC2//CAC2 symmetric supercapacitor exhibits a high energy density of 13.75 Wh kg−1 at a power density of 225 W kg−1 operated at the voltage range of 0 to 1.8 V in 0.5 mol L−1 Na2SO4 aqueous electrolyte and an excellent cyclability retaining about 93% initial capacitance after 5000 cycles.
2. As an electrode material for supercapacitors, the CAC2 possesses a high specific capacitance of 239 F g−1 at 0.5 A g−1 and good rate capability (82% capacitance retention even at 8 A g−1) in 2 mol L−1 KOH aqueous electrolyte. Moreover, the as-assembled CAC2//CAC2 symmetric supercapacitor exhibits a high energy density of 13.75 Wh kg−1 at a power density of 225 W kg−1 operated at the voltage range of 0 to 1.8 V in 0.5 mol L−1 Na2SO4 aqueous electrolyte and an excellent cyclability retaining about 93% initial capacitance after 5000 cycles.
1. Introduction
Supercapacitors, a new class of electrical energy storage devices with high power density, long cycle life, rapid charge/discharge rates and high safety etc., have attracted intense attention over the past decades owing to their widespread applications, such as hybrid electric vehicles, portable electronic equipment and uninterruptible power supplies.1–3 The performances of supercapacitors are largely dependent on the properties and structures of the electrode materials. Based on the mechanism of charge storage, supercapacitors can be categorized in two major classes, i.e., the electrochemical double-layer capacitor (EDLC) and pseudocapacitor. The capacitance of EDLC comes from non-faradic charge accumulation at the interfacial double layer of the electrode and electrolyte, whereas in pseudocapacitors, reversible faradic redox reactions also contribute to the capacitance along with non-faradic charge.4–7 Transition metal oxides or hydroxides, such as RuO2, MnO2, Ni(OH)2, etc., and conductive polymers have been used to increase the specific capacitance via a variety of reversible oxidation states for highly efficient redox charge transfer.8–10 However, low electrical conductivity, poor cycle stability and high price have limited the practical application of those pseudocapacitive materials.11–13 Carbon materials with porous structure, large surface area, high conductivity, and long-term cycle ability, etc., having always been regarded as the most promising candidate electrode materials for electrical energy storage devices.14–18To date, carbon materials in nature have been investigated extensively as potential electrode materials for supercapacitors. Bamboo,19 coconut shell,20 peanut shell,21 celtuce22 and lignin23 have been considered as possible precursors for the synthesis of activated carbons. Cotton is known as one of the most important agricultural commodities, which is widely cultivated and abundant production. Wang et al. have prepared cotton-based hollow carbon fibers (CCFs) by ammonia etching for supercapacitor application. The CCFs obtained by carbonization in NH3 has high specific surface area up to 778.6 m2 g−1, higher nitrogen concentration (3.3 at%) and more C![[double bond, length as m-dash]](https://www.rsc.org/images/entities/char_e001.gif) O functional groups, but ammonia is corrosive in the preparation process. Therefore, it is significant to find an eco-friendly method to make carbon materials. Herein, we prepared cotton-based porous activated carbons (CACs) through a simple chemical activation method using cotton fiber as carbon source and ZnCl2 as activating agent, and a maximum specific surface area up to 2548.6 m2 g−1 for CAC2 sample was obtained when the cotton/ZnCl2 mass ratio is 1
O functional groups, but ammonia is corrosive in the preparation process. Therefore, it is significant to find an eco-friendly method to make carbon materials. Herein, we prepared cotton-based porous activated carbons (CACs) through a simple chemical activation method using cotton fiber as carbon source and ZnCl2 as activating agent, and a maximum specific surface area up to 2548.6 m2 g−1 for CAC2 sample was obtained when the cotton/ZnCl2 mass ratio is 1![[thin space (1/6-em)]](https://www.rsc.org/images/entities/char_2009.gif) :
:![[thin space (1/6-em)]](https://www.rsc.org/images/entities/char_2009.gif) 2, which is higher than that of 778.6 m2 g−1 for CCFs. Additionally, in our work, the mass ratio between the cotton and activating agent which can affect the carbons structure and morphology was studied, and the performance of the supercapacitor using CAC2 as electrode was also investigated.
2, which is higher than that of 778.6 m2 g−1 for CCFs. Additionally, in our work, the mass ratio between the cotton and activating agent which can affect the carbons structure and morphology was studied, and the performance of the supercapacitor using CAC2 as electrode was also investigated.
2. Experimental
2.1. Synthesis of CACs samples
In a typical synthesis, 1.0 g of the medical absorbent cotton (MAC) was mixed with ZnCl2 in different proportions (MAC/ZnCl2 mass ratio is 1![[thin space (1/6-em)]](https://www.rsc.org/images/entities/char_2009.gif) :
:![[thin space (1/6-em)]](https://www.rsc.org/images/entities/char_2009.gif) 0, 1
0, 1![[thin space (1/6-em)]](https://www.rsc.org/images/entities/char_2009.gif) :
:![[thin space (1/6-em)]](https://www.rsc.org/images/entities/char_2009.gif) 1, 1
1, 1![[thin space (1/6-em)]](https://www.rsc.org/images/entities/char_2009.gif) :
:![[thin space (1/6-em)]](https://www.rsc.org/images/entities/char_2009.gif) 2, 1
2, 1![[thin space (1/6-em)]](https://www.rsc.org/images/entities/char_2009.gif) :
:![[thin space (1/6-em)]](https://www.rsc.org/images/entities/char_2009.gif) 3, respectively) in 50 mL of distilled water and dipped at 80 °C under magnetic stirring for 5 h, and the mixtures were dried at 80 °C. Then, carbonized the mixtures at optimum temperature 900 °C for 2 h with temperature ramp rate of 5 °C min−1 under high pure N2 atmosphere. After being cooled to room temperature naturally, the carbide samples were thoroughly washed with 2 mol L−1 HCl to remove inorganic salts and other impurities. Finally, the samples were washed with distilled water until neutral pH and dried at 60 °C for 24 h. The obtained samples of different activation proportions with ZnCl2 were designated as CAC0, CAC1, CAC2 and CAC3, respectively.
3, respectively) in 50 mL of distilled water and dipped at 80 °C under magnetic stirring for 5 h, and the mixtures were dried at 80 °C. Then, carbonized the mixtures at optimum temperature 900 °C for 2 h with temperature ramp rate of 5 °C min−1 under high pure N2 atmosphere. After being cooled to room temperature naturally, the carbide samples were thoroughly washed with 2 mol L−1 HCl to remove inorganic salts and other impurities. Finally, the samples were washed with distilled water until neutral pH and dried at 60 °C for 24 h. The obtained samples of different activation proportions with ZnCl2 were designated as CAC0, CAC1, CAC2 and CAC3, respectively.
In order to optimize the best carbonization temperature, we adopt 1.0 g MAC without ZnCl2 for preparation of cotton-based carbon material at the different carbonization temperatures (700, 800, 900 or 1000 °C). The other preparation process is the same as the CACs. The samples were marked as CAC-x, where x is the carbonization temperature.
2.2. Materials characterization
A field emission scanning microscope (FE-SEM, Ultra Plus, Carl Zeiss, Germany) was used to examine the morphologies and structures of the carbon samples. The Brunauer–Emmett–Teller (BET) surface area (SBET) of the samples were analyzed by nitrogen adsorption in a Micromeritics ASAP 2020 nitrogen adsorption apparatus (U.S.A.). X-ray diffraction (XRD) of sample was performed by a diffractometer (D/Max-2400, Rigaku) and Raman spectra was recorded with an in Via Raman spectrometer (Renishaw).2.3. Electrochemical measurement
![[thin space (1/6-em)]](https://www.rsc.org/images/entities/char_2009.gif) :
:![[thin space (1/6-em)]](https://www.rsc.org/images/entities/char_2009.gif) 1
1![[thin space (1/6-em)]](https://www.rsc.org/images/entities/char_2009.gif) :
:![[thin space (1/6-em)]](https://www.rsc.org/images/entities/char_2009.gif) 1 and homogenizing slurry in N-methyl-2-pyrrolidone (NMP) solution. Further, the obtained slurry was coated on the nickel foam with an area of 1.0 cm2 and dried at 60 °C for 24 h, and then weighted and pressed into sheets under 15 MPa. The total mass of each electrode was limited to vary from 3.0 to 5.0 mg and we chose the two electrodes with identical or very close weight for the measurements.25 The CAC2 electrode fitted with the separator (thin polypropylene film) and electrolyte solution were symmetrically assembled into sandwich-type cells construction (electrode/separator/electrode). In order to make aqueous electrolyte solutions homogeneously diffuse into the CAC2 electrodes, the separator and CAC2 electrodes were immersed in 0.5 mol L−1 Na2SO4 electrolyte for 12 h before being assembled into the supercapacitor configuration.
1 and homogenizing slurry in N-methyl-2-pyrrolidone (NMP) solution. Further, the obtained slurry was coated on the nickel foam with an area of 1.0 cm2 and dried at 60 °C for 24 h, and then weighted and pressed into sheets under 15 MPa. The total mass of each electrode was limited to vary from 3.0 to 5.0 mg and we chose the two electrodes with identical or very close weight for the measurements.25 The CAC2 electrode fitted with the separator (thin polypropylene film) and electrolyte solution were symmetrically assembled into sandwich-type cells construction (electrode/separator/electrode). In order to make aqueous electrolyte solutions homogeneously diffuse into the CAC2 electrodes, the separator and CAC2 electrodes were immersed in 0.5 mol L−1 Na2SO4 electrolyte for 12 h before being assembled into the supercapacitor configuration.The electrochemical properties of electrodes were analyzed by cyclic voltammetry (CV), galvanostatic charge/discharge and electrochemical impedance spectroscopy (EIS) measurements in three-electrode cell and two-electrode configuration using an electrochemical workstation system (CHI 660D, Shanghai Chen Hua Co. Ltd., China). The cycle-life stability was recorded using cycling testing equipment (CT2001A, Wuhan Land Electronic Co. Ltd., China).
3. Results and discussions
The as-prepared cotton-based activated carbons (CACs) as electrode materials for supercapacitors application, and carbonization temperature seriously affect their electrochemical characters. Thus, the cyclic voltammograms (CVs) of carbon electrodes from different carbonization temperatures were measured at a scan rate of 50 mV s−1 with the potential range of −1.0 to 0 V in 2 mol L−1 KOH aqueous electrolyte (Fig. 1). It can be seen that the CV curves of CACs gradually approach rectangular shape with the increase of carbonization temperature. Obviously, the carbon samples carbonized with low temperature (700 °C and 800 °C) exhibit small irregular rectangular curves corresponding to low current response behavior due to their poor electrical conductivity. In contrast, the CV curves of CACs treated with high temperature (900 °C and 1000 °C) exhibit quasi-rectangular shape, indicating ideal capacitive behavior. But, as the carbonization temperature is increased up to 1000 °C, the curve area is obviously reduced, which may be caused by the collapse and stack of some carbon skeletons. Therefore, 900 °C is the best carbonization temperature of cotton fiber, and the MAC mixed with ZnCl2 in different proportions were all carbonized at 900 °C and used for supercapacitor applications unless otherwise specified.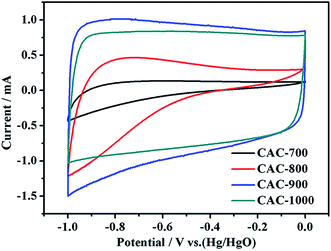 | ||
| Fig. 1 CV curves of cotton carbon materials synthesized at different carbonization temperatures at a scan rate of 50 mV s−1. | ||
3.1. The morphologies and structures of CACs samples
Fig. 2a–d show the typical SEM images of CACs samples, and different surface morphologies are observed for all carbon samples. The CAC0 presents a shape of highly distorted bar structure, and has slightly wrinkled surface without apparent pores (Fig. 2a). However, when treated with ZnCl2, the surface morphologies of carbon samples are changed. The CAC1 presents uneven and rough surface (Fig. 2b). More interestingly, the CAC2 displays rich loose and porous morphology (Fig. 2c). Furthermore, after treated with excessive ZnCl2, the CAC3 exhibits abundant macroporous structure (Fig. 2d). These results indicate that the ZnCl2 activation agent can play an important role in forming porous structure during the carbonization process.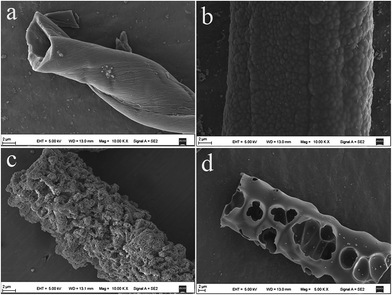 | ||
| Fig. 2 SEM images of the carbon samples treated with ZnCl2 activating agent in different proportions: (a) CAC0, (b) CAC1, (c) CAC2 and (d) CAC3, respectively. | ||
The nitrogen adsorption–desorption isotherms and pore size distribution curves of CACs are shown in Fig. 3a and b. As presented in Fig. 3a, the nitrogen adsorption–desorption isotherms of all CACs are presented type IV with a H3 hysteresis loop in the range of ca. 0.40–0.99 P/P0, which suggests the CACs have mesoporous structures. Moreover, there are also clearly defined step loops in the relative pressure region between 0.4 and 0.6, demonstrating the CACs possess uniform mesoporous structures.26 Meanwhile, at low relative pressure (P/P0 < 0.40), the adsorption isotherms of CACs are rapidly saturated, suggesting the adsorption of micropores. In addition, we can find out that as the mass ratio of MAC/ZnCl2 increased from 1![[thin space (1/6-em)]](https://www.rsc.org/images/entities/char_2009.gif) :
:![[thin space (1/6-em)]](https://www.rsc.org/images/entities/char_2009.gif) 0 to 1
0 to 1![[thin space (1/6-em)]](https://www.rsc.org/images/entities/char_2009.gif) :
:![[thin space (1/6-em)]](https://www.rsc.org/images/entities/char_2009.gif) 2, the adsorbed volume of CACs increase clearly. Comparing CAC0 and CAC1 samples, the CAC2 has higher adsorbed volume. However, it is found that the adsorbed volume of CAC3 significant decreases due to the large cavities presence caused by excessive ZnCl2. The specific surface area, pore volume, and average pore size of CACs obtained by BET measurement are summarized in Table 1. Particularly, the specific surface area and total pore volume of CAC2 are 2548.6 m2 g−1 and 1.54 cm3 g−1, respectively. The pore size distribution curves (Fig. 3b) imply that the CAC2 has abundant mesoporous pores. The large specific surface areas and high pore volumes of CAC2 are beneficial to ion transfer and charge storage for supercapacitors.
2, the adsorbed volume of CACs increase clearly. Comparing CAC0 and CAC1 samples, the CAC2 has higher adsorbed volume. However, it is found that the adsorbed volume of CAC3 significant decreases due to the large cavities presence caused by excessive ZnCl2. The specific surface area, pore volume, and average pore size of CACs obtained by BET measurement are summarized in Table 1. Particularly, the specific surface area and total pore volume of CAC2 are 2548.6 m2 g−1 and 1.54 cm3 g−1, respectively. The pore size distribution curves (Fig. 3b) imply that the CAC2 has abundant mesoporous pores. The large specific surface areas and high pore volumes of CAC2 are beneficial to ion transfer and charge storage for supercapacitors.
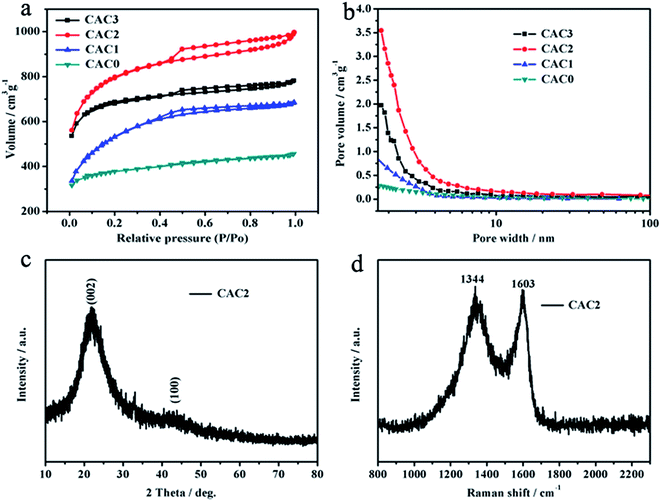 | ||
| Fig. 3 (a) Nitrogen adsorption–desorption isotherms and (b) pore size distribution curves of CACs, (c) X-ray diffraction pattern and (d) Raman spectrum of the CAC2. | ||
Fig. 3c is the XRD pattern of CAC2. Two broad diffraction peaks at 22.1° and 43.1° are observed, ascribing to the (002) and (100) crystal planes of graphitic carbon, which suggests the low graphitization degree and the possible presence of amorphous carbon.27 The Raman spectrum of CAC2 is shown in Fig. 3d. It shows two distinct peaks at 1344 (D-band) and 1603 cm−1 (G-band). These bands correspond to the disordered carbon/structural defects and graphitic layers (sp2 bonded carbon atoms) of the carbon material.28 Increased G-band intensity compared to D-band (ID/IG = 0.96) confirms that the formation of long-range graphitized carbon with a relatively small number of structural defects.
3.2. Electrochemical characteristics of CACs electrodes
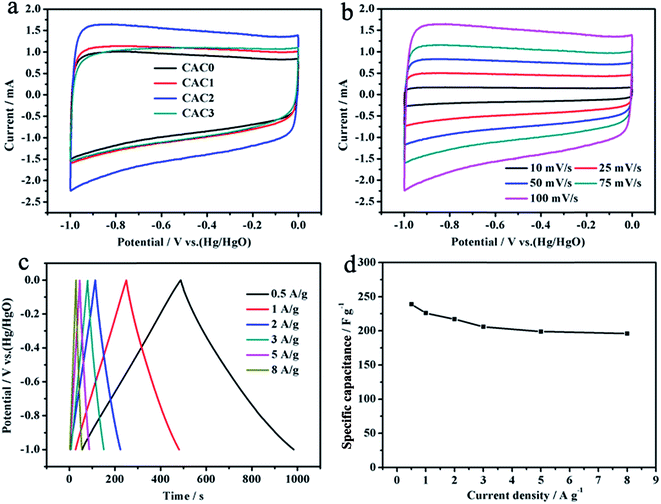
A three-electrode system was used to evaluate the electrochemical properties of the CACs. Fig. 4a is the CV curves of CACs electrodes at a scan rate of 50 mV s−1 with the potential range of −1.0 to 0 V. Clearly, the CAC2 exhibits larger area than that of others indicating CAC2 has the greatest specific capacitance, according to the linear relationship between CV curve area and specific capacitance. In addition, the CV curves of CAC2 retain quasi-rectangular shape even at a scan rate of up to 100 mV s−1 (Fig. 4b), suggesting the CAC2 exhibits a high rate capability.To calculate the specific capacitance of the CAC2 electrode, the galvanostatic charge/discharge measurement was carried out, and the result is shown in Fig. 4c. All the curves are highly symmetrical at different current densities, suggesting that the CAC2 possesses excellent electrochemical reversibility and charge/discharge properties. The specific capacitance of electrodes can be calculated using the following equation:29
| Cm = (It)/(ΔVm) | (1) |
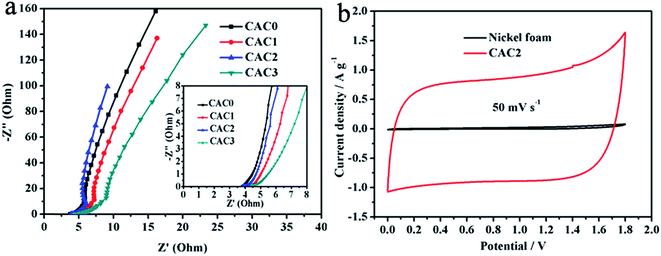
Electrochemical impedance spectroscopy (EIS) measurements of the CACs electrodes are shown in Fig. 5a. Contrasting the Nyquist plots, the CAC2 electrode presents smaller semicircle at the high frequency region and more vertical line at the low frequency region, which means that the CAC2 has low ion-transport resistance and ideal capacitor behavior than other electrodes.
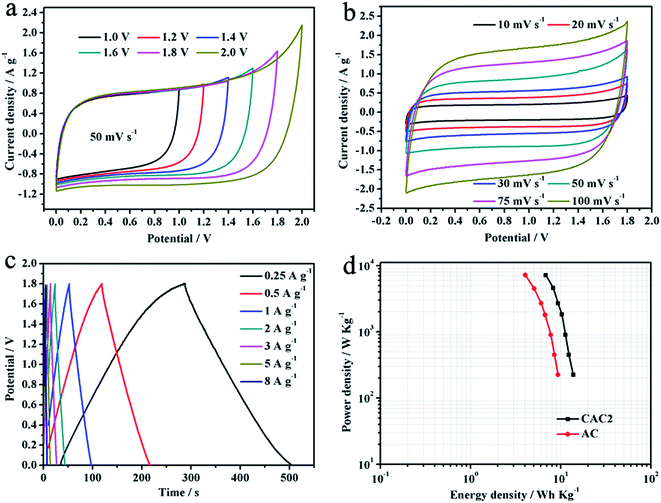
The two-electrode symmetric supercapacitor was also fabricated to further assess the actual electrochemical performance of CAC2 electrode. Compared with the acid and alkali solutions, the neutral Na2SO4 aqueous electrolyte has a higher operation voltage.30 CV cures of the CAC2//CAC2 symmetric cell in comparison to Ni foam at the same potential window is shown in Fig. 5b. It can be seen that the CV curve of Ni foam nearly approaches linear shape, indicating that Ni foam has no effect on the electrochemical properties of CAC2. Therefore, the working electrode CAC2 was prepared by coating on the Ni foam in the two-electrode system, and the CAC2//CAC2 symmetric supercapacitor was assembled and characterized in 0.5 mol L−1 Na2SO4 aqueous electrolyte. Fig. 6a shows the CV curves of the symmetric cell at different voltage windows. When the high voltage extends to 1.8 V, the CV curves of the supercapacitor still retain rectangular-like shape indicating ideal capacitive behavior and good reversibility. However, when the voltage increases to 2.0 V, the current is dramatically increased since the electrolyte is being decomposed with hydrogen and/or oxygen evolution.31 Therefore, the potential window of 1.8 V is selected to measure the electrochemical performance of the symmetric cell. The CV curves of the symmetric cell obtained at different scan rates from 10 to 100 mV s−1 at the voltage range of 0 to 1.8 V are shown in Fig. 6b, we can see that the CV curve area still keep a quasi-rectangular shape even at a scan rate of 100 mV s−1. Fig. 6c displays galvanostatic charge/discharge curves of the symmetric cell at different current densities from 0.25 to 8 A g−1. Using the following formulas,25 the specific energy density (E, W h kg−1) and power density (P, W kg−1) for a supercapacitor cell were counted.
| E = 1/2CV2 | (2) |
| P = Et−1 | (3) |
As shown in Fig. 7a, the Nyquist plot of the CAC2//CAC2 symmetric cell indicates that the CAC2 possesses high electrical conductivity with a small ESR of 1.50 Ω. The stability and reversibility of electrode material are important for its use in electrochemical supercapacitors. Fig. 7b displays the capacitance retentions versus cycle number curves of the CAC2//CAC2 symmetric cell at a current density of 5 A g−1. As can be observed, the symmetric cell displays satisfactory cycling stability with about 93% specific capacitance remaining after 5000 cycles.
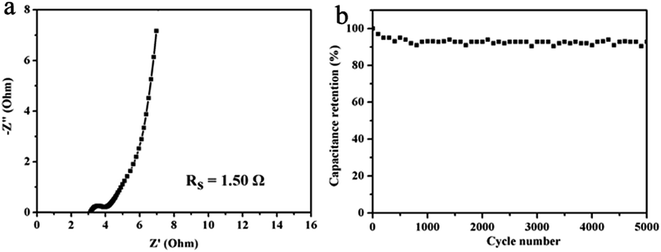 | ||
| Fig. 7 (a) Nyquist plots of CAC2 symmetric cell, (b) cycling stability of CAC2 symmetric cell at 5 A g−1. | ||
4. Conclusions
In summary, porous activated carbons from cotton fiber (CACs) have been successfully prepared in a simple chemical activation method. By optimizing the carbonization temperature and the amount of ZnCl2 activating agent, the resulting porous carbon (CAC2) shows an extremely high specific surface area of up to 2548.6 m2 g−1 as well as high capacitive performance with a specific capacitance of 239 F g−1 in three-electrode systems. Furthermore, the as-assembled CAC2//CAC2 symmetric supercapacitor device with an wide operation voltage of 0 to 1.8 V in 0.5 mol L−1 Na2SO4 aqueous electrolyte delivers a high energy density of 13.75 W h kg−1, and excellent cycling performance (only 7% capacitance loss after 5000 cycles). Therefore, it is a promising strategy to synthesize CACs electrode materials with low cost and eco-friendly for high-performance supercapacitor applications.Acknowledgements
The research was financially supported by the Science and Technology program of Gansu Province (No. 1308RJZA295, 1308RJZA265, 1308RJZA103), the National Science Foundation of China (No. 21164009, 21174114), the program for Changjiang Scholars and Innovative Research Team in University (IRT1177).References
- M. F. El-Kady, V. Strong, S. Dubin and R. B. Kaner, Science, 2012, 335, 1326–1330 CrossRef CAS PubMed.
- B. Dyatkin, V. Presser, M. Heon, M. R. Lukatskaya, M. Beidaghi and Y. Gogotsi, ChemSusChem, 2013, 6, 1169–2280 Search PubMed.
- G. P. Wang, L. Zhang and J. J. Zhang, Chem. Soc. Rev., 2012, 41, 797–828 RSC.
- H. L. Wang, H. S. Casalongue, Y. Y. Liang and H. J. Dai, J. Am. Chem. Soc., 2010, 132, 7472–7477 CrossRef CAS PubMed.
- D. Bhattacharjya and J. S. Yu, J. Power Sources, 2014, 262, 224–231 CrossRef CAS PubMed.
- V. Augustyn, P. Simon and B. Dunn, Energy Environ. Sci., 2014, 7, 1597–1614 CAS.
- H. Jiang, P. S. Lee and C. Z. Li, Energy Environ. Sci., 2013, 6, 41–53 CAS.
- X. H. Lu, M. H. Yu, G. M. Wang, T. Zhai, S. L. Xie, Y. C. Ling, Y. X. Tong and Y. Li, Adv. Mater., 2013, 25, 267–272 CrossRef CAS PubMed.
- Y. G. Li, H. L. Wang, L. M. Xie, Y. Y. Liang, G. S. Hong and H. J. Dai, J. Am. Chem. Soc., 2011, 133, 7296–7299 CrossRef CAS PubMed.
- Z. Li, Z. W. Xu, H. L. Wang, J. Ding, B. M. Zahiri, C. M. B. Holt, X. H. Tan and D. Mitlin, Energy Environ. Sci., 2014, 7, 1708–1718 CAS.
- G. A. Snook, P. Kao and A. S. Best, J. Power Sources, 2011, 196, 1–12 CrossRef CAS PubMed.
- W. J. Qian, F. X. Sun, Y. H. Xu, L. H. Qiu, C. H. Liu, S. D. Wang and F. Yan, Energy Environ. Sci., 2014, 7, 379–386 CAS.
- J. Jiang, Y. Y. Li, J. P. Liu, X. T. Huang, C. Z. Yuan and X. W. D. Lou, Adv. Mater., 2012, 24, 5166–5180 CrossRef CAS PubMed.
- J. P. Paraknowitsch and A. Thomas, Energy Environ. Sci., 2013, 6, 2839–2855 CAS.
- J. P. Liu, J. Jiang, C. W. Cheng, H. X. Li, J. X. Zhang, H. Gong and H. J. Fan, Adv. Mater., 2011, 23, 2076–2081 CrossRef CAS PubMed.
- G. X. Luo, L. Z. Liu, J. F. Zhang, G. B. Li, B. L. Wang and J. J. Zhao, ACS Appl. Mater. Interface, 2013, 5, 11184–11193 CrossRef CAS PubMed.
- V. K. Gupta, I. Ali, T. A. Saleh, M. N. Siddiqui and S. Agarwal, Environ. Sci. Pollut. Res., 2013, 20, 1261–1268 CrossRef CAS PubMed.
- Z. Li, L. Zhang, B. S. Amirkhiz, X. H. Tan, Z. W. Xu, H. L. Wang, B. C. Olsen, C. M. B. Holt and D. Mitlin, Adv. Energy Mater., 2012, 2, 431–437 CrossRef CAS PubMed.
- C. S. Yang, Y. S. Jang and H. K. Jeong, Curr. Appl. Phys., 2014, 14, 1616–1620 CrossRef PubMed.
- K. Jurewicz and K. Babe, Energy Fuels, 2010, 24, 3429–3435 CrossRef CAS.
- M. B. Wu, R. C. Li, X. J. He, H. B. Zhang, W. B. Sui and M. H. Tan, Carbon, 2015, 86, 371–374 Search PubMed.
- R. T. Wang, P. Y. Wang, X. B. Yan, J. W. Lang, C. Peng and Q. J. Xue, ACS Appl. Mater. Interface, 2012, 4, 5800–5806 CrossRef CAS PubMed.
- D. Saha, Y. C. Li, Z. H. Bi, J. H. Chen, J. K. Keum, K. Dale, S. Dai and A. K. Naskar, Langmuir, 2014, 30, 900–910 CrossRef CAS PubMed.
- H. Peng, G. F. Ma, K. J. Sun, J. J. Mu and Z. Q. Lei, J. Phys. Chem. C, 2014, 118, 29507–29516 CAS.
- H. Peng, G. F. Ma, K. J. Sun, J. J. Mu and Z. Q. Lei, ACS Appl. Mater. Interface, 2014, 6, 20795–20803 CrossRef CAS PubMed.
- B. Xu, H. Duan, M. Chu, G. P. Cao and Y. S. Yang, J. Mater. Chem. A, 2013, 14, 4565–4570 Search PubMed.
- P. P. Su, L. Jiang, J. Zhao, J. W. Yan, C. Li and Q. H. Yang, Chem. Commun., 2012, 48, 8769–8771 RSC.
- M. G. Hahm, A. M. R. Leela, D. P. Cole, J. A. Vento, M. Rivera, J. Nam and R. Vajtai, Nano Lett., 2012, 12, 5616–5621 CrossRef CAS PubMed.
- G. F. Ma, H. Peng, J. J. Mu, H. H. Huang, X. Z. Zhou and Z. Q. Lei, J. Power Sources, 2013, 229, 72–78 CrossRef CAS PubMed.
- Q. Wang, J. Yan, Y. B. Wang, T. Wei, M. L. Zhang, X. Y. Jing and Z. J. Fan, Carbon, 2014, 67, 119–127 CrossRef CAS PubMed.
- Y. P. Zhai, Y. Q. Dou, D. Y. Zhao, P. F. Fulvio, R. T. Mayes and S. Dai, Adv. Mater., 2011, 23, 4828–4850 CrossRef CAS PubMed.
- L. Demarconnay, E. Raymundo-Pinero and F. Béguin, Electrochem. Commun., 2010, 12, 1275–1278 CrossRef CAS PubMed.
- X. J. He, R. C. Li, J. S. Qiu, K. Xie, P. H. Ling, M. X. Yu, X. Y. Zhang and M. D. Zheng, Carbon, 2012, 50, 4911–4921 CrossRef CAS PubMed.
- Q. Wang, J. Yan, T. Wei, J. Feng, Y. M. Ren, Z. J. Fan, M. L. Zhang and X. Y. Jing, Carbon, 2013, 60, 481–487 CrossRef CAS PubMed.
| This journal is © The Royal Society of Chemistry 2015 |

