Enhanced cycle life of lead-acid battery using graphene as a sulfation suppression additive in negative active material

Kan Kan Yeunga, Xinfeng Zhanga, Stephen C. T. Kwoka, Francesco Ciucci*ab and Matthew M. F. Yuen*a
aDepartment of Mechanical and Aerospace Engineering, The Hong Kong University of Science and Technology, Hong Kong, China. E-mail: meymf@ust.hk; mefrank@ust.hk; Fax: +852 2358 1543; Tel: +852 2358 7189, +852 2358 7187
bDepartment of Chemical and Biomolecular Engineering, The Hong Kong University of Science and Technology, Hong Kong, China

Received 11th June 2015 , Accepted 17th August 2015

First published on 17th August 2015


Abstract

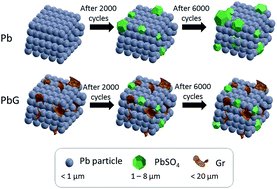
In this article, we report the addition of graphene (Gr) to negative active materials (NAM) of lead-acid batteries (LABs) for sulfation suppression and cycle-life extension. Our experimental results show that with an addition of only a fraction of a percent of Gr, the partial state of charge (PSoC) cycle life is significantly improved by more than 140% from 7078 to 17[thin space (1/6-em)]157 cycles. The particle size on a charged Pb-graphene (PbG) plate after the PSoC test is also found to be reduced by around 25% when compare with a Pb plate. Charge and discharge densities measurements from the cyclic voltammetry (CV) test show an enhancement with the addition of Gr, indicating an improvement in the reversibility reaction of PbSO4. An electrochemical model, which takes into account of reduced interfacial resistance, improved charge transfer and enhanced electroactive surface area, is proposed to elucidate the role of Gr throughout the course of a PSoC cycle test. It is demonstrated that experimental results are aligned with our proposed model with enhanced cycle life performance, where PbG plate maintains a higher electroactive surface area for adsorption and desorption of Pb2+ ions at the interface between active material and electrolyte occurs in parallel to reduced charge transfer.

1. Introduction

The LAB is the oldest rechargeable battery with over 150 years of history. Although most research focus has shifted to lithium-ion (Li-ion) batteries, LABs are still widely used in industry because the availability of Li is limited1,2 and the Li recycling process is technically difficult3 and economically unpractical.4 Studies of LABs are of great interest especially in developing countries such as China and India due to their low manufacturing cost, high materials abundance, low temperature performance, low self-discharge, easy recycling, and high safety.5,6 As reviewed by Liu,7 LABs take up more than 60% of the total battery market with major applications in grid utility support systems, photovoltaic technologies, and transportation. One of the major limitations of LABs is their limited cycle life brought about by sulfation that is caused by the crystallization of non-conductive lead sulfate (PbSO4) crystals and gradually decreases the amount of usable active materials. The operating mode of PSoC, where LABs run on short duration of charge and discharge, can easily lead to sulfation. The overall cell reaction of LABs can be expressed through eqn (1) showing that PbSO4 crystals are formed under the discharge process. On a negative Pb electrode, Pb is oxidized to Pb2+ and combines with SO42− ions from electrolyte sulfuric acid (H2SO4) to form PbSO4 crystals at the electrode surface. These reactions are shown in eqn (2)–(4).
 
image file: c5ra11114e-t1.tif(1)
 
Pb ⇌ Pb2+ + 2e (2)
 
H2SO4 ⇌ SO42− + 2H+ (3)
 
Pb2+ + SO42− ⇌ PbSO4 (4)

The reactions are reversed during the charge process with the dissolution of PbSO4 crystals. When non-reversible PbSO4 crystals progressively replace battery active materials, the conductive network pathway is impeded. The accumulation of hard crystals significantly hinders current distribution and electrolyte diffusion and limits cycle life. While PbSO4 crystals are formed on both positive and negative electrodes during the charging process, the sulfation problem is more pronounced with lower reversibility of PbSO4 formation and dissolution during charge and discharge on negative electrodes due to the lower capacitance of negative active materials,8 the lower ability to absorb short and sharp charge pulses,8,9 and lower specific surface area, where a typical specific surface area of NAM is about 10 times lower than that of positive active material (PAM).10,11

It is well-recognized that carbon additives are the most widely used materials in controlling sulfation. Studies have shown that various types of carbon additives, e.g., carbon black,12–14 activated carbon,15,16 graphite,13,17 expanded graphite,15 carbon nanotubes,5,14,18,19 and low dimensional carbon14,19,20 are effective in extending cycle life through sulfation suppression. Moseley21 summarized the proposed functions of carbon additives that include: (i) availability of additional nucleation sites, (ii) restriction of crystal growth, (iii) enhancement of the electrical conductivity, (iv) reduction of the hydrogen over-potential, (v) enhancement of the capacitance, (vi) intercalation of hydrogen into graphite structure with an increase in electronic conductivity, and (vii) electro-osmotic pumping of electrolyte ions in the presence of graphite. However, the fundamental understanding of carbon's role in the formation and dissolution mechanism of PbSO4 is still not clear, in particular, under PSoC regime.

The State-of-Charge (SoC) of the battery is related to the electrochemical double layer (EDL) structure as reported by Kirchev et al.11,22–24 It was found that the formation of PbSO4 could modify the EDL structure and reduced the electroactive surface area that participates in the charge and discharge processes. Results from their proposed electrochemical circuit model demonstrated the evolution of EDL during one cycle of rapid pulse charging. However, the effect of EDL structure evolution during the course of battery cycle life is still unclear and requires further investigation.

In this article, we report the addition of Gr to NAM in LABs for sulfation suppression. In an effort to suppress sulfation, defect-free Gr additive is added to Pb to maintain conductive pathway for electrochemical reactions. It is proposed that fragments of 3D Gr that are transformed from 3D Gr foam maintain their interconnected three-dimensional structure, and provide an extended pathway with enhanced contact to active material in comparison to other forms of Gr platelets. These fragments have better conformability in micron length scale compared with other carbon additives. The PSoC cycle life has improved by more than 140% after addition of 0.2 wt% Gr. We carried out a series of electrochemical characterizations including CV and EIS to study the change of EDL structure upon PSoC cycling. EIS data can elucidate the EDL structure and interfacial features of the electrode and electrolyte interface. To demonstrate the effect of Gr on the battery cycle life, we proposed an electrochemical circuit model to track the EDL structural changes utilizing the double layer (DL) capacitance results. It is believed that Gr can effectively control the growth of electroactive surface area and suppress sulfation rate.

2. Experimental procedures

2.1 Synthesis of 3D Gr

The Gr powders used in this work were synthesized from 3D Gr by CVD as reported previously.25 Cleaned nickel foam was used as the growth template for 3D Gr. The nickel foam was placed in a quartz tube furnace with the temperature gradually increased up to 900 °C according to the growth profile as illustrated in Fig. S1. Argon (200 sccm) was used to provide an inert environment, while hydrogen (24 sccm) and acetylene (12 sccm) were used as carrier and working gases respectively.

After the CVD process, a continuous network of Gr that conformed to the shape of nickel foam was obtained. The underlying nickel foam substrate was then dissolved away in an aqueous solution of 3 M hydrochloric acid and 0.15 M iron(III) nitrate in an 80 °C water bath. After the dissolution of the nickel foam, the freestanding 3D Gr was rinsed with acetone and DI water alternately at least three times to dissolve any nickel ions that were attached on the 3D Gr surface. After a series of rinsing cycles, the purified 3D Gr was then dried in a vacuum oven overnight.

2.2 Fabrication of negative plates

Commercial NAM that contained Pb powder with 1.2 wt% BaSO4, 0.2 wt% lignin and 0.1 wt% binder was obtained from the Saite Power Source Science & Technology Co., Ltd in China. The as-received NAM was processed into fine powder through ball milling. In order to uniformly mix the Gr into the NAM, CVD-synthesized 3D Gr was processed into a powder form, as shown in Fig. S2e and f, through sonication in N-methylpyrrolidinone, followed by filtration and rinsing with DI water. Ball-milled NAM and Gr powders (0.2 wt%) were then mixed together with an appropriate amount of H2SO4 to form PbG paste. This weight percentage was optimized on the basis of a set of experiments with various amount of Gr added. Details can be found in ESI. This paste was applied on a commercial Pb-alloy grid and was dried in a humidity chamber at 80 °C and under 90% R.H. for 24 h, followed by further drying at 45 °C for another 24 h to complete the PbG plates. Pb electrodes with 0.2 wt% carbon black (Carbot Corporation), 0.2 wt% carbon fiber (Jingzhiyuan Carbon Graphite Material Co. Ltd) and 0.2 wt% multi-walled carbon nanotubes (Shenzhen NanoTech Port Co. Ltd) were also prepared for comparison purposes. They were named as PbCB, PbCF and PbCNT respectively. Preparation of control Pb plates followed the same procedures above except the addition of any carbon additives. The synthesized Pb or PbG negative plates all had the dimensions of 15 mm × 13 mm × 2 mm.

2.3 Fabrication of complete cells

Each complete cell was comprised of one as-fabricated negative plate and was placed between two commercial positive plates of dimensions 15 mm × 13 mm × 4 mm with absorbent glass mats as separators. All the cells were packed in vented cell cases filled with 1.28 g cm−3 H2SO4.

3. Characterization methods

3.1 PSoC tests

All the cells went through formation cycles, which comprised ten cycles of 2 h rest and 4 h charge at 3 mA. All the formatted cells were subjected to five cycles of conditioning (full charge and discharge at 20 mA) to obtain the initial capacity. They were then discharged to 50% of the initial capacity, followed by the PSoC cycling procedure composes of charge or discharge at 60 mA for 30 s and rest for 5 s until they reached cut-off potential 1.5 V. After the completion of the PSoC run, all cells were fully charged at 20 mA up to 2.4 V. Battery cycling tests were performed with the LAND Battery Testing System CT2001A.

3.2 Surface and electrochemical characterizations

Optical images of nickel foam and CVD Gr on nickel foam were taken with an Olympus BH2-MJLT. Gr characterization was performed using the micro-Raman spectroscopy Renishaw RM3000 with laser excitation wavelength of 514.5 nm. Transmission Electron Microscopy (TEM) JEOL 2010 was employed to identify the quality and layer number of the Gr. X-ray diffraction spectra (XRD) of Pb and PbG plates before and after PSoC were measured by a high-resolution X-ray diffraction system (PW1825, Philips) using Cu Kα radiation. The BET surface area and BJH pore size distribution of battery pastes were measured with a Coulter SA 3100. Carbon additives and NAM characterizations were carried out utilizing the scanning electron microscope (SEM) JEOL 6390 or 7100 at 20 kV or 5 kV respectively. Both Pb and PbG cells were tested under cyclic voltammetry (CV) and electrochemical impedance spectroscopy (EIS) at various stages of PSoC cycling tests as mentioned previously. CV and EIS were carried out with Bio-logic VSP testing system. CV tests were scanned from −1.8 V to 0 V at a scan rate of 5 mV s−1. The working electrode was Pb or PbG. The counter electrode was PbO2 and the reference electrode was mercury sulfate electrode Hg|Hg2SO4|H2SO4. EIS was performed in the frequency range from 10 mHz to 10 kHz with a 10 mV perturbation.

4. Results and discussion

4.1 Prolonged PSoC cycle life by Gr additive

Results of PSoC cycle life with various carbon additives are shown in Fig. 1. Shown in Fig. 1a is the charge and discharge end-of-potential during one run of PSoC test. The average results from three sets of batteries are plotted in Fig. 1b. All carbon additives had some positive influence to the cycle life while PbG demonstrated the best cycle life enhancement with over 140%. It can be seen that the Pb battery failed at an early stage with only 7078 PSoC cycles, while the PbG battery cycled up to 17[thin space (1/6-em)]157 PSoC cycles. By comparing the end-of-charge and discharge during PSoC test of Pb and PbG plates, we can clearly see that the decreasing trend of the PbG end-of-potential during PSoC was significantly smaller than that of Pb plate. This suggested that the steep potential drop is caused by the formation of a PbSO4 layer at the plate surface.6 The smaller potential drop of the PbG plate suggested that the addition of Gr suppresses sulfation. During rapid charge and discharge pulses at 0.7C, dissolution and formation of PbSO4 reactions occur throughout the plate, and especially on the plate surface. Gr additives remain as conductive platforms for those reactions and help to maintain high level of electrochemically active surface. As it can be seen from the XRD spectra in Fig. 1c and d, charged plates after PSoC testing (red lines) were mainly composed of Pb and PbSO4. Black lines show the results of cured plates before PSoC testing for benchmarking. Those peaks can be well identified into Pb (JCPDS file no. 040686) and PbSO4 (JCPDS file no. 361461). The intensity ratio IPb/IPbSO4 of the main characteristic peaks of Pb and PbSO4 can be used to estimate the relative content of Pb and PbSO4 in the active materials.26 The calculated ratio of Pb and PbG plates are 0.45 and 1.11 respectively, which indicated that less PbSO4 particles were present in the charged PbG plate. This result suggested that the reversibility of PbSO4 particles is higher with the addition of Gr.
image file: c5ra11114e-f1.tif
Fig. 1 (a) PSoC results of Pb and Pb with carbon additives plates, (b) enhancement of PbG plate, and XRD results of (c) Pb and (d) PbG plates before and after PSoC (7000 and 10[thin space (1/6-em)]000 cycles, respectively) testing.

It is likely that the addition of Gr modified the microstructure of paste, which possibly changed ions diffusion path and maintained higher surface area for electrochemical reactions. The BET surface area of the Pb and PbG pastes were measured to be 0.384 m2 g−1 and 0.499 m2 g−1 respectively, which are close to values 0.5–0.8 m2 g−1 as reported by Calábek et al.10 As shown in the BET isotherm in Fig. 2, the presence of a small hysteresis indicated that the paste microstructure was changed from non-porous to mesoporous.27 The addition of Gr optimized the NAM microstructure and enhanced the number of electroactive sites for the formation and dissolution of smaller PbSO4 particles. The conformal 2D planar Gr structure allows enhanced contact surface with Pb active particles in comparison with 0D and 1D carbon additives. 0D carbon black or activated carbon particles that have low affinity to Pb do not disperse well in NAM to form efficient conductive pathways, and result in a reduction of pore size with poor performance.28 1D carbon nanotubes require additional treatments, such as acid treatment5 and oxidation treatment,18 to de-bundle the nanotubes for uniform dispersion. 2D Gr platelets have a high aspect ratio and can be easily dispersed within NAM to provide an extended charge transfer pathway with an enhanced contact surface with Pb.29 Our experimental results in Fig. 1 also demonstrated that 2D additives are more effective in cycle life enhancement with better sulfation suppression. The characterizations of carbon additives are included in ESI file.


image file: c5ra11114e-f2.tif
Fig. 2 Pore size distribution and BET isotherm (insets) of (a) Pb paste and (b) PbG paste.

SEM images of the Pb and PbG during the course of PSoC testing are shown in Fig. 3. NAM particles of both plates were well below micron-meter range as shown in Fig. 3a and d. At PSoC cycle 4000, both samples were mainly covered with nano-sized NAM particles as shown in Fig. 3b and e, but NAM particles on the Pb plate started to form some micron-sized particles. SEM images of the Pb and PbG after the PSoC tests and after charged are shown in Fig. 3c and f respectively. Particles that were formed on the Pb plate were not uniform in size and ranged from 1 to 8 μm, while particles that were formed on the PbG plate were mostly around 1 to 2 μm, which were smaller by around 25% than those on the Pb plate. The high reversibility of particles on the PbG plate can be observed as these SEM images were taken after PSoC testing followed by charging to full capacity. Gr is well mixed within NAM with high affinity for attachment to Pb particles. As proposed by Pavlov et al.,28 carbon additives with high affinity to Pb integrate into Pb current collectors, which lead to the formation of a new branch of Pb-carbon active mass. As it can be seen from the SEM images and backscattered images in Fig. 4 that were taken after 10[thin space (1/6-em)]000 PSoC cycles of a PbG plate, Gr, which are indicated by arrows in Fig. 4, are well buried within NAM and the Gr pathway likely spans from a few to tens of microns. From the magnified area images shown in Fig. 4c and d, it is apparent that Gr might provide extended conducting pathways for PbSO4 formation and dissolution during charge and discharge respectively. In turn, this would be beneficial to the sulfation suppression and cycle life enhancement.


image file: c5ra11114e-f3.tif
Fig. 3 SEM images of Pb NAM (a) before PSoC, (b) after 4000 PSoC cycles, (c) after PSoC failure and recharge, and PbG NAM (d) before PSoC, (e) after 4000 PSoC and (f) after PSoC failure and recharge.

image file: c5ra11114e-f4.tif
Fig. 4 (a) SEM and (b) backscattered images of recharged PbG plate after 10[thin space (1/6-em)]000 PSoC cycles, (c) SEM and (d) backscattered images of the magnified area in the center of (a) and (b). White arrows indicate Gr on the PbG plate.

4.2 Reduced charge transfer resistance brought by Gr

In order to elucidate the role of the Gr additive in the charge and discharge reactions, CV and EIS tests were done to study the electrochemical properties of the Pb and PbG plates at various stages: 0, 2000, 4000 and 6000 PSoC cycles. The current density was enhanced with the addition of Gr as demonstrated in the CV curves in Fig. 5. CV test started at the open circuit potential (−0.96 V) with scanning direction shown in Fig. 5. At the initial stage, a typical oxidation peak where Pb is oxidized to PbSO4 can be found at approximately −0.65 V, and a typical reduction peak where PbSO4 is reduced back to Pb can be found at around −1.2 V.6,12 It can be seen that there were no significant shift of the oxidation and reduction potentials with the addition of Gr. In addition, the PbG plate showed improved current density throughout the cycling test when compare with the control. The higher oxidation and reduction current density suggests that the PbG plate has a higher utilization of Pb active particles. It is likely that Gr has an electrocatalytic effect and the electron transfer is an interfacially enhancement phenomenon inducing a higher electron flux. After 6000 PSoC cycles, the CV curve of PbG plate still shows a higher current density than the bare Pb plate suggesting an enhanced reversibility reaction, which is in agreement with the XRD results discussed in the previous section. Furthermore, the PSoC cycle life enhancement brought by Gr goes beyond the increase in active surface area and pore size. The presence of Gr in NAM improves the conductive pathway with enhanced charge transfer. Gr remains as the conductive pathway and promotes the formation and dissolution of small PbSO4 crystals, which is in agreement with the SEM results as shown in Fig. 3.
image file: c5ra11114e-f5.tif
Fig. 5 CV results of (a) Pb plate and (b) PbG plate.

EIS was performed to measure the plates' internal impedance and to study the charge and discharge mechanism as an effect of PSoC cycle. EIS data for Pb and PbG are shown in Fig. 6a and b respectively. We propose using an equivalent Randles circuit model, as shown in Fig. 6c, to evaluate the electrochemical reactions on the NAM plate with the addition of Gr. Similar models were adopted by other researchers11,23,30,31 for studying the electrochemical reactions in LAB. The equivalent model shown in Fig. 6c composes of ohmic resistance R1 that includes the interfacial resistance and the electrolyte resistance. R2 gives the charge transfer resistance in the reaction layer where electrochemical reaction processes occur at the interface of active materials. Constant phase element CPE1 represents the non-ideal capacitance of the double layer. R3 is the resistance due to mass transport of Pb2+ within the adsorption layer, and constant phase element CPE2 is the non-ideal capacitance resulting from the adsorption layer. The Warburg element W1 that represents the semi-infinite linear diffusion process is added in series to R3.


image file: c5ra11114e-f6.tif
Fig. 6 EIS results of (a) Pb plate and (b) PbG plate, and (c) schematic illustrates the equivalent electrical circuit models of plate and the charge transfer across the interface PbSO4 film with or without Gr and the subsequent PbSO4 formation during discharge process.

The proposed formation of PbSO4 during discharge process is shown in Fig. 6c. Pb2+ ions that are formed from the charge-transfer reaction (eqn (2)) are then adsorbed on Pb surface for crystallization. SO42− and H+ ions are dissociated in the electrolyte according to eqn (3). The combination of desorbed Pb2+ and SO42− ions allows the crystallization of PbSO4 on the plate as shown in eqn (4). The formation and dissolution of PbSO4 is determined by a number of parameters such as diffusion of Pb2+ ions, reduction and oxidation of Pb2+ ions and charge transfer rate.12 The differences in charge transfer rate across the electrode and electrolyte interface with or without Gr can be identified from the EIS results.32,33 The ohmic resistance R1 values of the two systems are summarized in Fig. 7a with the R1 values of the PbG plates being 40–65% lower than that of the Pb plates. Our EIS results are in agreement with the proposed idea that the addition of Gr enhances conductivity facilitating charge transfer between the interface of the electrolyte and plate surface. Gr additives, unlike Pb particles, do not take part in the electrochemical processes but provide a network for charge transfer serving as the preferred conducting pathway in the NAM operation. On the PbG plate, the high reversibility of the PbSO4 back to Pb according to eqn (2) and (4) is maintained due to reduced ohmic resistance. The R1 values remained about the same throughout the PSoC cycling test suggested the stable kinetic behavior was maintained.34 With an enhanced charge transfer across the interface of Pb/Gr, the reversibility of the PbSO4 is enhanced with less accumulation of non-conductive PbSO4 crystals. Therefore, the R2 values that were measured of the PbG plate at any stage of the PSoC test were lower than those of the Pb plate as shown in Fig. 7b. Despite having similar initial values before PSoC cycling test, the increase of the R2 values of the PbG plate after 6000 PSoC cycle was 43% lower than that of the Pb plate. It is likely that charge transfer resistance has a close relation to PbSO4 phase and particle size,34 and the reversibility of PbSO4 is enhanced with a reduction in charge transfer resistance. These results are in agreement with SEM observation where the size of PbSO4 crystals formed on the PbG plate were much smaller than those on the Pb plate, and the charge transfer was facilitated with a higher charge or discharge density as showed by the CV test.


image file: c5ra11114e-f7.tif
Fig. 7 (a) Ohmic resistance R1 and (b) charge transfer resistance R2 obtained from EIS tests.

4.3 Proposed mechanism of Gr effect on PbSO4 surface coverage growth

The performance degradation of the Pb/PbG electrodes were directly related to the formation of PbSO4 on the electrode surface, as supported by our SEM observation as well as in the reported literature.5,11,14,16 In addition, we assume that the surface coverage of PbSO4 on the Pb/PbG electrode surface could also affect the charge and discharge performance of the cell. With the addition of Gr, the surface coverage growth of PbSO4 on the electrode surface could be controlled to a lower value and hence improving the PSoC cycle performance. To verify our assumption, we used the DL capacitance values from the EIS data to correlate with the surface coverage of PbSO4 on the electrode surface.11,35 DL capacitance is the measurement of stored charges on the electrode and electrolyte interface and is proportional to electroactive surface area. As LAB undergoes cycling, the DL capacitance value decreases due to the decrease of the electroactive surface area by the irreversible PbSO4 formation.11,35 Based on our assumption and the model described by Kirchev et al.,11 our proposed mechanistic model is illustrated in Fig. 8a demonstrating that the initial DL capacitance C0 is at its highest at cycle N = 0 (before PSoC test) with the most electroactive surface area for ions adsorption. After cycling at N = 2000, electrode is partially covered with irreversible PbSO4 and its DL capacitance C2000 and electroactive surface area are both decreased. DL capacitance C6000 is at its lowest when the electrode surface is dominantly covered with PbSO4 particles and there is limited electroactive surface area left at the interface. Overall, the DL capacitance is C0 > C2000 > C6000. Although protons can be trapped on Gr surface through electrostatic interaction causing a change in DL capacitance,36 the trapping effect is highly reversible and is considered as part of the structural characteristics of an adsorbate film.
image file: c5ra11114e-f8.tif
Fig. 8 (a) Schematic illustrates the evolution of PbSO4 surface coverage as cycle number increases, and (b) capacitance values obtained from EIS curve fitting.

DL capacitance of both Pb and PbG plates at various PSoC cycles are extracted from the EIS measurements and plotted in Fig. 8b. The decreasing DL capacitance trend as cycle number increases agreed with our proposed model. Similar trend was also reported by Lindbergh.35 It can be seen that DL capacitance values decreased at a faster rate for Pb plate when compared to that of the PbG plate. With the enhancement of active surface area and porosity in PbG plate, it is believed that the number of electroactive sites is also increased. Kirchev et al.11 and Kowal et al.37 proposed the charge transfer and process of adsorption and desorption are related to surface coverage. The adsorption and desorption of Pb2+ ions at the interface between active material and electrolyte occurs in parallel to charge transfer, which is represented as a change in DL capacitance.11 With the combination of reduced interfacial resistance, improved charge transfer and enhanced number of electroactive sites brought by Gr, it is likely that the reaction of formation and dissolution of PbSO4 crystals on PbG plate occur at a faster rate than that on Pb plate. Therefore, PbG has less irreversible non-conductive PbSO4 crystals than Pb at any given cycle. This showed that Gr additive helped to maintain electroactive surface area and prevented the accumulation of large PbSO4 crystals.

5. Conclusion

We have shown that with an addition of only a fraction of a percent of Gr, the PSoC cycle life of a LAB is significantly improved by more than 140% from 7078 to 17[thin space (1/6-em)]157 cycles. The average particle size of PbSO4 crystals on a PbG plate after a PSoC test was also found to be reduced by around 25%. An improvement in the reversibility reaction of PbSO4 is shown through the enhanced charge and discharge densities under the CV test. The 2D Gr additive served as a preferred charge transfer pathway with enhanced surface contact with Pb resulting in reduced interfacial resistance, which aligned with our proposed electrochemical model. Addition of Gr also enhanced the electroactive surface area of NAM as demonstrated through a smaller decrease in DL capacitance values throughout the PSoC test when compared with the control sample. The above contributions facilitate the dissolution of big PbSO4 crystals with less surface coverage and suppressed the sulfation rate. The reported experimental results are in good agreement with our proposed electrochemical model that helped in evaluating the electrochemical performance of NAM.

Acknowledgements

This project is supported by the Innovation and Technology Fund ITS/329/13. The authors would like to acknowledge the assistance from Dr Chili Wu and Dr Dengjie Chen. The assistance from the Saite Power Source Science & Technology Co., Ltd., and the Materials Characterization and Preparation Facility at the HKUST are also greatly appreciated. KKY is supported by the postgraduate studentship through the Energy Technology concentration at the HKUST.

References

  1. J. H. Miedema and H. C. Moll, Resour. Policy, 2013, 38, 204–211 CrossRef PubMed.
  2. H. Vikström, S. Davidsson and M. Höök, Appl. Energy, 2013, 110, 252–266 CrossRef PubMed.
  3. J. Xu, H. R. Thomas, R. W. Francis, K. R. Lum, J. Wang and B. Liang, J. Power Sources, 2008, 177, 512–527 CrossRef CAS PubMed.
  4. J. Dewulf, G. van der Vorst, K. Denturck, H. van Langenhove, W. Ghyoot, J. Tytgat and K. Vandeputte, Resour., Conserv. Recycl., 2010, 54, 229–234 CrossRef PubMed.
  5. M. Saravanan, P. Sennu, M. Ganesan and S. Ambalavanan, J. Electrochem. Soc., 2013, 160, A70–A76 CrossRef CAS PubMed.
  6. M. Saravanan, M. Ganesan and S. Ambalavanan, J. Power Sources, 2014, 251, 20–29 CrossRef CAS PubMed.
  7. J. Liu, Adv. Funct. Mater., 2013, 23, 924–928 CrossRef CAS PubMed.
  8. P. T. Moseley, D. A. J. Rand and B. Monahov, J. Power Sources, 2012, 219, 75–79 CrossRef CAS PubMed.
  9. P. T. Moseley, J. L. Hutchison, C. J. Wright, M. A. M. Bourke, R. I. Hill and V. S. Rainey, J. Electrochem. Soc., 1983, 130, 829–834 CrossRef CAS PubMed.
  10. M. Calábek, K. Micka, P. Křivák and P. Bača, J. Power Sources, 2006, 158, 864–867 CrossRef PubMed.
  11. A. Kirchev, F. Mattera, E. Lemaire and K. Dong, J. Power Sources, 2009, 191, 82–90 CrossRef CAS PubMed.
  12. D. Pavlov, T. Rogachev, P. Nikolov and G. Petkova, J. Power Sources, 2009, 191, 58–75 CrossRef CAS PubMed.
  13. D. P. Boden, D. V. Loosemore, M. A. Spence and T. D. Wojcinski, J. Power Sources, 2010, 195, 4470–4493 CrossRef CAS PubMed.
  14. S. Logeshkumar and R. Manoharan, Electrochim. Acta, 2014, 144, 147–153 CrossRef CAS PubMed.
  15. M. Fernández, J. Valenciano, F. Trinidad and N. Muñoz, J. Power Sources, 2010, 195, 4458–4469 CrossRef PubMed.
  16. P. Tong, R. Zhao, R. Zhang, F. Yi, G. Shi, A. Li and H. Chen, J. Power Sources, 2015, 286, 91–102 CrossRef CAS PubMed.
  17. K. Micka, M. Calábek, P. Bača, P. Křivák, R. Lábus and R. Bilko, J. Power Sources, 2009, 191, 154–158 CrossRef CAS PubMed.
  18. R. Shapira, G. D. Nessim, T. Zimrin and D. Aurbach, Energy Environ. Sci., 2013, 6, 587–594 CAS.
  19. S. M. Kumar, S. Ambalavanan and S. Mayavan, RSC Adv., 2014, 4, 36517–36521 RSC.
  20. J. Ma, D. Wang, F. Chen and M. Fang, Chin. J. Inorg. Chem., 2013, 29, 1935–1941 CAS.
  21. P. T. Moseley, J. Power Sources, 2009, 191, 134–138 CrossRef CAS PubMed.
  22. A. Kirchev, M. Perrin, E. Lemaire, F. Karoui and F. Mattera, J. Power Sources, 2008, 177, 217–225 CrossRef CAS PubMed.
  23. A. Kirchev, A. Delaille, M. Perrin, E. Lemaire and F. Mattera, J. Power Sources, 2007, 170, 495–512 CrossRef CAS PubMed.
  24. A. Kirchev, A. Delaille, F. Karoui, M. Perrin, E. Lemaire and F. Mattera, J. Power Sources, 2008, 179, 808–818 CrossRef CAS PubMed.
  25. X. Zhang, K. K. Yeung, Z. Gao, J. Li, H. Sun, H. Xu, K. Zhang, M. Zhang, Z. Chen, M. M. F. Yuen and S. Yang, Carbon, 2014, 66, 201–209 CrossRef CAS PubMed.
  26. X. Zou, Z. Kang, D. Shu, Y. Liao, Y. Gong, C. He, J. Hao and Y. Zhong, Electrochim. Acta, 2015, 151, 89–98 CrossRef CAS PubMed.
  27. K. S. W. Sing, Pure Appl. Chem., 1985, 57, 603–619 CrossRef CAS.
  28. D. Pavlov, P. Nikolov and T. Rogachev, J. Power Sources, 2011, 196, 5155–5167 CrossRef CAS PubMed.
  29. M. Pumera, Chem. Rec., 2009, 9, 211–223 CrossRef CAS PubMed.
  30. F. Huet, J. Power Sources, 1998, 70, 59–69 CrossRef CAS.
  31. S. Rodrigues, N. Munichandraiah and A. K. Shukla, J. Power Sources, 2000, 87, 12–20 CrossRef CAS.
  32. F. Ciucci, T. Carraro, W. C. Chueh and W. Lai, Electrochim. Acta, 2011, 56, 5416–5434 CrossRef CAS PubMed.
  33. F. Ciucci, Electrochim. Acta, 2013, 87, 532–545 CrossRef CAS PubMed.
  34. F. Gao and Z. Tang, Electrochim. Acta, 2008, 53, 5071–5075 CrossRef CAS PubMed.
  35. G. Lindbergh, Electrochim. Acta, 1997, 42, 1239–1246 CrossRef CAS.
  36. Z. Huang, X. Zheng, W. Lv, M. Wang, Q. Yang and F. Kang, Langmuir, 2011, 27, 7558–7562 CrossRef CAS PubMed.
  37. J. Kowal, H. Budde-Meiwes and D. U. Sauer, J. Power Sources, 2012, 207, 10–18 CrossRef CAS PubMed.

Footnote

Electronic supplementary information (ESI) available: Characterizations of Gr and PSoC results with various Gr percentage. See DOI: 10.1039/c5ra11114e

This journal is © The Royal Society of Chemistry 2015
Click here to see how this site uses Cookies. View our privacy policy here.