DOI:
10.1039/C5RA11086F
(Paper)
RSC Adv., 2015,
5, 67102-67114
Wear rate of a TiAl matrix composite containing 10 wt% Ag predicted using the Newton interpolation method
Received
11th June 2015
, Accepted 9th July 2015
First published on 16th July 2015
Abstract
The longevity of a mechanical component was evaluated by predicting the wear rate of the material. The primary purpose of this study was to construct three prediction formulas (W4(F), W4(n) and W4(t)) to predict the wear rate at different applied loads F, rotation speeds n and sliding times t based on a TiAl matrix composite containing 10 wt% Ag. Prediction formulas of wear rate, which were constructed by the Newton interpolation method, were evaluated by making a comparison between the testing error and computational error. The results showed that the prediction formulas (W4(F), W4(n) and W4(t)) of wear rate were accepted for smaller computational errors. It was found that the prediction accuracy gradually increased for the higher binding force of wear debris at larger applied loads F (see formula W4(F)), and slightly decreased for random impacting of wear debris at higher rotation speeds n (see formula W4(n)), as well as being relatively stabilized for incessant forming of anti-friction films at different sliding times t (see formula W4(t)).
1. Introduction
In recent years, TiAl alloys have been paid extensive attention in order to satisfy the urgent requirements of the aerospace and automotive industries because of their excellent mechanical and thermal behaviors.1–4 However, TiAl alloys, due to their poor tribological behaviors, have limited further applications in the industrial field.5
The tribological behaviors of TiAl alloys were significantly improved by fabricating a TiAl matrix self-lubricating composite containing solid lubricants. Shi et al.6 studied the tribological behavior of a TiAl matrix composite containing 10 wt% Ag (TiAl-10 wt% Ag), and found that the friction coefficient and wear rate of TiAl-10 wt% Ag were lower than those of TiAl alloys at temperatures of 25–400 °C. Currently, many mechanical component failures are caused by the excessive wear of materials. Hence, the wear-resistance of materials and the longevity of mechanical components could be evaluated by investigating the wear rate.
Many tribological researchers have made a great effort to obtain the formula of wear rate. Archard7 thought that weight loss only happened in the contact regions of the matched surfaces during sliding wear, and defined wear volume G, as shown in formula (1):
where wear volume
G is proportional to the wear coefficient
K, sliding distance
L and normal stress
σn, as well as being inversely proportional to the hardness
H of the softer material. Kishore
et al.8 reported that in the initial stage, the wear rate was mainly determined by the applied load, and in the steady stage, the wear rate mainly depended on the synergetic effect of the applied load and sliding velocity. Boneh
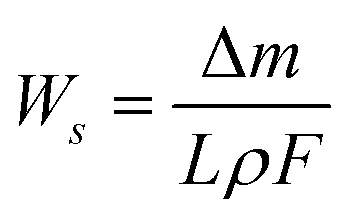
et al.9 found that in the steady stage, the wear rate has a linear relation with the applied load at a low velocity. Kasolang
et al.10 detected that the wear rate
Ws was inversely proportional to the sliding distance
L, material density
ρ and applied load
F, and proportional to the weight loss Δ
m. Wear rate
Ws could be defined as formula
(2):
| |
 | (2) |
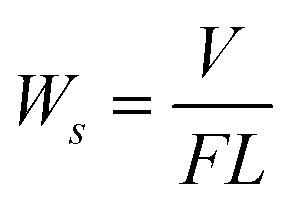
Gong et al.11 thought that during dry sliding, wear debris was continually oxidized, resulting in the generation of massive oxides, lowering the weight loss Δm. Consequently, the wear volume V could be adopted to better calculate the wear rate containing the generated oxides. The wear rate Ws was optimized as formula (3):
| |
 | (3) |
Currently, the wear rate formula (3) is widely accepted by tribological researchers. However, the wear volume V needs to be measured after each tribological test, leading to the poor wear rate prediction of formula (3), and the waste of energy and material. The test conditions of the applied load F, rotation speed n and sliding time t needed to be chosen before the tribological tests based on the ball-on-disk tribometer. Hence, the wear rate formula (3) would be further optimized as the formula of the applied load F, rotation speed n, sliding time t and cross-section area A of the wear scar, in order to construct the prediction formula of wear rate. The Newton interpolation method was not restrained by the increasing number of interpolation nodes, and the measured values (wear rate Ws) at the different interpolation nodes (Ws, F), (Ws, n) and (Ws, t) were not influenced by the formula structure using the Newton interpolation method. Cui et al.12 adopted the Newton interpolation method to predict the state of charge, and found that the Newton interpolation method could be successfully adopted to predict the charge state of lead batteries. Hence, the Newton interpolation method was chosen to construct the prediction formula of wear rate. To our best knowledge, few works currently report the prediction formula of wear rate in the form of a Newton interpolation polynomial.
In this study, TiAl-10 wt% Ag, for its excellent tribological behavior, was chosen as the test material. The prediction formula of wear rate was constructed using the Newton interpolation method after three steps. Step 1: formula (3) was optimized as the wear rate formula Ws of the applied load F, rotation speed n, sliding time t and cross-section area A of the wear scar. Step 2: three cross-section area formulas A4(F), A4(n) and A4(t) (A4(F) between A and F, A4(n) between A and n, as well as A4(t) between A and t) were constructed using the Newton interpolation method based on five equidistant interpolation nodes. Step 3: three prediction formulas (W4(F), W4(n) and W4(t)) in the form of the Newton interpolation polynomial were respectively obtained by substituting the formulas A4(F), A4(n) or A4(t) into the optimized formula Ws of wear rate. Three prediction formulas (W4(F), W4(n) and W4(t)) of wear rate were evaluated by making a comparison between the computational error and testing error. The different computational errors were reasonably interpreted by wear mechanisms at different applied loads F, rotation speeds n or sliding times t. The prediction formulas (W4(F), W4(n) and W4(t)) of wear rate could be adopted to evaluate the longevity of important mechanical components by predicting the wear rate at the different applied loads F, rotation speeds n or sliding times t.
2. Experimental details
2.1 Materials
TiAl-10 wt% Ag (48 at% Ti-47 at% Al-2 at% Cr-2 at% Nb-1 at% B-10 wt% Ag), which was fabricated using spark plasma sintering (SPS), was composed of Ti, Al, B, Nb, Cr and Ag. Before being fabricated, the powders of Ti, Al, B, Nb, Cr and Ag were loaded into Teflon vials, and then mixed by vibration milling (45 Hz in frequency). After being mixed and dried, the powders were sealed in the cylindrical graphite molds (25 mm in inner diameter), and sintered using D.R. Sinter® SPS3.20 apparatus (made in Sumitomo Coal & Mining, now SPS Syntex Inc.) for 8 min at the temperature and pressure of 1000 °C and 30 MPa in a pure Ar atmosphere for protection. The heating rate of 100 °C min−1 was chosen.
2.2 Vicker’s microhardness and density
Vicker’s hardness of TiAl-10 wt% Ag was measured by Vicker’s hardness apparatus according to the ASTM standard E92-82.13 To attain the mean hardness of 5.97 GPa, ten tests were repeatedly carried out at a load of 10 N. The mean density of 4.22 g cm−3 was acquired using Archimedes’ principle in terms of the ASTM Standard B962-08.14
2.3 Tribological test
To investigate the tribological properties of TiAl-10 wt% Ag, tribological tests were carried out on a ball-on-disk high temperature tribometer of HT-1000 (Zhong Ke Kai Hua Corporation, China) according to the ASTM Standard G99-95.15 The cylindrical sample with the diameter and height of 25 mm and 8 mm acted as the rotary disk against the stationary Si3N4 ball of 6 mm diameter. The districts [1.65 N, 11.65 N], [56 rpm, 504 rpm] and [900 s, 4500 s] were respectively chosen for the applied load F (N (Newton)), rotation speed n (rpm (revolutions per minute)) and sliding time t (s (second)). At 45–65% relative humidity, three tests were repeatedly carried out to obtain the mean wear rate under the different conditions of the tribological tests, as shown in Table 1.
Table 1 Tribological test at different applied load F, rotation speed n or sliding time t
| Test conditions |
F-392-3600 (N-rpm-s) |
9.15-n-3600 (N-rpm-s) |
9.15-392-t (N-rpm-s) |
| 1 |
1.65-392-3600 |
9.15-56-3600 |
9.15-392-900 |
| 2 |
4.15-392-3600 |
9.15-168-3600 |
9.15-392-1800 |
| 3 |
6.65-392-3600 |
9.15-280-3600 |
9.15-392-2700 |
| 4 |
9.15-392-3600 |
9.15-392-3600 |
9.15-392-3600 |
| 5 |
11.65-392-3600 |
9.15-504-3600 |
9.15-392-4500 |
2.4 Microstructure analysis
TiAl-10 wt% Ag was examined using XRD with Cu Kα radiation at 30 kV and 40 mA at a scanning speed of 0.01° s−1. The cross-section area A of the wear scar was measured using a surface profiler of ST400 (Nanovea). The wear scar morphology was analyzed using an electron probe microanalyzer JAX-8230 (EPMA).
3. Results and discussion
3.1 Compositions of TiAl-10 wt% Ag
Fig. 1 shows the typical XRD pattern of TiAl-10 wt% Ag fabricated using SPS. As is clear in this pattern, it can be concluded from the different diffraction peaks that TiAl-10 wt% Ag was mainly composed of TiAl, TiC and Ag.
 |
| | Fig. 1 Typical XRD pattern of TiAl-10 wt% Ag fabricated using SPS. | |
Fig. 2 exhibits the microstructure and elemental distribution of TiAl-10 wt% Ag. It is clearly shown in Fig. 2 that the solid lubricant Ag was uniformly distributed in the TiAl matrix composite.
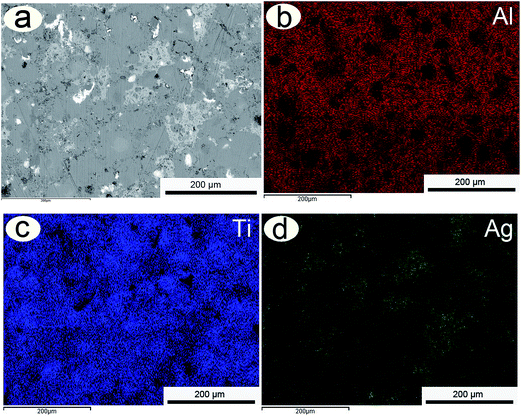 |
| | Fig. 2 Microstructure and elemental distribution of TiAl-10 wt% Ag. | |
3.2 Optimizing the formula of wear rate
To construct three cross-section area formulas A4(F), A4(n) and A4(t) in the form of the Newton interpolation polynomial, formula (3) needed to be further optimized.
Wear volume V in formula (3) can be written as formula (4):16
Wear volume V was additionally rewritten as formula (5) for C = 2πR:
where
A is the cross-section area of the wear scar in mm
2,
C is the perimeter of the wear scar in mm and
R is the mean radius of the wear scar in mm. The cross-section area
A of the wear scar could be measured using the surface profiler ST400.
Fig. 3 shows the profile of the wear scar of TiAl-10 wt% Ag. When the measuring stylus of the surface profiler slowly moved across the wear scar along the straight line BB (see
Fig. 3b), the cross-section area
A of the wear scar (see
Fig. 3a) was gradually obtained by recording the coordinate positions of the measuring stylus.
 |
| | Fig. 3 Profile of the wear scar of TiAl-10 wt% Ag: two-dimensional profile of the wear scar (a) and three-dimensional profile of the wear scar (b). | |
Sliding distance L in formula (3) was also expressed as formula (6) for v = (πRn)/30:
| |
 | (6) |
where
v,
n and
t were the sliding velocity in m s
−1, rotation speed in rpm and sliding time in rpm, respectively.
Based on the ball-on-disk tribometer, formula (3) could be optimized as formula (7) by substituting formula (5) and formula (6) into formula (3):
| |
 | (7) |
where
Ws is the wear rate in mm
2 N
−1 rpm
−1 s
−1. The units of the cross-section area
A, applied load
F, rotation speed
n and sliding time
t were mm
2, N, rpm and s, respectively. Hence, the unit of wear rate
Ws could be expressed as mm
2 N
−1 rpm
−1 s
−1.
3.3 Wear rate
Fig. 4 shows the mean wear rate at different applied loads F, rotation speeds n and sliding times t. As shown in Fig. 4a, the wear rate continually decreased with the increase of the applied load F. As is clear in Fig. 4b, the wear rate exhibited a tendency to fluctuate upwards with the increase of rotation speed n. It can be seen from Fig. 4c that the wear rate shows a continuous downward tendency with the increase of sliding time t.
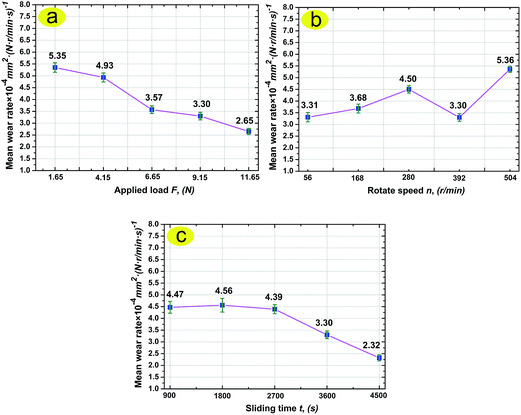 |
| | Fig. 4 Mean wear rate at the different applied loads F (a), rotation speeds n (b) and sliding times t (c). | |
In order to evaluate the longevity of the mechanical components at different applied loads F, rotation speeds n and sliding times t, the wear rate could be predicted by constructing three prediction formulas of wear rate. The three cross-section area formulas A4(F), A4(n) and A4(t) needed to be firstly constructed using the Newton interpolation method.
3.4 Definition
The Newton interpolation method was adopted to construct the cross-section area formulas A4(F), A4(n) and A4(t). The prediction formulas W4(F), W4(n) and W4(t) of wear rate were respectively obtained by substituting formulas A4(F), A4(n) and A4(t) into formula (7). Before being applied, the prediction formulas W4(F), W4(n) and W4(t) in the form of the Newton interpolation polynomial needed to be evaluated by making a comparison between the testing error and computational error. Hence, the definitions of Newton interpolation, testing error, computational error and prediction accuracy were required and are given in the following sections.
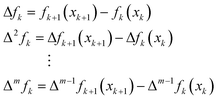
3.4.1 Definition of Newton interpolation17. It was supposed that a function y = f(x) was known at the M + 1 points of (x0, y0), …, (xm, ym), where the values of xk were spread out in the district [a, b] and satisfied yk = f(xk) for k = 0, 1, …, m, namely:| | |
a ≤ x0 < x1 < … < xM ≤ b and yk = f(xk)
| (8) |
When pk(xk) was equivalent to y = f(xk) at x = xk, based on these M + 1 points, the polynomial pM(x) of m degree was constructed in order to approximate y = f(x) in the district [a, b]. Hence, the polynomial pM(x) was called the interpolation polynomial. [a, b] was called the interpolation district. (x0, y0), …, (xm, ym) were known as the interpolation nodes. This method, which was adopted to approximate the function y = f(x), was called the Newton interpolation method.
It was assumed that pM(x) was the interpolation polynomial of m degree, which could be defined as formula (9):
| | |
pM(x) = a0 + a1x + … + akxm
| (9) |
where
a0,
a1, …,
ak were the coefficients of the Newton interpolation polynomial for
k = 0, 1, …,
m. These
M + 1 interpolation nodes of (
x0,
y0), …, (
xm,
ym) could be used to construct the interpolation polynomial
pM(
x) of
m degree. Formula
(9) could be redefined as formula
(10) to satisfy formula
(11):
| | |
pM(x) = a0 + a1(x − x0) + … + am(x − x0)(x − x1)…(x − xm−1)
| (10) |
| | |
f(xj) = pN(xj) for j = 0, 1, …, m
| (11) |
where 1,
x −
x0, …, (
x −
x0), …, (
x −
xm−1) were known as primary functions. Coefficient
a0 was the solution of function
y =
f(
x) at
x =
x0, namely:
y0 =
f(
x0) at
x =
x0. Coefficients
a1,
a2, …,
am can be expressed by forward differences Δ
f0/
h, Δ
2f0/(2
h), …, Δ
mf0/(
m!
hm).
h was the step size of equidistant interpolation nodes of
x0,
x1, …,
xm, namely:
h =
xk+1 −
xk. The forward differences Δ
fk, Δ
2fk, …, Δ
mfk, which were known as the forward difference of first, second, …,
m order, could be defined as formula
(12):
| |
 | (12) |
When variable x was supposed as x0 + eh, namely: x = x0 + eh. e could be written as (x − x0)/h = (x − x0)/(xk+1 − xk) for h = xk+1 − xk, namely: e = (x − x0)/h = (x − x0)/(xk+1 − xk). Hence, formula (10) was written as formula (13) by substituting formula (12) into formula (10):
| |
 | (13) |
In this study, five interpolation nodes were chosen, formula (13) was additionally rewritten as formula (14) for e = (x − x0)/h = (x − x0)/(xk+1 − xk):
| |
 | (14) |
where Δ
f0, Δ
2f0, Δ
3f0 and Δ
4f0, which were respectively known as the forward differences of the first, second, third and fourth order, could be obtained in
Table 2. In order to simplify the application of the Newton interpolation method, based on the software of MATLAB7, a small program was developed to construct the prediction formulas (
W4(
F),
W4(
n) and
W4(
t)) of wear rates.
Table 2 Forward differences for constructing the Newton interpolation polynomial p4(x)
| xk |
fk(xk) |
Δf |
Δ2f |
Δ3f |
Δ4f |
| x0 |
f0(x0) |
Δf0 = f1(x1) − f0(x0) |
Δ2f0 = Δf1 − Δf0 |
Δ3f0 = Δ2f1 − Δ2f0 |
Δ4f0 = Δ3f1 − Δ3f0 |
| x1 |
f1(x1) |
Δf1 = f2(x2) − f1(x1) |
Δ2f1 = Δf2 − Δf1 |
Δ3f1 = Δ2f2 − Δ2f1 |
|
| x2 |
f2(x2) |
Δf2 = f3(x3) − f2(x2) |
Δ2f2 = Δf3 − Δf2 |
|
|
| x3 |
f3(x3) |
Δf3 = f4(x4) − f3(x3) |
|
|
|
| x4 |
f4(x4) |
|
|
|
|
3.5 Applied load F
3.5.1 Constructing the prediction formula W4(F) of wear rate. The cross-section area formula A4(F) (A4(F) between A and F) needed to be constructed using the Newton interpolation method, in order to construct the prediction formula W4(F) of wear rate.Five equidistant interpolation nodes of (F0, A0), (F1, A1), (F2, A2), (F3, A3) and (F4, A4) were chosen as (1.65, 2.07 × 10⁻²), (4.15, 4.81 × 10⁻²), (6.65, 5.58 × 10⁻²), (9.15, 7.11 × 10⁻²) and (11.65, 7.27 × 10⁻²). Table 3 shows the forward differences at different applied loads F. Hence, in the applied load district [1.65 N, 11.65 N], the cross-section area formula A4(F) was defined as formula (18) by the Newton interpolation method:
| |
 | (18) |
Table 3 Forward differences at different applied loads F
| Applied load F (N) |
A(F) |
ΔA(F) |
Δ2A(F) |
Δ3A(F) |
Δ4A(F) |
| 1.65 (F0) |
2.07 × 10⁻² |
2.74 × 10⁻² |
−1.97 × 10⁻² |
2.73 × 10⁻² |
−4.86 × 10⁻² |
| 4.15 (F1) |
4.81 × 10⁻² |
0.77 × 10⁻² |
0.76 × 10⁻² |
−2.13 × 10⁻² |
|
| 6.65 (F2) |
5.58 × 10⁻² |
1.53 × 10⁻² |
−1.37 × 10⁻² |
|
|
| 9.15 (F3) |
7.11 × 10⁻² |
0.16 × 10⁻² |
|
|
|
| 11.65 (F4) |
7.27 × 10⁻² |
|
|
|
|
Fig. 5 shows the curve graph of the cross-section area formula A4(F) at different applied loads F. As is obvious in Fig. 5, the cross-section area A exhibited an upward tendency with an increase in the applied load from 1.65–11.65 N.
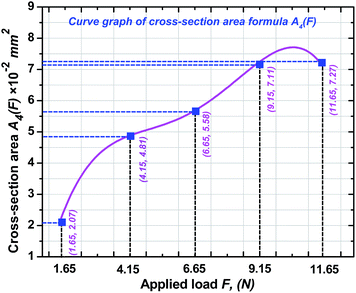 |
| | Fig. 5 Curve graph of the cross-section area formula A4(F) at different applied loads F. | |
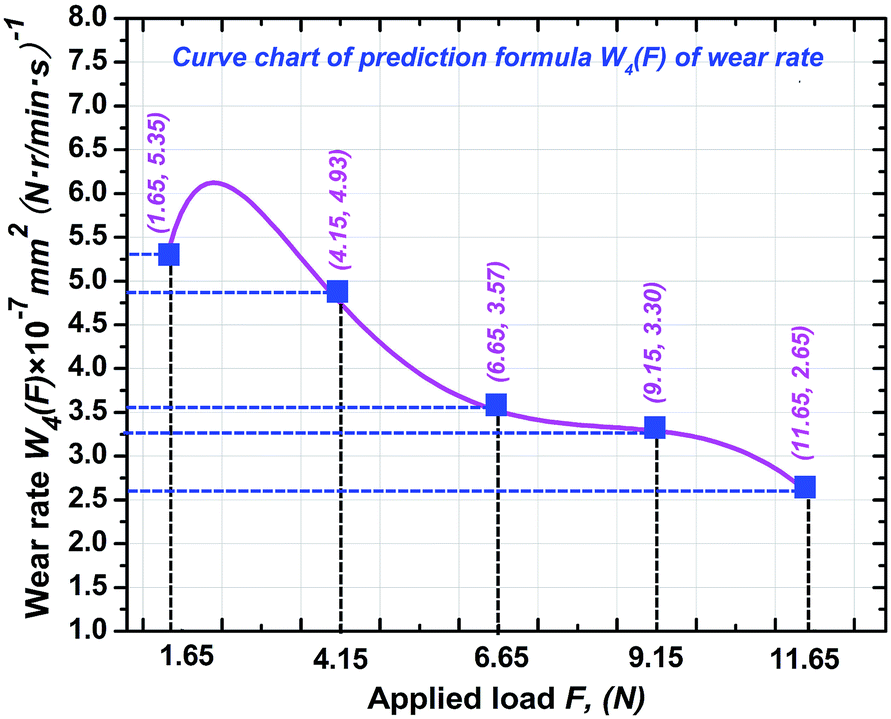
In the applied load district [1.65 N, 11.65 N], the prediction formula W4(F) of wear rate was defined as formula (19) by substituting the cross-section area formula A4(F) (see formula (18)) into formula (7):
| |
 | (19) |
Fig. 6 shows the curve chart of the prediction formula W4(F) of wear rate at different applied loads F. It can be seen in Fig. 6 that the wear rate continuously decrease with the increase of the applied load F. It may be concluded that the pressure stress was improved with the increase of the applied load F. Bulk wear debris was crushed into many smaller wear debris pieces at higher pressure stress, resulting in the improvement of the contact areas of the wear debris, strengthening of the binding forces of the wear debris and lowering of the material loss of TiAl-10 wt% Ag. Consequently, TiAl-10 wt% Ag exhibited a smaller wear rate.
 |
| | Fig. 6 Curve chart of the prediction formula W4(F) of wear rate at different applied loads F. | |
3.5.2 Evaluating the prediction formula W4(F) of wear rate. Table 4 shows the comparative analysis between the testing error and computational error 2.90-392-3600 and 10.40-392-3600 (N-rpm-s). As shown in Table 4, the wear rate shows a downward tendency with the increase of applied load F. Simultaneously, the computational error was smaller than the testing error at the different applied loads F. Hence, in the district [1.65 N, 11.65 N], the formula W4(F) was accepted to predict wear rate with small computational errors.
Table 4 Comparative analysis between testing error and computational error at 2.90-392-3600 and 10.40-392-3600 (N-rpm-s)
| Test conditions |
2.90-392-3600 |
10.40-392-3600 |
| Wtest |
6.20 |
5.86 |
5.47 |
3.43 |
3.09 |
2.89 |
| Etest |
6.10% |
0.29% |
6.34% |
9.35% |
1.49% |
7.86% |
| Wcomp |
|
5.93 |
|
|
3.13 |
|
| Ecomp |
|
1.48% |
|
|
0.32% |
|
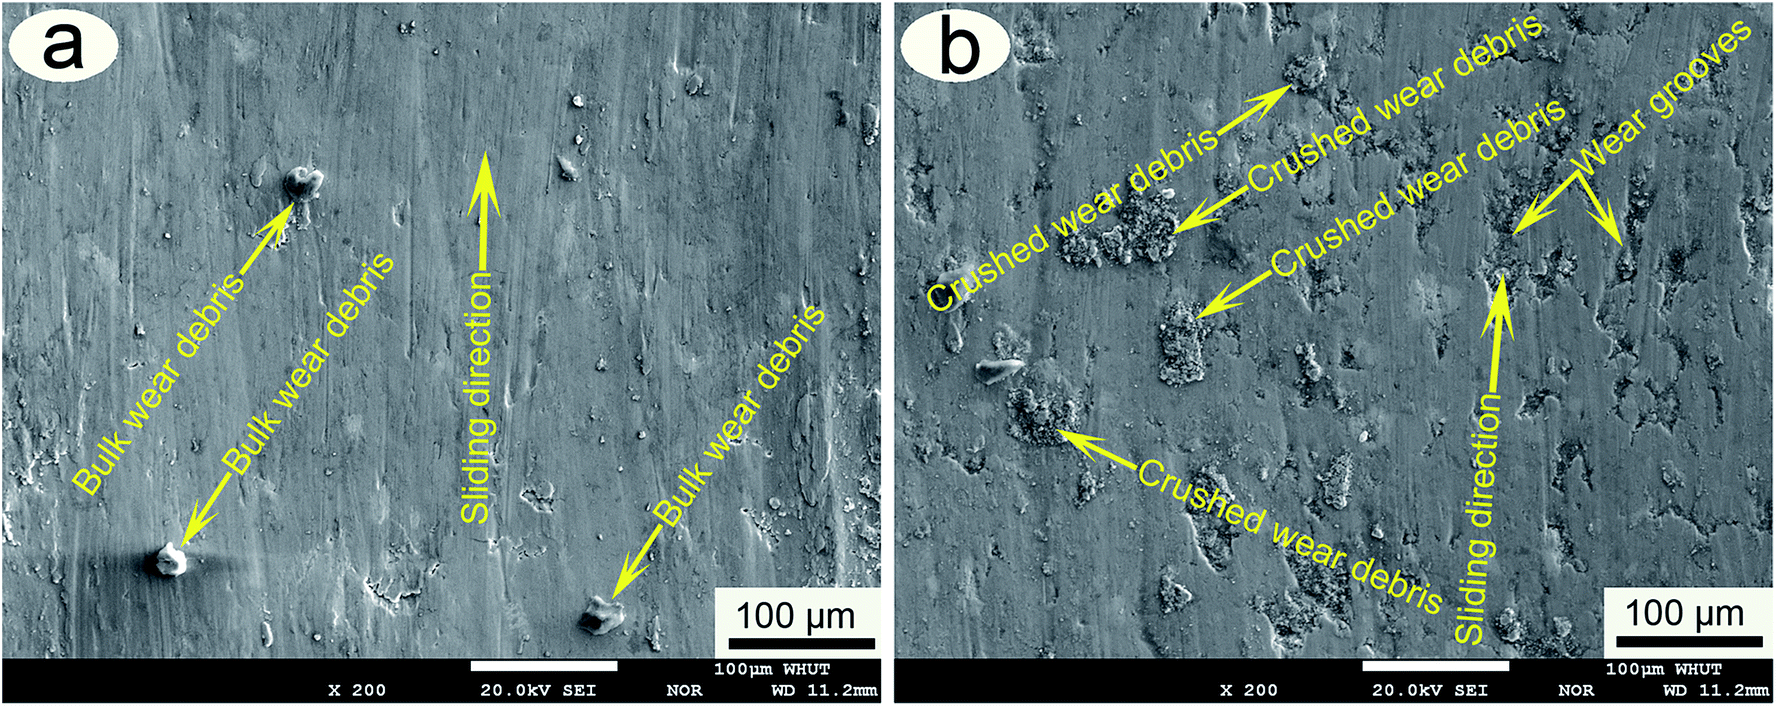
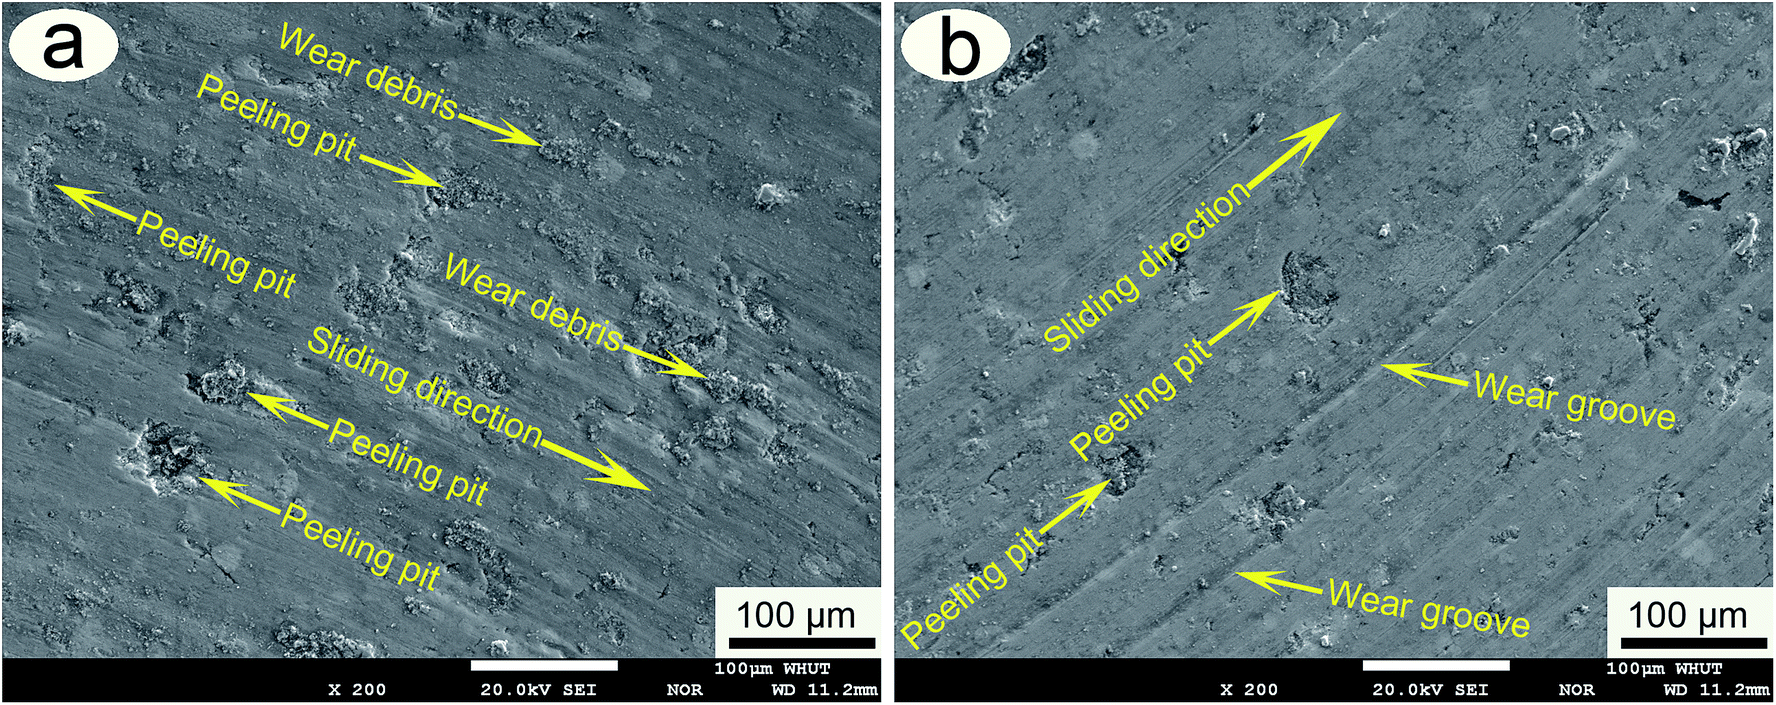
3.5.3 Influence of wear mechanisms on the prediction accuracy. Fig. 7 exhibits the typical electron probe morphologies of the wear scar after 80 min sliding at different applied loads F. As shown in Fig. 7a, the primary wear mechanism was abrasive wear at 2.90-392-3600 (N-rpm-s) for bulk wear debris on the smooth wear scar. As is clear in Fig. 7b, the small wear debris and discontinuous wear grooves appeared on the wear scar. It was apparent that the main wear mechanisms were abrasive wear and plough wear at 10.40-392-3600. The pressure stress was continually improved with the increase of the applied load F, resulting in cracking of the bulk wear debris into small wear debris pieces, improvement of the contact areas of the wear debris, strengthening of the binding forces of the wear debris, conversion of the wear mechanisms and lowering of the wear rate of TiAl-10 wt% Ag, as well as improvement of the prediction accuracy of the formula W4(F) (see formula (19)). Hence, the wear rate of TiAl-10 wt% Ag was smaller at higher applied loads F. Simultaneously, the smaller wear debris pieces were retained on the wear scar by the deep wear groove at 10.40-392-3600.
 |
| | Fig. 7 Typical electron probe morphologies of the wear scar after 80 min sliding at different applied loads F: 2.90-392-3600 (a), 10.40-392-3600 (b). | |
3.5.4 Influence of surface textures on the prediction accuracy. The excellent surface texture of the wear scar, which was determined by the height parameters of Sa, Sq and Sku, was beneficial to improvement of the contact area, lowering of the contact stress and acquiring a smooth wear scar. Mean surface roughness was measured by the arithmetical mean height (Sa). The standard deviation of the height distribution was evaluated by the root mean square height (Sq). The flatness of the height distribution could be examined by the kurtosis of the height distribution (Sku).Fig. 8 shows the representative surface texture of the wear scar at different applied loads F. A smoother wear scar was obtained for smaller Sa (0.398 μm), Sq (0.328 μm) and Sku (7.326) values at 10.40-392-3600 (N-rpm-s), if compared to that at 2.90-392-3600. It can be concluded that the wear debris was refined at the higher applied load of 10.40 N, resulting in the smoothing of the wear scar and improvement of the prediction accuracy (99.68%) of the formula W4(F).
 |
| | Fig. 8 Representative surface texture of the wear scar at different applied loads F: 2.90-392-3600 (a), 10.40-392-3600 (b). | |
As wear rates are mainly determined by the applied load F and rotation speed n, it was rather significant to study the wear rate at different rotation speeds n.
3.6 Rotation speed n
3.6.1 Constructing the prediction formula W4(n) of wear rate. The Newton interpolation method could be used to construct the cross-section area formula A4(n) (A4(n) between A and n) to obtain the prediction formula W4(n) of wear rate.Five interpolation nodes were chosen as (56, 1.02 × 10⁻²), (168, 3.39 × 10⁻²), (280, 6.91 × 10⁻²), (392, 7.11 × 10⁻²) and (504, 14.83 × 10⁻²). Table 5 shows the forward differences at different rotation speeds n. Hence, in the rotation speed district [56 rpm, 504 rpm], the cross-section area formula A4(n) was defined by the Newton interpolation method, as shown in formula (20):
| |
 | (20) |
Table 5 Forward differences at different rotation speeds n
| Rotate speed n |
A(n) |
ΔA(n) |
Δ2A(n) |
Δ3A(n) |
Δ4A(n) |
| 56 (n0) |
1.02 × 10⁻² |
2.37 × 10⁻² |
1.15 × 10⁻² |
−4.47 × 10⁻² |
15.31 × 10⁻² |
| 168 (n1) |
3.39 × 10⁻² |
3.52 × 10⁻² |
−3.32 × 10⁻² |
10.84 × 10⁻² |
|
| 280 (n2) |
6.91 × 10⁻² |
0.20 × 10⁻² |
7.52 × 10⁻² |
|
|
| 392 (n3) |
7.11 × 10⁻² |
7.72 × 10⁻² |
|
|
|
| 504 (n4) |
14.83 × 10⁻² |
|
|
|
|
Fig. 9 exhibits the curve graph of the formula A4(n) of the cross-section area of the wear scar at the different rotation speeds n. As shown in Fig. 9, the cross-section area A continuously increased with the increase of the rotation speed between 56–504 rpm.
 |
| | Fig. 9 Curve graph of the formula A4(n) of the cross-section area of the wear scar at different rotation speeds n. | |
In the district of [56 rpm, 504 rpm], the predicted formula W4(n) of wear rate was defined as formula (21) by substituting the cross-section area formula A4(n) (see formula (20)) into formula (7):
| |
 | (21) |
Fig. 10 shows the curve chart of the prediction formula W4(n) of wear rate at different rotation speeds n. As is clear in Fig. 10, the wear rate exhibits an upward tendency with an increase of rotation speed in the range of 56–280 rpm, a downward tendency in the region of 280–392 rpm and an ascending tendency in the district of 392–504 rpm. In the range of 56–280 rpm, the centrifugal force of the wear debris was continually improved with the increase of rotation speed n, leading to the removal of the wear debris from the wear scar and increase of the wear rate of TiAl-10 wt% Ag. When the rotation speed n was increased from 280 to 504 rpm, this resulted in the further improvement of the centrifugal force of the bulk wear debris, strengthening of the interaction forces between the bulk wear debris and small wear debris, as well as random removal of the small wear debris during the impacting process. Hence, the wear rate of TiAl-10 wt% Ag showed a fluctuating tendency with the increase of rotation speed n.
 |
| | Fig. 10 Curve chart of the prediction formula W4(n) of wear rate at different rotation speeds n. | |
3.6.2 Evaluating the prediction formula W4(n) of wear rate. Table 6 shows the comparative analysis between the testing error and computational error at 9.15-112-3600 and 9.15-448-3600 (N-rpm-s). As shown in Table 6, the testing error of the wear rate shows a larger fluctuation at 9.15-112-3600, if compared to that at 9.15-448-3600, leading to the improvement in the testing error with the increase of rotation speed n. A smaller computational error was obtained than the testing error at the different rotation speeds n. Hence, the prediction formula W4(n) of the wear rate was accepted to predict the wear rate in the district of [56 rpm, 504 rpm].
Table 6 Comparative analysis between the testing error and computational error at 9.15-112-3600 and 9.15-448-3600 (N-rpm-s)
| Test conditions |
9.15-112-3600 |
9.15-448-3600 |
| Wtest |
2.34 |
2.21 |
1.68 |
3.71 |
3.41 |
3.23 |
| Etest |
12.68% |
6.42% |
19.10% |
7.54% |
1.16% |
6.38% |
| Wcomp |
|
2.07 |
|
|
3.59 |
|
| Ecomp |
|
0.32% |
|
|
0.41% |
|
3.6.3 Influence of wear mechanisms on prediction accuracy. Fig. 11 shows the representative electron probe morphologies of the wear scar after 80 min sliding at different rotation speeds n. Massive wear debris uniformly existed on the smooth wear scar (see Fig. 11a). It was evident that the primary wear mechanism was abrasive wear at 9.15-112-3600 (N-rpm-s). As shown in Fig. 11b, a great deal of wear debris appeared on the edge of the wear scar. It was evident that the primary wear mechanism was abrasive wear at 9.15-448-3600 (N-rpm-s). The centrifugal force of the wear debris was continually improved with the increase of rotation speed n, resulting in the improvement of the centrifugal force of the bulk wear debris, strengthening of the interaction forces between the bulk wear debris and small wear debris, random removal of the small wear debris during the impacting process, acquiring of the wear mechanism of abrasive wear, fluctuation of the wear rate of TiAl-10 wt% Ag and lowering of the prediction accuracy (from 99.68% to 99.59%) of formula W4(n) (see formula (21)).
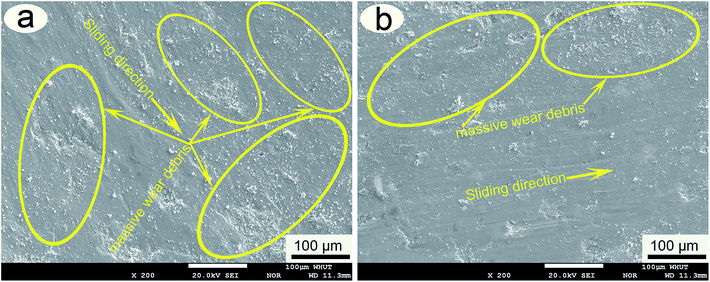 |
| | Fig. 11 Representative electron probe morphologies of the wear scar after 80 min sliding at different rotation speeds n: 9.15-112-3600 (a), 9.15-448-3600 (b). | |
3.6.4 Influence of surface textures on prediction accuracy. Fig. 12 shows the typical surface texture of the wear scar at different rotation speeds n. A smooth wear scar was obtained for the excellent height parameters of Sa (0.481 μm), Sq (0.368 μm) and Sku (7.263) at 9.15-448-3600 (N-rpm-s). The centrifugal force of the wear debris at 9.15-448-3600 was larger than at 9.15-112-3600, leading to the improvement of the removal of wear debris, strengthening of the smoothness of the wear scar, fluctuation of the wear rate of TiAl-10 wt% Ag and lowering of the prediction accuracy (from 99.68% to 99.59%) of formula W4(n).
 |
| | Fig. 12 Typical surface texture of the wear scar at different rotation speeds n: 9.15-112-3600 (a), 9.15-448-3600 (b). | |
In order to evaluate the longevity of the mechanical components, it was necessary to investigate the wear rates at different sliding times t.
3.7 Sliding time t
3.7.1 Constructing the prediction formula W4(t) of wear rate. Before constructing the prediction formula W4(t) of wear rate, the cross-section area formula A4(t) (A4(t) between A and t) was required to firstly be constructed by the Newton interpolation method.Five interpolation points of (900, 2.40 × 10⁻²), (1800, 4.90 × 10⁻²), (2700, 7.09 × 10⁻²), (3600, 7.11 × 10⁻²) and (4500, 6.24 × 10⁻²) were chosen to construct the cross-section area formula A4(t) using the Newton interpolation method. Table 7 shows the forward differences at different sliding times t. Hence, the forward differences were employed to construct the cross-section area formula A4(t), as shown in formula (22):
| |
 | (22) |
Table 7 Forward differences at different sliding times t
| Sliding time t |
A(t) |
ΔA(t) |
Δ2A(t) |
Δ3A(t) |
Δ4A(t) |
| 900 (t0) |
2.40 × 10⁻² |
2.50 × 10⁻² |
−0.31 × 10⁻² |
−1.86 × 10⁻² |
3.14 × 10⁻² |
| 1800 (t1) |
4.90 × 10⁻² |
2.19 × 10⁻² |
−2.17 × 10⁻² |
1.28 × 10⁻² |
|
| 2700 (t2) |
7.09 × 10⁻² |
0.02 × 10⁻² |
−0.89 × 10⁻² |
|
|
| 3600 (t3) |
7.11 × 10⁻² |
−0.87 × 10⁻² |
|
|
|
| 4500 (t4) |
6.24 × 10⁻² |
|
|
|
|
Fig. 13 shows the curve graph of the formula A4(t) of the cross-section area of the wear scar at different sliding times t. The cross-section area A exhibited an upward tendency, when the sliding time t continuously increased in the range of 900–4500 s.
 |
| | Fig. 13 Curve graph of the formula A4(t) of the cross-section area of wear scar at different sliding times t. | |
In the sliding time district [900 s, 4500 s], the predicted formula W4(t) of the wear rate was written as formula (23) by substituting the cross-section area formula A4(t) (see formula (22)) into formula (7):
| |
 | (23) |
Fig. 14 exhibits the curve chart of the prediction formula W4(t) of wear rate at different sliding times t. As shown in Fig. 14, the wear rate constantly decreased with the increase of sliding time t. Bulk wear debris was repeatedly crushed into a great deal of smaller wear debris pieces with the increase of sliding time t, resulting in incessant forming of anti-friction films and continuous lowering of the wear rate of TiAl-10 wt% Ag.
 |
| | Fig. 14 Curve chart of the prediction formula W4(t) of the wear rate at different sliding times t. | |
3.7.2 Evaluating the prediction formula W4(t) of wear rate. Table 8 shows the comparative analysis between the testing error and computational error at 9.15-392-1350 and 9.15-392-4050 (N-rpm-s). As shown in Table 8, when the sliding time t increased from 1350 to 4050 s, the testing error of the wear rate was lowered at 9.15-392-4050 compared to that at 9.15-392-1350. The computational error was smaller than the testing error at the different sliding times t. Hence, the prediction formula W4(t) of wear rate was accepted to predict the wear rate in the sliding time district [900 s, 4500 s].
Table 8 Comparative analysis between the testing error and computational error at 9.15-392-1350 and 9.15-392-4050 (N-rpm-s)
| Test conditions |
9.15-392-1350 |
9.15-392-4050 |
| Wtest |
4.51 |
4.11 |
3.89 |
2.80 |
2.67 |
2.50 |
| Etest |
8.15% |
1.44% |
6.71% |
5.40% |
0.50% |
5.90% |
| Wcomp |
|
4.27 |
|
|
2.72 |
|
| Ecomp |
|
2.40% |
|
|
2.38% |
|
3.7.3 Influence of wear mechanisms on the prediction accuracy. Fig. 15 shows the representative electron probe morphologies of the wear scar after 80 min sliding at different sliding times t. As is clear in Fig. 15a, massive shallow peeling pits and abrasive debris existed on the wear scar. It was apparent that the primary wear mechanisms were peeling and abrasive wear at 9.15-392-1350 (N-rpm-s). As shown in Fig. 15b, shallow peeling pits and discontinuous wear grooves appeared on the smooth wear scar at 9.15-392-4050 (N-rpm-s). It was obvious that the primary wear mechanisms were peeling and plough wear. Bulk wear debris was repeatedly crushed into massive smaller wear debris pieces with the increase of sliding time t, resulting in incessant forming of anti-friction films, slight conversion of wear mechanisms, continuous lowering of the wear rate of TiAl-10 wt% Ag, and stabilization of the prediction accuracy (from 97.60% to 97.62%) of the prediction formula W4(t) of wear rate (see formula (23)).
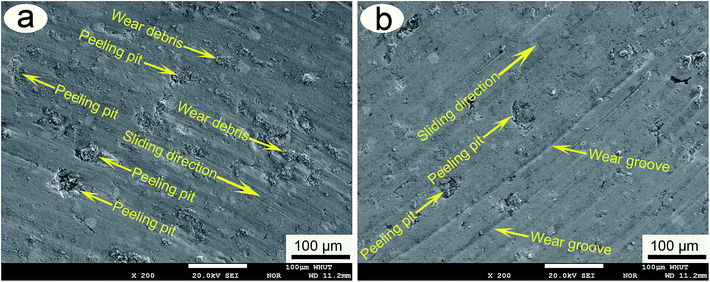 |
| | Fig. 15 Representative electron probe morphologies of the wear scar after 80 min sliding at different sliding times t: 9.15-392-1350 (a), 9.15-392-4050 (b). | |
3.7.4 Influence of surface textures on the prediction accuracy. Fig. 16 exhibits the typical surface texture of the wear scar at different sliding times t. When the sliding time t increased from 1350 to 4050 s, a smooth wear scar was obtained for the smaller height parameters of Sa (0.356 μm), Sq (0.291 μm) and Sku (6.241). Small wear debris was constantly formed in the reiterative crush with the increase of sliding time t, resulting in the formation of anti-friction films, lowering of the wear rate of TiAl-10 wt% Ag and stabilization of the prediction accuracy (from 97.60% to 97.62%) of the prediction formula W4(t).
 |
| | Fig. 16 Typical surface texture of the wear scar at different sliding times t: 9.15-392-1350 (a), 9.15-392-4050 (b). | |
In this study, in order to study the variation of wear rate at different applied loads F, rotation speeds n and sliding times t, prediction formulas W4(F), W4(n) and W4(t) of wear rate were constructed based on TiAl-10 wt% Ag. Five interpolation nodes were firstly chosen to respectively construct formulas A4(F), A4(n) and A4(t) (A4(F) between A and F, A4(n) between A and n, as well as A4(t) between A and t) using the Newton interpolation method. And then prediction formulas W4(F), W4(n) and W4(t) were obtained by substituting formulas A4(F) (see formula (18)), A4(n) (see formula (20)) and A4(t) (see formula (22)) into the wear rate formula W4 (see formula (7)). Prediction formulas W4(F), W4(n) and W4(t) of wear rate, which were evaluated by making a comparison between the computational error and testing error, could be accepted to predict wear rate with small computational errors. The prediction accuracies of formulas W4(F), W4(n) and W4(t) were respectively given the reasonable explanations by wear mechanisms and surface texture at different applied loads F, rotation speeds n and sliding times t. It was found that the prediction accuracy of the prediction formula of the wear rate gradually increased for the higher binding force of wear debris at larger applied loads F (see formula W4(F)), and slightly decreased for the random impacting between the bulk wear debris and small wear debris at the higher rotation speeds n (see formula W4(n)), as well as being relatively stabilized for the incessant forming of anti-friction films at the different sliding times t (see formula W4(t)).
4. Conclusions
Under pure Ar atmosphere protection, TiAl-10 wt% Ag was fabricated using SPS for 8 min at the temperature and pressure of 1000 °C and 30 MPa. The formulas W4(F), W4(n) and W4(t), which were constructed using the Newton interpolation method, were respectively employed to predict wear rate with the increase of applied load F, rotation speed n or sliding time t at room temperature. The conclusions were obtained as follows:
(1) Formulas W4(F), W4(n) and W4(t), which were constructed using the Newton interpolation method, could be employed to predict wear rate with small computational errors.
(2) In the applied load district [1.65 N, 11.65 N], the prediction accuracy of formula W4(F) gradually increased for the higher binding force of the wear debris at larger applied loads F.
(3) The prediction accuracy of formula W4(n) slightly decreased for the random impacting between bulk wear debris and small wear debris at higher rotation speeds n.
(4) In the sliding time district [900 s, 4500 s], the prediction accuracy of formula W4(t) was relatively stabilized for the incessant forming of anti-friction films.
(5) The prediction formulas W4(F), W4(n) and W4(t) in the form of the Newton interpolation polynomial can be respectively adopted to predict wear rate with the increase of applied load F, rotation speed n and sliding time t, in order to evaluate the longevity of mechanical components used in industrial fields.
Acknowledgements
This work was supported by the National Natural Science Foundation of China (51275370); the Self-determined and Innovative Research Funds of WUT (135204008); the Fundamental Research Funds for the Central Universities (2015-yb-008 and 2015-zy-051); the authors also wish to gratefully thank the Material Research and Testing Center of Wuhan University of Technology for their assistance.
References
- S. Y. Sung and Y. J. Kim, Intermetallics, 2007, 15, 468 CrossRef CAS PubMed.
- X. H. Wu, Intermetallics, 2006, 14, 1114 CrossRef CAS PubMed.
- C. M. Austin, Curr. Opin. Solid State Mater. Sci., 1999, 4, 239–242 CrossRef.
- F. H. Fores, C. Suryanarayana and D. Eliezer, J. Mater. Sci., 1992, 27, 5113 CrossRef.
- T. Sun, Q. D. Wang, L. Sun, G. H. Wu and Y. Na, Wear, 2010, 268, 693 CrossRef CAS PubMed.
- X. L. Shi, Z. S. Xu, M. Wang, W. Z. Zhai, J. Yao and S. Y. Song, Wear, 2013, 303(1–2), 486 CrossRef CAS PubMed.
- J. F. Archard, J. Appl. Phys., 1953, 24, 981 CrossRef PubMed.
- P. Kishore Sampathkumaran, S. Seetharamu, S. Vynatheya and A. Murali, Wear, 2000, 237, 20 CrossRef.
- Y. Y. Boneh, A. Sagy and Z. Reches, Earth Planet. Sci. Lett., 2013, 381, 127 CrossRef CAS PubMed.
- S. Kasolang, M. A. Ahmad, F. A. Ghazali and A. M. Azmi, Appl. Mech. Mater., 2011, 52, 464 CrossRef.
- K. Gong, H. L. Luo, D. Feng and C. H. Li, Wear, 2008, 265, 1751 CrossRef CAS PubMed.
- Q. Cui, J. Shu, Z. F. Wu and G. X. Jiang, Power Electronics, 2013, 47(7), 46, DOI:10.3969/j.issn.1000-100X.2013.07.016.
- ASTM E92-82, Standard test method for vickers hardness of metallic materials, ASTM International, 2003 Search PubMed.
- ASTM B962-08, Standard test methods for density of compacted or sintered powder metallurgy (PM) products using Archimedes’ principle, ASTM International, 2008 Search PubMed.
- ASTM G99-95, Standard test method for wear testing with a pin-on-disk apparatus, ASTM International, 1995 Search PubMed.
- C. X. Li, J. Xia and H. Dong, Wear, 2006, 261, 693 CrossRef CAS PubMed.
- J. H. Mathews, K. D. Fink and F. L. Huang, Numerical methods using MATLAB, Electronic Industry Press, 4th edn, 2009 Search PubMed.
|
| This journal is © The Royal Society of Chemistry 2015 |
Click here to see how this site uses Cookies. View our privacy policy here.