
Ternary dye adsorption onto MnO2 nanoparticle-loaded activated carbon: derivative spectrophotometry and modeling
Arash Asfarama,
Mehrorang Ghaedi*a,
Shaaker Hajatib and
Alireza Goudarzic
aChemistry Department, Yasouj University, Yasouj 75918-74831, Iran. E-mail: m_ghaedi@mail.yu.ac.ir; m_ghaedi@yahoo.com; Fax: +98 741 2223048; Tel: +98 741 2223048
bDepartment of Physics, Yasouj University, Yasouj 75918-74831, Iran
cDepartment of Polymer Engineering, Golestan University, Gorgan, 49188-88369, Iran
First published on 10th August 2015
Abstract
MnO2 nanoparticle-loaded activated carbon (MnO2-NP-AC) as an efficient, environmental friendly and cost-effective adsorbent was synthesized and characterized using different techniques such as FE-SEM, EDX, XRD, BET and FTIR. The rapid and simultaneous ultrasound-assisted adsorption of brilliant green (BG), crystal violet (CV) and methylene blue (MB) dyes with severe spectra overlap was investigated onto MnO2-NP-AC as a novel and efficient adsorbent. The dyes in their ternary mixtures were simultaneously determined using third order derivative spectrophotometry. Response surface methodology (RSM) was successfully applied to analyze and optimize the adsorption process. The optimal conditions for pH, adsorbent dosage, initial dye concentration and sonication time were obtained to be 7.0, 0.022 g, 6 mg L−1 and 4 min, respectively. The predicted and experimental data were found to be in good agreement. An artificial neural network (ANN) was applied for the accurate prediction of percentages of dye removal from their ternary solution by the MnO2-NP-AC adsorbent. The experimental equilibrium data were modeled by applying different isotherm models. The Langmuir model was found to be the most applicable for describing the experimental equilibrium data obtained under the optimal conditions. A small amount of MnO2-NP-AC adsorbent (0.005 g) was successfully used for the removal of dyes (RE > 90.0%) in a very short time (4.0 min) with high adsorption capacity in a single component system (206.20, 234.20 and 263.16 mg g−1 for BG, CV and MB, respectively). Kinetic studies showed the applicability of the second-order kinetic model.
1. Introduction
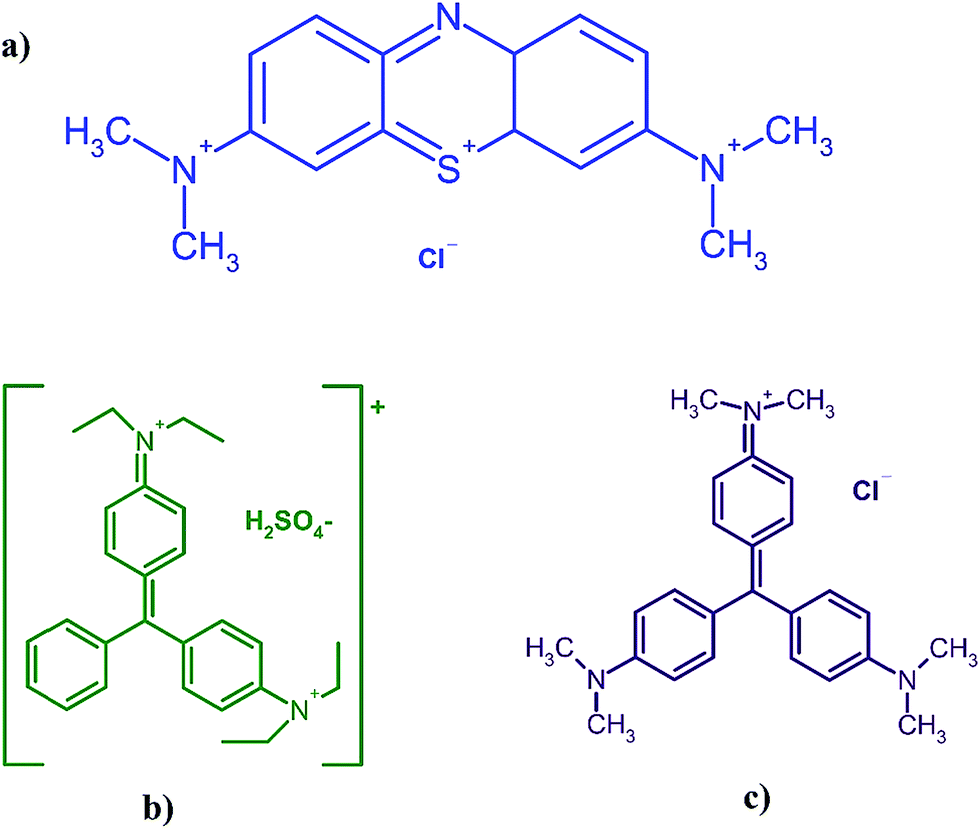
Because of the extensive use of dye stuffs in human life, their related industries have expanded rapidly.1 Many synthetic dyes are toxic and carcinogenic, which are not easily degraded to safe concentrations in the environment.2Methylene blue (MB) (Fig. 1a), as a thiazine cationic dye, is commonly used for coloring paper and hair3 as well as dyeing cotton, wood, and silk.4 Although MB is not highly hazardous, it can cause some harmful effects in humans such as increased heart rate, shock, vomiting, jaundice, cyanosis, quadriplegia, and tissue necrosis.4
 | ||
| Fig. 1 Chemical structure of (a) MB, (b) BG and (c) CV. | ||
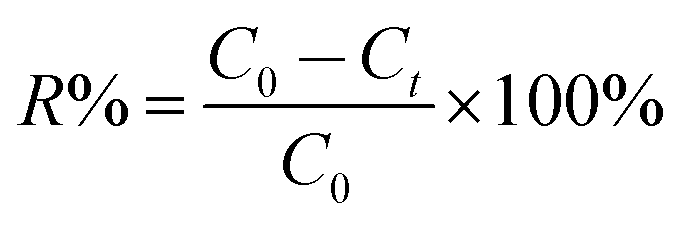
Brilliant green (BG) (Fig. 1b) is one of the most important dyes within the category of dye stuffs, which has been extensively used for dyeing silk, wool, leather, jute, and cotton, as well as in biological stain, dermatological agent, veterinary medicine, green ink manufacture, intestinal parasites, fungus textile dyeing and paper printing. Therefore, wastewater from these industries is highly colored and causes water pollution, which should be treated before its disposal.5
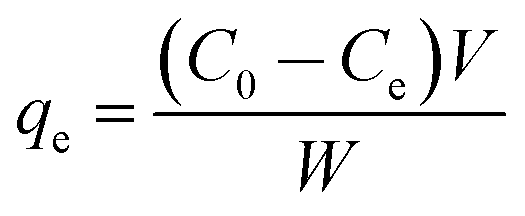
As a typical cationic dye, crystal violet (CV) (Fig. 1c) belongs to the triphenylmethane group, which is widely applied in coloring paper, temporary hair colorant, and dyeing cottons and wools. CV may harm the body via inhalation, ingestion and skin contact. It has also been found to cause cancer and severe eye irritation to human beings.6,7 Therefore, it is very essential to remove BG, CV and MB from industrial effluents.
Various techniques, such as adsorption and biosorption,8–13 membrane processes,4 coagulation,14 flocculation,15 photo decomposition,16 and electrochemical oxidation,17 have been used for the removal of dyes from wastewater. Among these techniques, adsorption has been proven to be the most potential technique due to its flexibility, simplicity of design, high efficiency and ability to separate wide range of chemical compounds.18
Nanoparticle-based adsorbents with distinguished properties, including a high number of vacant reactive surface sites, metallic or semi-metallic behavior and high surface area, have been applied for the removal of various toxic materials.19–21 MnO2-nanoparticles, as a unique adsorbent, benefit from their high specific surface area, which makes them suitable for pollutants removal.
For modeling the absorption process, response surface methodology (RSM) and artificial neural network (ANN), as the most popular methods, are employed.22–24 RSM and ANN are applied for systems wherein the mathematical relationship between the parameters and the responses is unknown. Both the tools are able to capture and represent the complex non-linear relationships between independent variables and responses of the system.
The main objectives of the present study include the following:
(1) The synthesis of MnO2 nanoparticle-loaded activated carbon (MnO2-NP-AC) and its characterization using FESEM, EDX, XRD, BET and FTIR.
(2) The determination of dye concentrations by derivative spectrophotometry in a ternary system.
(3) The design and optimization of experiments using RSM as a statistical approach to maximize the efficiency of dye adsorption.
(4) Ultrasound-assisted adsorption as a simple, inexpensive, rapid and sensitive method followed by derivative spectrophotometry applied for the simultaneous removal of CV, BG and MB.
(5) The evaluation of suitable isotherm and kinetic models describing the adsorption process.
(6) The application of the ANN model for inspection of the non-linear relationships between variables.
2. Experimental
2.1. Instruments and reagents
Fig. 1 shows the chemical structure of CV (C25N3H30Cl), BG (C27H34N2O4S) and MB (C16H18N3SCl) dyes. The maximum absorbance of CV, BG and MB occurs at wavelengths of 584, 624 and 664 nm, respectively. Stock solutions (100 mg L−1) were prepared by dissolving 10 mg of each dye in 100 mL of double distilled water. The test solutions (5–40 mg L−1) were prepared daily by diluting their stock solutions with distilled water. All applied chemicals (analytical reagent grade) were supplied from Merck, Darmstadt, Germany.Manganese sulfate dehydrate (MnSO4·2H2O), purchased from Merck Company, was used as the manganese ion source without further purification. Ammonia solution (25% w/w) was provided from Chem. lab company and used as received without further purification.
Distilled water was used in all the experiments. The absorbance spectra were obtained using a Jasco UV-vis spectrophotometer model V-530. A HERMLE Labortechnik GmbH centrifuge model Z206A (Germany) was used to accelerate the phase separation. A metrohm digital pH-meter model 686 (Switzerland) with a combined Ag/AgCl glass electrode was used for pH adjustments. The elemental composition of MnO2-NP-AC was analyzed using an energy-dispersive X-ray spectrometer (EDX) equipped with an Oxford INCA II energy solid-state detector. X-ray diffraction (XRD, Philips PW 1800) was performed to characterize the phase and structure of the prepared nanoparticles using Cukα radiation (40 kV and 40 mA) at angles ranging from 10° to 80°. The morphology of the nanoparticles was observed using field emission scanning electron microscopy (FESEM: ZEISS) under an acceleration voltage of 15 kV. To investigate the purity as well as the presence of organic and/or other compounds in the nanoparticles, Fourier transform infrared (FT-IR) spectra were obtained using a Perkin-Elmer-Spectrum RX-IFTIR spectrometer in the range of 300–4000 cm−1. An ultrasonic bath equipped with a heating system (Tecno-GAZ SPA Ultra Sonic System) at a frequency of 40 kHz and power of 130 W was used for the ultrasound-assisted adsorption procedure. A BET surface analyzer (PHS-1020, PHSCHINA) was used to measure the nitrogen adsorption–desorption isotherm at 77 K; while before the measurement, the samples were degassed using nitrogen gas at 553 K for 3 h. The BET surface area was obtained from the adsorption isotherms. STATISTICA software version 10.0 (Stat Soft Inc., Tulsa, USA) was used for designing the experiments and their subsequent statistical analysis.
2.2. Derivative spectrophotometric method
The standard solutions of ternary mixtures were prepared from their individual stock solutions (100 mg L−1). The pH of the ternary mixtures was adjusted using HCl and NaOH solutions. The zero order spectra were obtained between 350 and 750 nm with a Δλ and scan speed of 1 nm and 1920 nm min−1, respectively. Before each differentiation step, a Savitzky–Golay smoothing procedure25 was applied to improve the signal-to-noise and thus obtain a more reliable quantification using the derivative spectra. The λ values from the third order derivative spectra for the determination of the individual dyes were selected from the zero-crossing technique.2.3. Preparation of MnO2-NPs loaded on AC
The reaction solution for the fabrication of MnO2-NP-AC was prepared as follows: first, 12.5 g of activated carbon (AC) was mixed with 200 mL of 0.0125 mol L−1 manganese sulfate solution as a deposition suspension solution in an Erlenmeyer flask. Then, 10 mL of a fresh ammonia solution (25% w/w), diluted by adding 50 mL of distilled water, was added dropwise to the deposition solution under vigorous stirring for 5 minutes at a temperature of 30 °C. After adding the diluted ammonia solution to the deposition solution, the mixed solution was stirred vigorously for 21 h at room temperature to homogenously deposit the MnO2-NPs on activated carbon. In the next step, the suspension solution of MnO2-NP-AC was heated at 65 °C for 1 h. Then, it was filtered and washed several times with distilled water followed by drying at 60 °C for 3 h. Finally, it was characterized and used as an efficient absorbent for the simultaneous adsorption of CV, BG and MB.2.4. Ultrasound-assisted adsorption
The simultaneous adsorption of CV, BG and MB was accelerated using ultrasound with a ultrasonic bath filled with 2.5 L of water (the sonication medium) at 25 °C during the experiment. The sonochemical adsorption experiment was carried out as follows: 50 mL of the dyes solution at a known concentration (initial concentration of 6 mg L−1 for each dye) and a known amount of MnO2-NP-AC (0.022 g) were loaded into the flask and maintained for the desired sonication time (4 min) at pH 7.0 and at room temperature. Finally, the sample was immediately centrifuged and the solutions were analyzed for the final concentration of CV, BG and MB via the derivative spectrophotometry method at 550, 440 and 710 nm, respectively. The amount of each dye was analyzed via the corresponding calibration curve at the mentioned wavelength. In the ternary solutions, the third order derivative of the absorbance spectra was used to find the optimal wavelength for each dye, at which the impact of the other component was minimized. The optimal wavelengths were found to be 550, 440 and 710 nm for CV, BG and MB, respectively.2.5. Measurements of dye uptake
The dye concentrations were determined according to calibration plots. The CV, BG and MB removal percentages (R%) were calculated using the following equation:
 | (1) |
 | (2) |
The kinetic studies were performed in a series of flasks containing 0.010 g of MnO2-NP-AC and 50 mL of each dye at concentrations of 10, 20 and 30 mg L−1 at room temperature. After fixed time intervals (1–5 min), the adsorbent was separated and the concentration of each dye remaining in the supernatant solution was determined using UV-visible spectrophotometry at its λmax. The isotherm parameters were also obtained in the initial dye concentrations range of 5–30 mg L−1 in 50 mL of each solution mixed with 0.005, 0.010, 0.015 and 0.022 g of MnO2-NP-AC at pH 7.0 for 4.0 min of sonication time.
To quantitatively compare the applicability of each model, an error function is required. As a result, the chi-square (χ2) test and the co-efficient of determination (R2) were employed as criteria to obtain the best isotherm and kinetic models for describing the experimental equilibrium data in non-linear regression analysis.26
The following non-linear chi-square test (χ2)27 was carried out on the best-fitted isotherm:
 | (3) |
2.6. Experimental design
Response surface methodology (RSM), which results from the combination of both mathematical and statistical methods, is advantageous to be used for the demonstration and optimization of the influences of a number of independent variables on the response.28 RSM is very useful to reduce the number of experiments to be conducted, in order to produce adequate information, which is statistically acceptable as a result.29,30 RSM usually contains three steps: (1) design and experiments, (2) response surface modeling through regression and (3) optimization.31 The most popular design of experiment applied in the RSM technique is central composite design (CCD). CCD has the following three sets of experimental runs: (1) fractional factorial runs in which factors are studied at the +1, −1 levels, (2) center points and (3) axial points, which make the design rotatable.31The center points were used to determine the experimental error and the reproducibility of the data. The axial points were located at (±α, 0, 0), (0, ±α, 0) and (0, 0, ±α), where α is the distance of the axial point from the center. In this study, α value was fixed at 2.8284.32
Based on this method, a six-factor design was considered for the removal of dyes. These factors include pH (X1), adsorbent dosage (X2), sonication time (X3), MB concentration (X4), BG concentration (X5) and CV concentration (X6) in five coded levels (−2.8284, −1, 0, +1 and +2.8284). The most common model that is used to describe the relationship between vital input factors and measurable output is the quadratic regression model, which can be expressed as follows:33
 | (4) |
2.7. Definition of the ANN modeling
An artificial neural network (ANN) is a good representation of the human brain and nervous systems that are known for their extreme ability to learn and classify data.34 A three layer feed-forward ANN was established for our modeling purpose. The network contains an input layer, a hidden layer and an output layer. Each layer consists of a series of neurons (Fig. 2). Neurons transfer input values to the next layer and the strength of these connections is determined by weight.35 In the present study, different back-propagation (BP) algorithms were checked to select the best BP algorithm with a minimum mean squared error (MSE) and minimum relative error (MRE). The Levenberg–Marquardt back propagation algorithm (LMA) was applied for training the network as the best algorithm. Moreover, a three-layer feed forward ANN with a linear transfer function (purelin) at the output layer and with a tangent sigmoid transfer function (tansig) at the hidden layer was developed to predict and simulate MnO2-NP-AC adsorption capacity for dye removal. For the ternary solution, all experimental data (90 runs) were divided randomly into three groups (70% for training, 15% for cross validation and 15% for testing the accuracy of model and prediction). The criteria, such as absolute average deviation (AAD), mean squared error (RMS), mean absolute error (MAE) and the correlation co-efficient (R2), were applied to evaluate the performance of the ANN model. The training parameters were 6 input nodes, 15 hidden layer neurons, 3 output node and error goal of 0.0002. Sensitivity analysis was carried out to compare the relative importance of each input variable. All the calculations involved were conducted using MATLAB.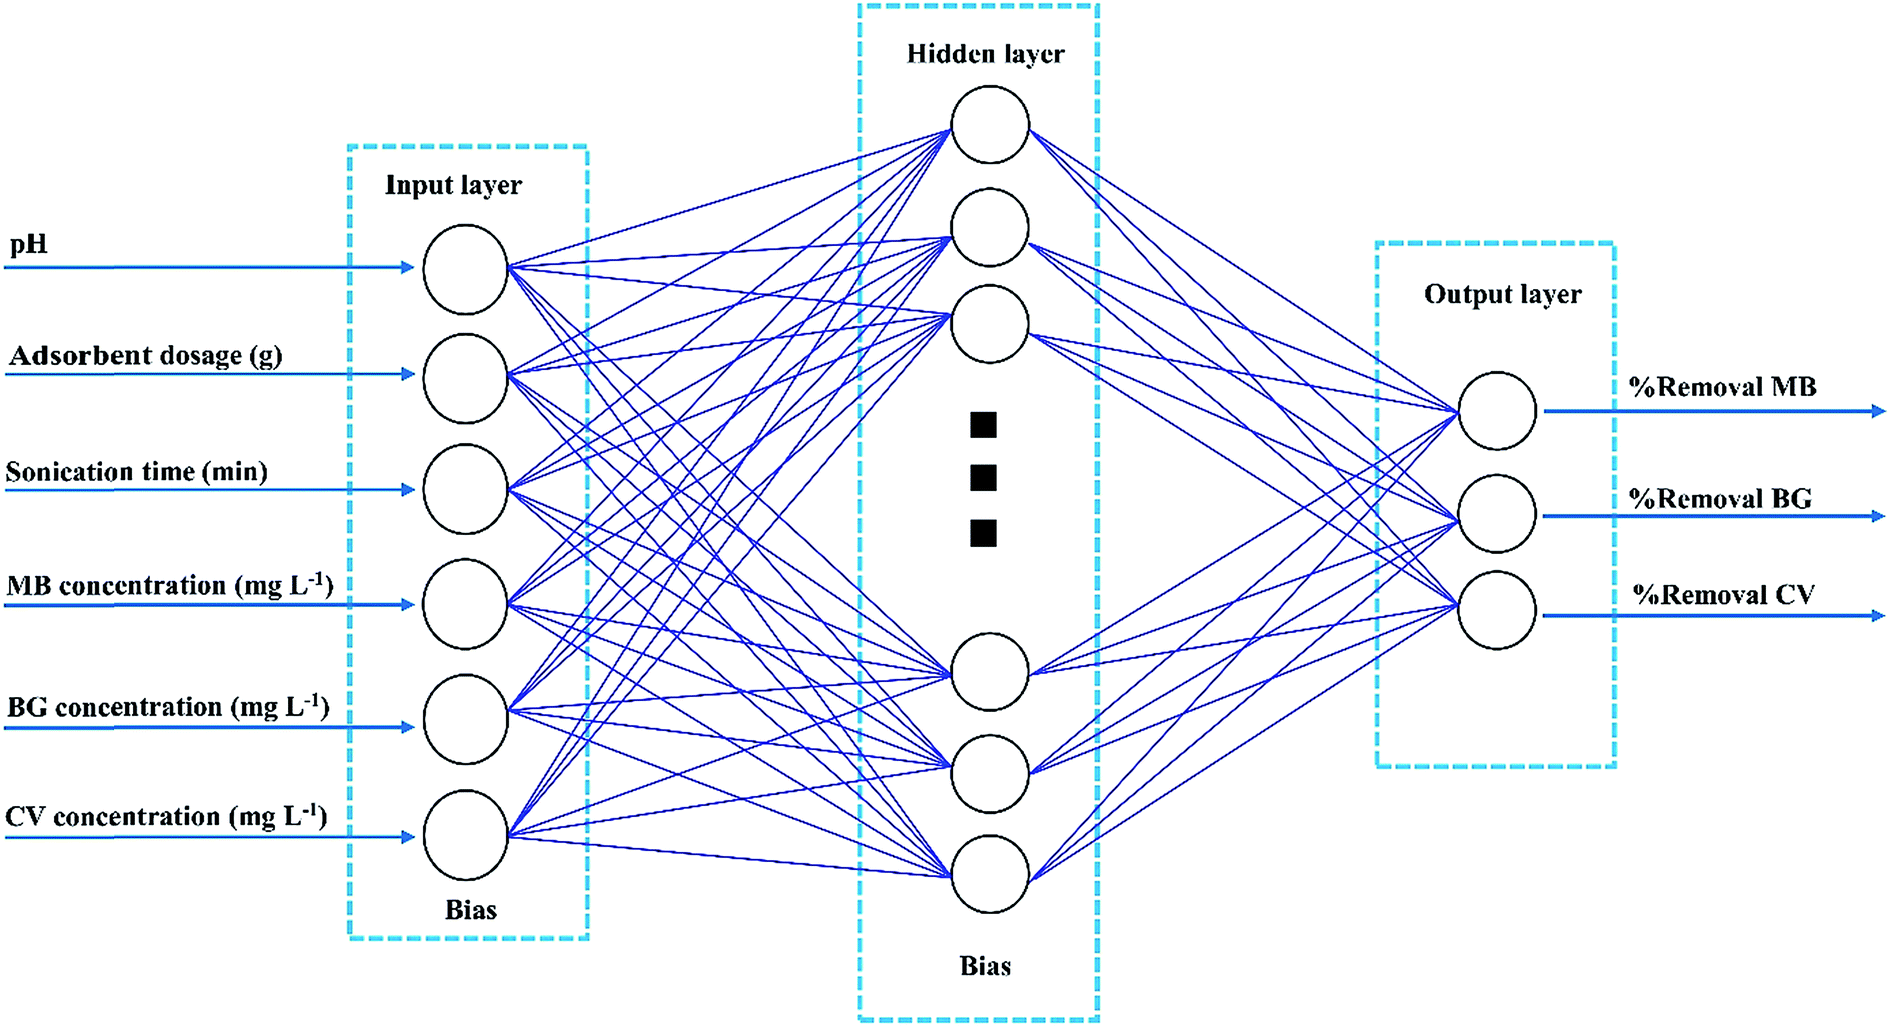 | ||
| Fig. 2 Schematic of the ANN structure and the basic principles of ANN. | ||
3. Results and discussion
3.1. Simultaneous analysis of CV, BG and MB in ternary mixtures
Fig. 3a shows the zero order spectra of CV, BG, MB and their ternary mixture. The maximum wavelengths (λmax) appear at 584, 624 and 644 nm for CV, BG, and MB, respectively. The individual spectra of these three dyes overlap severely, and therefore the determination of their accurate concentrations in the ternary mixture is not possible using conventional methods. To solve this overlap problem and determine the dyes simultaneously, the third order derivatives of the spectra were obtained, as shown in Fig. 3b and c. The third order derivative spectra show that CV can be determined at 550 nm, wherein the impacts of BG and MB are trivial. At 440 nm, BG can be determined, whereas the absorbance of CV and MB are equal to zero. At 710 nm, no trace of BG and CV is observed and thus the absorbance at this wavelength is attributed to MB. To test the mutual independence of the analytical signals for CV, BG and MB, calibration graphs were constructed for standard solutions containing various amounts of CV, BG and MB. The similarity observed between the regression equations of the individual dyes and their mixed solution suggests no interference in the estimation of one dye in the presence of another. The regression equations and co-efficients of determinations for the calibration graphs are given in Table 1. The derivative amplitudes measured at 550 nm for CV were found to be independent of the concentrations of BG and MB. Similarly, derivative amplitudes measured at 440 and 710 nm for BG and MB, respectively, were found to be independent of the concentration of CV. The validity of the proposed method was determined in several synthetic ternary mixtures containing CV, BG and MB.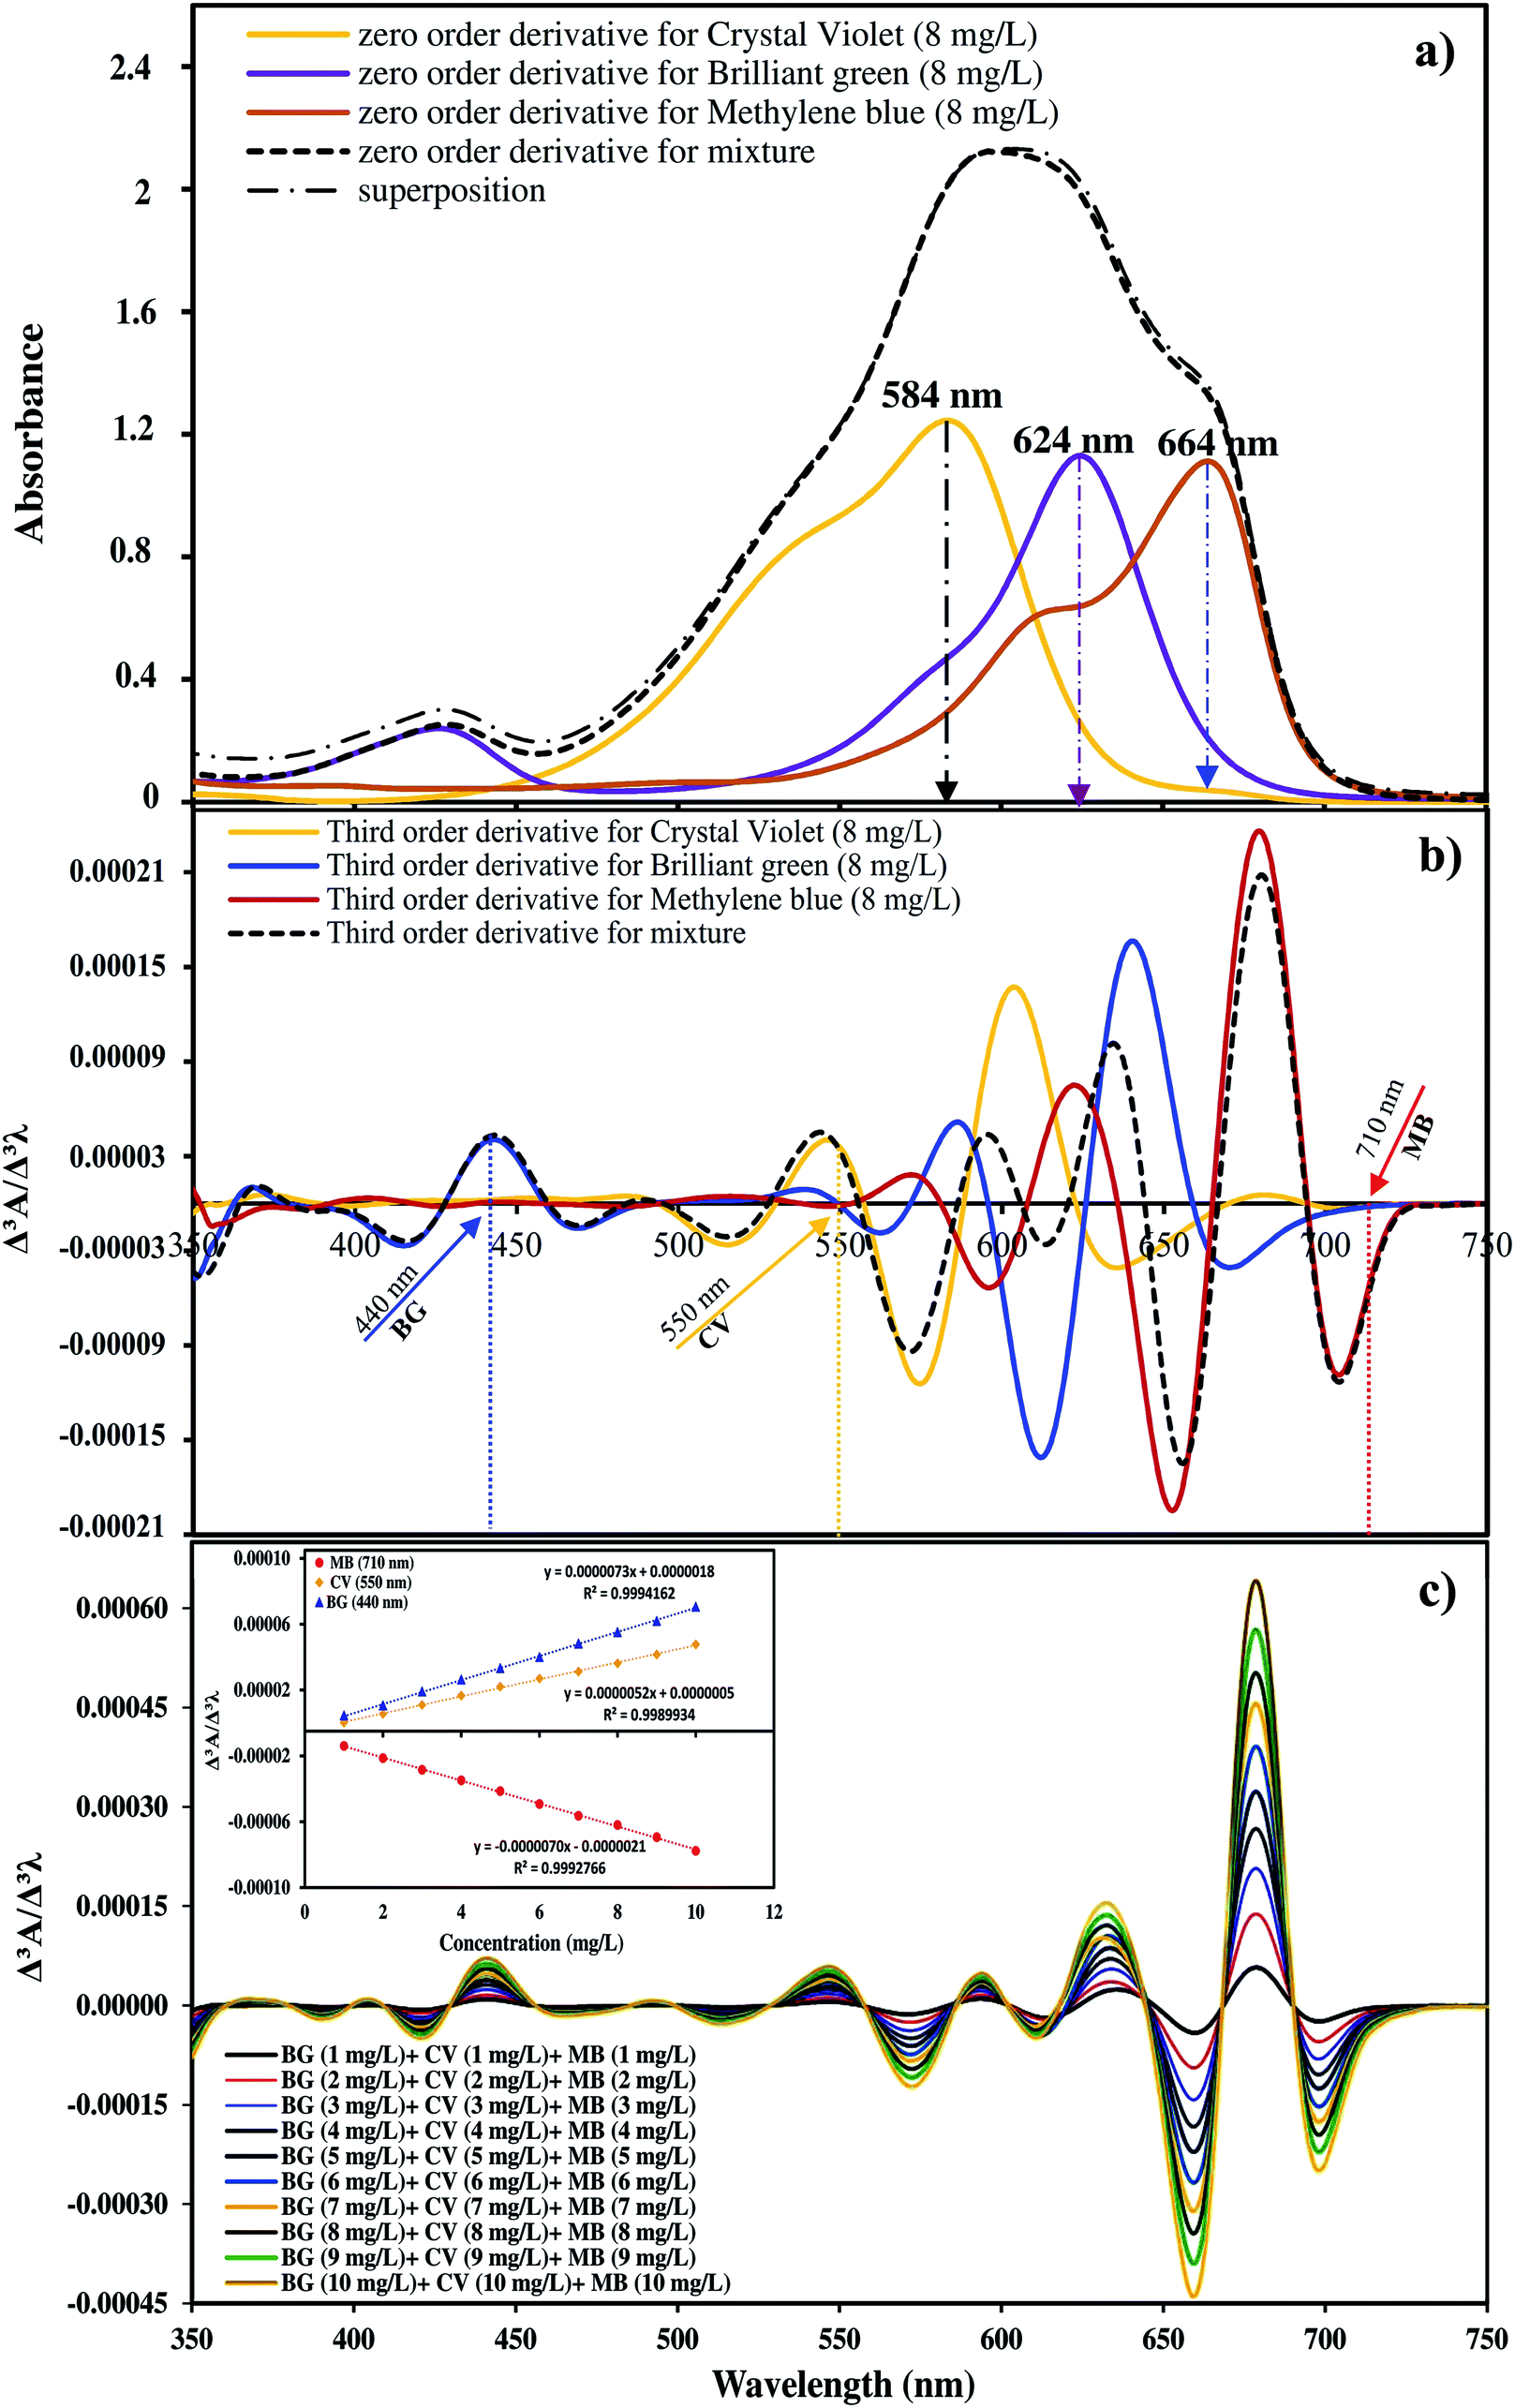 | ||
| Fig. 3 (a) Zero order absorption spectra of CV, BG and MB in single and ternary solutions (with an initial dye concentration of 8 mg L−1 for each dye). (b) Third order derivative spectra of CV, MG and MB in ternary solutions. (c) Calibration graph at 710 nm for MB, 550 nm for CV and 440 nm for BG. | ||
| Derivative | Dye | λ (nm) | Regression equation | R2 |
|---|---|---|---|---|
| First order derivative | BG | 392 | dΑ/dλ = 4.22084 × 10⁻⁴C + 2.15655 × 10⁻⁴ | 0.989313 |
| Second order derivative | MB | 710 | d2Α/d2λ = 5.6846 × 10⁻⁵C + 8.73000 × 10⁻⁸ | 0.996044 |
| Third order derivative | BG | 440 | d3Α/d3λ = 7.31540 × 10⁻⁶C + 1.78820 × 10⁻⁶ | 0.999416 |
| CV | 550 | d3Α/d3λ = 5.17230 × 10⁻⁶C + 5.00300 × 10⁻⁷ | 0.998993 | |
| MB | 710 | d3Α/d3λ = −6.96820 × 10⁻⁵C −2.13090 × 10⁻⁶ | 0.999277 | |
| Fourth order derivative | BG | 428 | d4Α/d4λ = 7.54900 × 10⁻⁵C + 5.16300 × 10⁻⁷ | 0.992576 |
| CV | 543 | d4Α/d4λ = 2.34400 × 10⁻⁷C + 3.74000 × 10⁻⁷ | 0.994429 | |
| MB | 714 | d4Α/d4λ = 6.18200 × 10⁻⁷C + 7.50000 × 10⁻⁷ | 0.998220 |
3.2. Characterization of the adsorbent
The size and morphology of MnO2-NP-AC were investigated using field emission scanning electron microscopy. The FE-SEM image shows the sheet-like morphology of MnO2-NP-AC with thickness of about 50–100 nm. Many spherical-like nanoparticles with diameters of about 20–50 nm were also observed (Fig. 4a).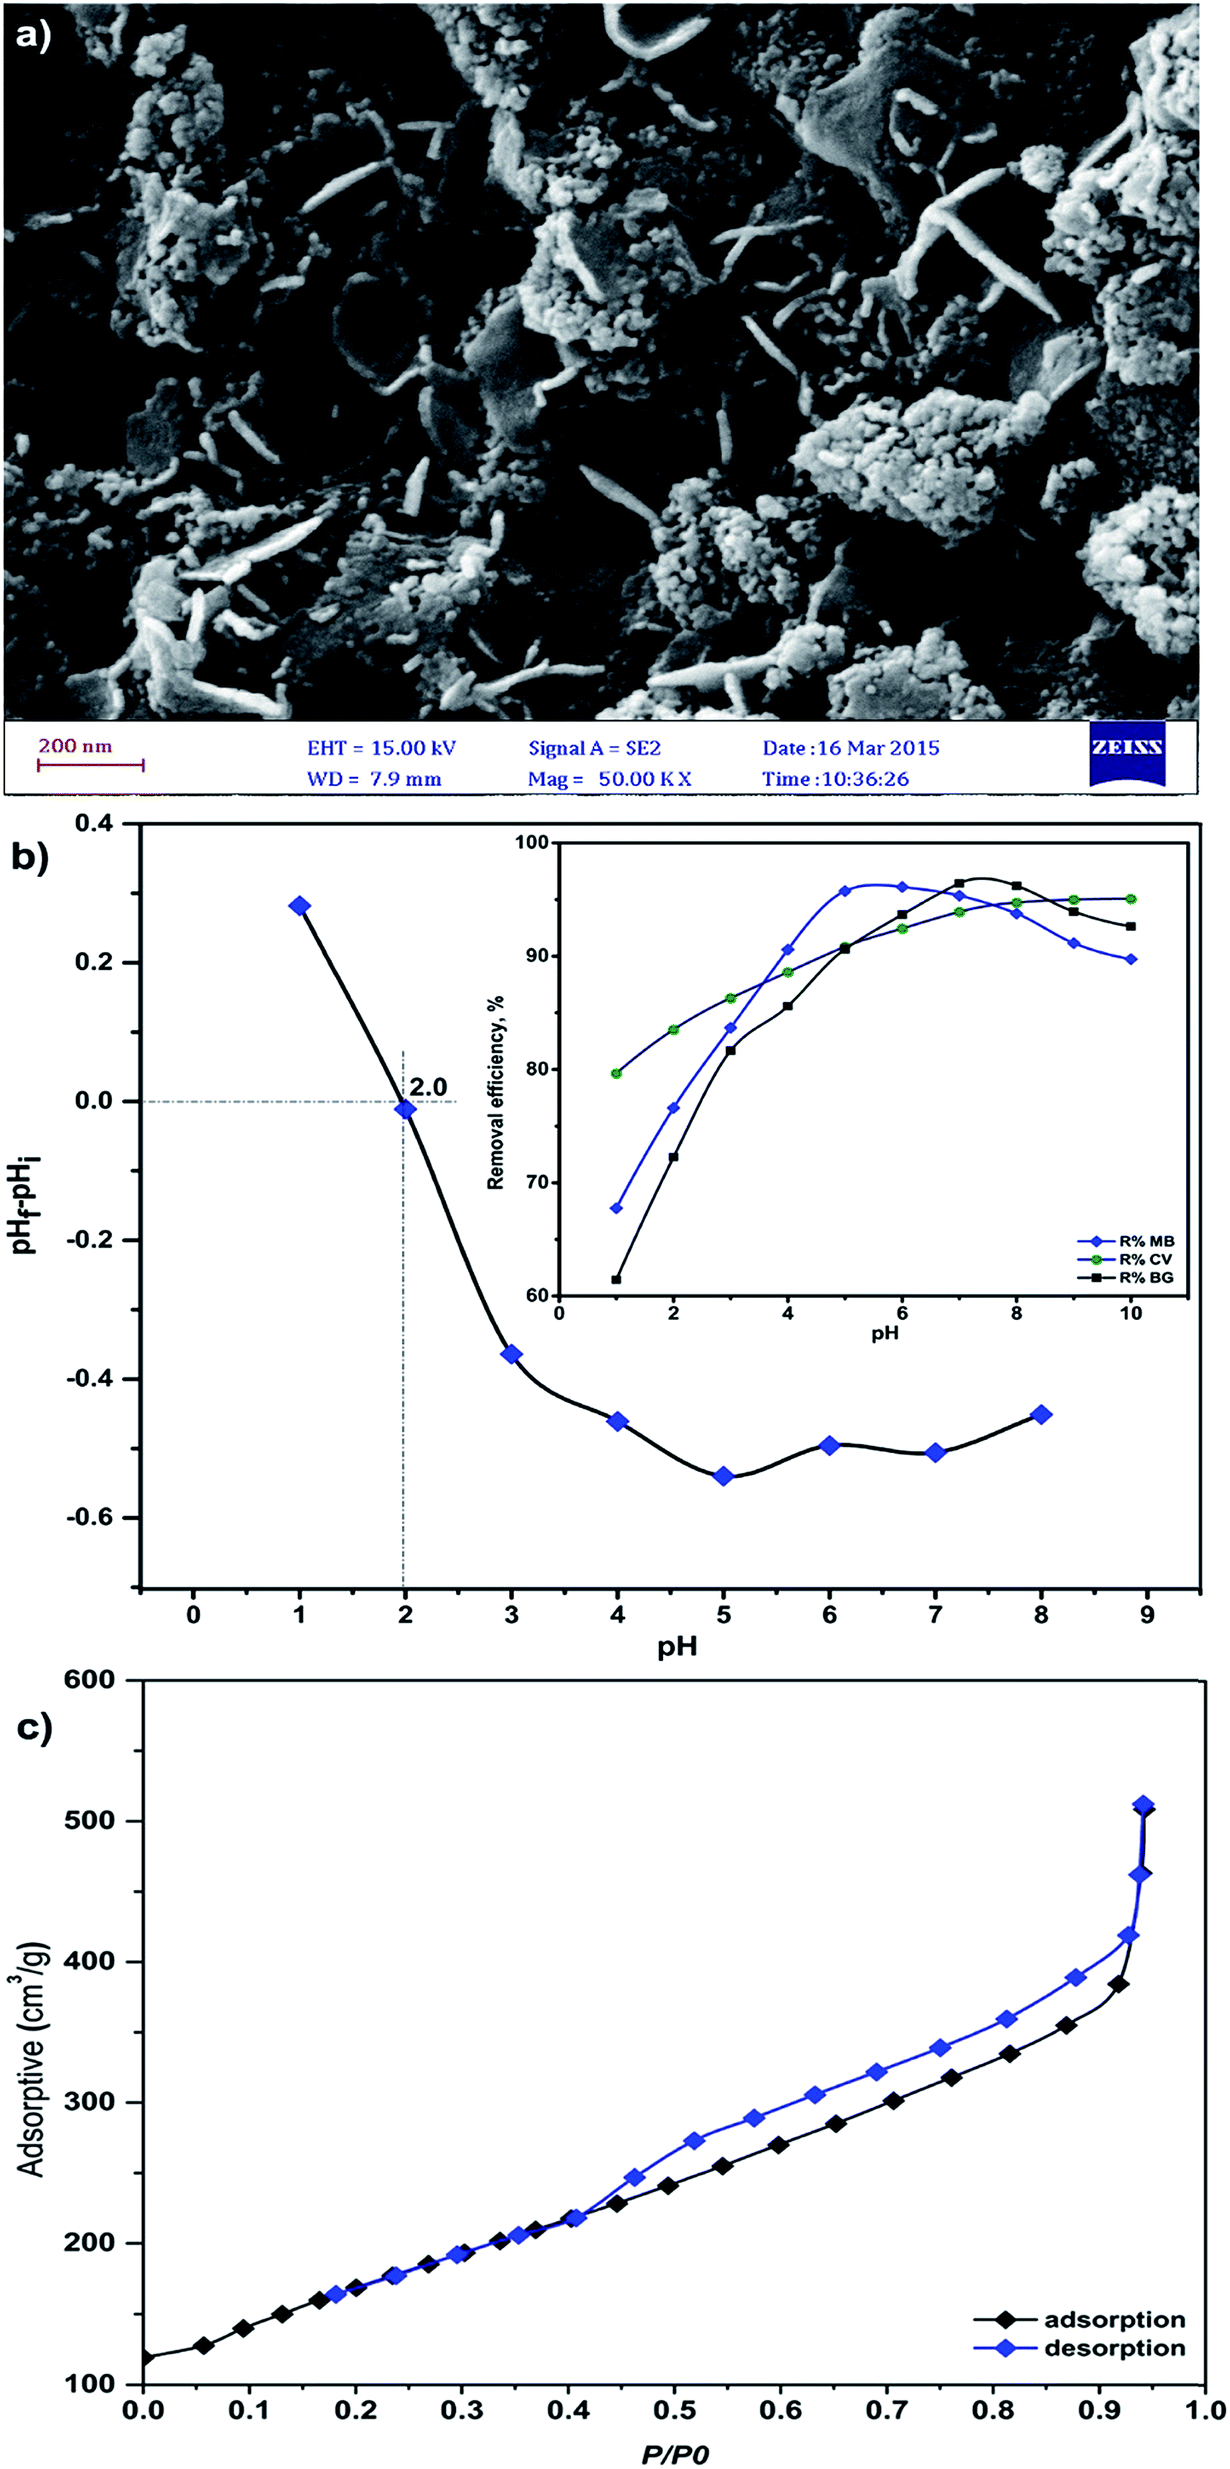 | ||
| Fig. 4 (a) FESEM image of the prepared MnO2-NP-AC, (b) pHzpc of MnO2-NP-AC (pHi = initial pH and pHf = final pH) and (c) nitrogen adsorption–desorption isotherms. | ||
The results for the determination of the pHZPC of MnO2-NP-AC are illustrated in Fig. 4b. The surface of MnO2-NP-AC is neutral when the pH of the aqueous solution is equal to the pHZPC (2.0).
At pH < 2.0, the adsorbent surface is positively charged, which may be due to the accumulation of H3O+ ions onto the adsorbent functional groups, e.g. hydroxyl group or donating nitrogen atoms. Thus, a repulsive force occurs between the cationic dyes and the adsorbent surface, which causes a decrease in the adsorption percentage. On the other hand, at pH > pHZPC, the adsorbent surface is negatively charged due to the deprotonation of its functional groups, which causes an increase in the adsorption percentage.
The BET surface area of MnO2-NP-AC was determined to be 612.03 m2 g−1. The adsorbent was found to be mesoporous with an average pore diameter of 2.52 nm. The adsorption–desorption isotherm was studied using nitrogen as the adsorptive gas (Fig. 4c). As seen, the isotherm is of type V, which is a characteristic of a mesoporous material.
The chemical composition of MnO2-NP-AC was studied using EDX analysis, from which the presence of Mn and O in the sample was confirmed (Fig. 5a). The Au peak is related to gold coated by sputtering process required for FE-SEM image acquisition. In the EDX analysis (Fig. 5a), C, O and Mn are the dominant elements throughout the surface of MnO2-NP-AC with weight percentages of 90.00%, 4.80%, and 5.10%, respectively. 61.87% oxygen is present in the sample, which originates from the MnO2 nanoparticles and 38.13% of which may be attributed to oxygen-containing functional groups present on the surface of activated carbon.
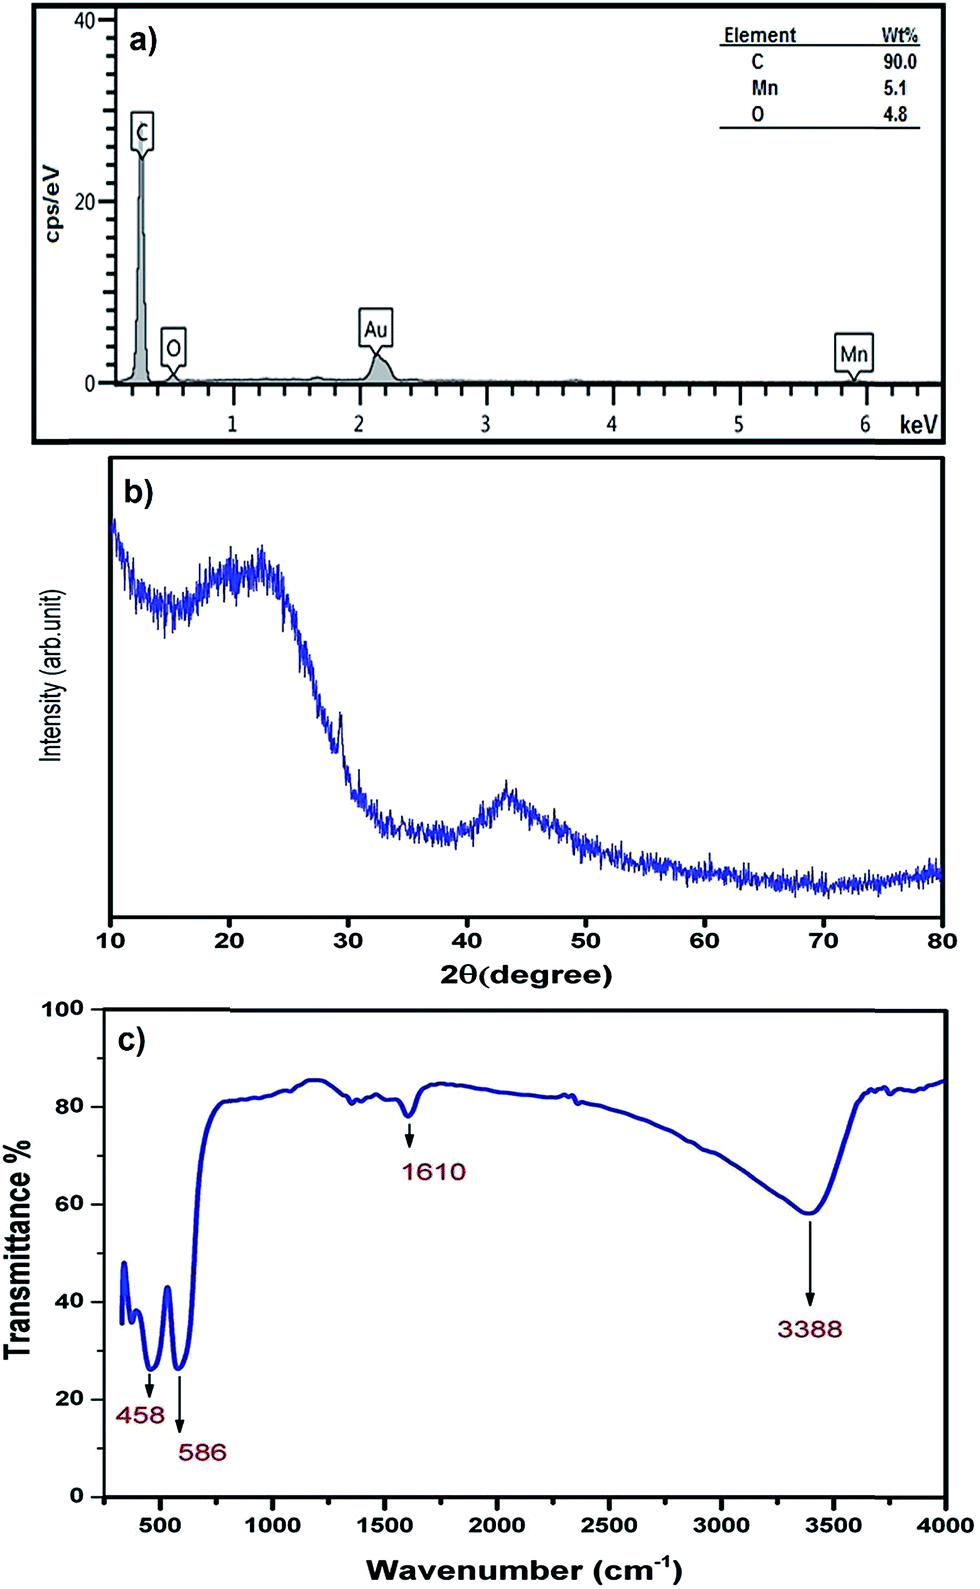 | ||
| Fig. 5 (a) EDX analysis, (b) XRD pattern and (c) FTIR spectrum of MnO2-NP-AC. | ||
Fig. 5b shows the XRD pattern of the MnO2-NP-AC particles. The observed broad hump at 2θ = 20°–25° as well as a broad peak at 2θ = 43° is related to the amorphous nature of activated carbon particles, on which the MnO2 nanoparticles were loaded. Therefore, according to the XRD pattern obtained, the prepared MnO2-NPs have an amorphous structure. Fig. 5c shows the FT-IR spectrum of the prepared MnO2 nanoparticles in the range of 300–4000 cm−1. FTIR spectroscopy was carried out to investigate the purity as well as the presence of organic and/or other compounds in the MnO2 nanoparticles. Hydroxides and oxides of metal nanoparticles usually display an absorption peak in the finger print region, i.e. below the wavelength of 1000 cm−1 arising from inter-atomic vibrations. A strong and sharp peak at 586 cm−1 in the spectrum is due to the Mn–O vibration modes in MnO2.36 Jaganyi et al.37 reported an absorption peak at 475 cm−1 corresponding to the characteristic stretching collision of O–Mn–O, and thus the peak observed at 458 cm−1 is attributed to the O–Mn–O bond. Broad absorption peaks centered at around 3381 cm−1 and 1610 cm−1 were attributed to absorbed water molecules and carbon dioxide because the nanocrystalline materials exhibit a high surface-to-volume ratio.38 Chu et al. reported an absorption peak for the Mn–OH functional group at 1109 cm−1, whereas in the FTIR spectrum of the MnO2 nanoparticles prepared in this study, no absorption peak related to the Mn–OH functional group was observed.
3.3. CCD results and fitted regression equations associated to the total surface area
CCD under RSM was employed to evaluate the interaction among the significant variables and also to determine their optimal values. CCD was developed to use the least number of experimental runs and increase the efficiency. CCD has been applied and considered to be a very efficient statistical experimental design tool in optimization.30The coded and real values of the factors are shown in Table 2. The experimental conditions for batch runs and the corresponding responses (removal percentages of the dyes) are shown in Table 3.
| Factors | Levels | α = 2.82843 | |||
|---|---|---|---|---|---|
| Low (−1) | Central (0) | High (+1) | −α | +α | |
| X1: pH | 6 | 7 | 8 | 4.171573 | 9.828427 |
| X2: adsorbent dosage (g) | 0.01 | 0.015 | 0.02 | 0.000858 | 0.029142 |
| X3: sonication time (min) | 3 | 4 | 5 | 1.171573 | 6.828427 |
| X4: MB concentration (mg L−1) | 4 | 6 | 8 | 0.343146 | 11.65675 |
| X5: BG concentration (mg L−1) | 4 | 6 | 8 | 0.343146 | 11.65675 |
| X6: CV concentration (mg L−1) | 4 | 6 | 8 | 0.343146 | 11.65675 |
| Run | X1 | X2 | X3 | X4 | X5 | X6 | %RMB | %RBG | %RCV |
|---|---|---|---|---|---|---|---|---|---|
| 1 | 0 | 0 | 0 | 0 | 0 | 0 | 96.8 | 97.3 | 93.2 |
| 2 | 0 | 0 | 0 | 0 | 0 | 0 | 95.8 | 95.3 | 94.0 |
| 3 | −1 | +1 | −1 | +1 | +1 | +1 | 97.5 | 100.0 | 84.1 |
| 4 | −1 | −1 | +1 | −1 | +1 | −1 | 88.8 | 87.6 | 95.5 |
| 5 | −1 | +1 | +1 | +1 | −1 | +1 | 95.2 | 95.1 | 92.5 |
| 6 | +1 | +1 | +1 | +1 | −1 | +1 | 95.6 | 95.5 | 100.2 |
| 7 | −1 | +1 | −1 | −1 | −1 | −1 | 98.1 | 90.9 | 95.6 |
| 8 | +α | 0 | 0 | 0 | 0 | 0 | 85.9 | 92.8 | 95.1 |
| 9 | +1 | −1 | −1 | +1 | +1 | −1 | 72.2 | 79.8 | 80.2 |
| 10 | +1 | +1 | +1 | −1 | +1 | −1 | 100.1 | 100.0 | 99.5 |
| 11 | −1 | +1 | −1 | +1 | −1 | −1 | 97.5 | 95.4 | 93.5 |
| 12 | +1 | −1 | −1 | −1 | +1 | −1 | 82.2 | 85.3 | 89.5 |
| 13 | 0 | 0 | 0 | 0 | 0 | +α | 91.5 | 90.8 | 82.1 |
| 14 | −1 | −1 | −1 | +1 | +1 | −1 | 80.2 | 80.1 | 82.9 |
| 15 | +1 | +1 | +1 | −1 | −1 | +1 | 94.2 | 97.8 | 97.4 |
| 16 | 0 | 0 | 0 | 0 | 0 | 0 | 95.7 | 96.0 | 92.3 |
| 17 | −1 | −1 | +1 | −1 | −1 | −1 | 87.7 | 86.5 | 89.7 |
| 18 | 0 | 0 | 0 | 0 | 0 | 0 | 96.5 | 94.8 | 95.0 |
| 19 | 0 | 0 | 0 | 0 | 0 | 0 | 95.8 | 95.4 | 93.8 |
| 20 | −1 | −1 | +1 | −1 | −1 | +1 | 83.9 | 80.0 | 81.2 |
| 21 | +1 | −1 | +1 | −1 | −1 | +1 | 83.1 | 89.0 | 85.0 |
| 22 | −1 | +1 | +1 | −1 | +1 | +1 | 98.7 | 94.2 | 93.5 |
| 23 | +1 | +1 | −1 | +1 | −1 | −1 | 97.1 | 89.5 | 97.2 |
| 24 | −1 | +1 | +1 | +1 | +1 | −1 | 97.6 | 99.9 | 93.3 |
| 25 | 0 | +α | 0 | 0 | 0 | 0 | 96.6 | 97.4 | 95.1 |
| 26 | 0 | 0 | 0 | 0 | 0 | 0 | 96.4 | 97.0 | 93.2 |
| 27 | −1 | +1 | −1 | −1 | +1 | +1 | 97.9 | 94.6 | 92.3 |
| 28 | 0 | 0 | 0 | 0 | 0 | 0 | 95.8 | 95.9 | 95.0 |
| 29 | +1 | −1 | +1 | +1 | +1 | −1 | 77.7 | 84.2 | 82.5 |
| 30 | +1 | −1 | +1 | +1 | −1 | −1 | 81.8 | 80.5 | 85.3 |
| 31 | −1 | −1 | +1 | +1 | −1 | −1 | 83.5 | 82.5 | 84.2 |
| 32 | 0 | 0 | 0 | 0 | 0 | 0 | 95.0 | 96.6 | 92.7 |
| 33 | 0 | 0 | 0 | 0 | 0 | 0 | 96.6 | 96.0 | 93.2 |
| 34 | +1 | −1 | −1 | −1 | −1 | +1 | 85.0 | 80.4 | 82.1 |
| 35 | −1 | +1 | −1 | +1 | −1 | +1 | 95.8 | 95.7 | 87.4 |
| 36 | 0 | 0 | 0 | 0 | 0 | −α | 94.5 | 91.5 | 97.4 |
| 37 | −1 | −1 | +1 | −1 | +1 | +1 | 88.8 | 82.1 | 84.5 |
| 38 | −1 | −1 | −1 | −1 | −1 | −1 | 90.5 | 76.0 | 88.9 |
| 39 | 0 | 0 | 0 | +α | 0 | 0 | 88.8 | 85.4 | 85.3 |
| 40 | +1 | −1 | +1 | −1 | +1 | +1 | 86.3 | 91.7 | 85.3 |
| 41 | 0 | 0 | 0 | 0 | +α | 0 | 94.5 | 96.8 | 92.3 |
| 42 | +1 | +1 | +1 | −1 | −1 | −1 | 99.5 | 98.9 | 98.8 |
| 43 | +1 | −1 | −1 | +1 | +1 | +1 | 74.5 | 84.7 | 74.5 |
| 44 | −1 | +1 | −1 | +1 | +1 | −1 | 95.6 | 100.0 | 90.9 |
| 45 | +1 | +1 | +1 | +1 | +1 | −1 | 97.4 | 97.3 | 95.5 |
| 46 | 0 | 0 | +α | 0 | 0 | 0 | 87.2 | 95.4 | 86.8 |
| 47 | +1 | −1 | +1 | +1 | −1 | +1 | 79.1 | 80.9 | 83.8 |
| 48 | 0 | 0 | 0 | 0 | 0 | 0 | 95.6 | 96.7 | 95.3 |
| 49 | −1 | +1 | +1 | +1 | −1 | −1 | 98.1 | 98.1 | 96.2 |
| 50 | +1 | +1 | −1 | −1 | +1 | +1 | 97.1 | 96.9 | 92.1 |
| 51 | −1 | −1 | −1 | +1 | −1 | +1 | 83.9 | 76.9 | 71.7 |
| 52 | +1 | +1 | +1 | +1 | −1 | −1 | 98.8 | 95.6 | 100.0 |
| 53 | −1 | +1 | +1 | +1 | +1 | +1 | 99.1 | 97.9 | 89.3 |
| 54 | +1 | −1 | −1 | +1 | −1 | +1 | 77.6 | 78.6 | 75.2 |
| 55 | −1 | −1 | +1 | +1 | +1 | +1 | 83.8 | 81.2 | 76.3 |
| 56 | −1 | −1 | −1 | +1 | +1 | +1 | 82.2 | 81.6 | 70.9 |
| 57 | +1 | +1 | −1 | −1 | −1 | −1 | 100.1 | 90.6 | 97.5 |
| 58 | +1 | +1 | +1 | +1 | +1 | +1 | 97.2 | 99.9 | 93.9 |
| 59 | 0 | 0 | 0 | 0 | 0 | 0 | 96.3 | 96.0 | 95.7 |
| 60 | +1 | +1 | −1 | −1 | −1 | +1 | 95.3 | 92.1 | 94.2 |
| 61 | −1 | −1 | −1 | −1 | +1 | −1 | 87.4 | 80.6 | 92.4 |
| 62 | −1 | −1 | −1 | +1 | −1 | −1 | 84.5 | 75.7 | 81.0 |
| 63 | +1 | +1 | −1 | +1 | +1 | −1 | 93.2 | 96.5 | 92.8 |
| 64 | +1 | −1 | −1 | +1 | −1 | −1 | 78.5 | 74.2 | 82.1 |
| 65 | +1 | −1 | +1 | +1 | +1 | +1 | 78.5 | 86.0 | 79.8 |
| 66 | −α | 0 | 0 | 0 | 0 | 0 | 91.5 | 86.8 | 90.6 |
| 67 | 0 | 0 | 0 | 0 | 0 | 0 | 96.0 | 97.5 | 93.3 |
| 68 | −1 | −1 | +1 | +1 | −1 | +1 | 82.4 | 78.8 | 77.8 |
| 69 | −1 | +1 | −1 | −1 | −1 | +1 | 94.4 | 88.1 | 88.4 |
| 70 | −1 | +1 | +1 | −1 | −1 | −1 | 96.6 | 97.0 | 96.5 |
| 71 | 0 | 0 | 0 | 0 | −α | 0 | 94.9 | 85.6 | 94.0 |
| 72 | +1 | +1 | +1 | −1 | +1 | +1 | 99.3 | 100.3 | 96.5 |
| 73 | −1 | +1 | +1 | −1 | −1 | +1 | 91.6 | 92.2 | 92.0 |
| 74 | +1 | −1 | −1 | −1 | −1 | −1 | 86.8 | 79.5 | 87.4 |
| 75 | +1 | +1 | −1 | +1 | +1 | +1 | 93.6 | 101.2 | 89.7 |
| 76 | −1 | +1 | −1 | −1 | +1 | −1 | 97.5 | 95.2 | 97.4 |
| 77 | 0 | 0 | 0 | 0 | 0 | 0 | 96.0 | 97.1 | 94.9 |
| 78 | −1 | +1 | +1 | −1 | +1 | −1 | 99.1 | 98.4 | 98.9 |
| 79 | 0 | 0 | 0 | 0 | 0 | 0 | 95.5 | 96.9 | 93.9 |
| 80 | 0 | 0 | −α | 0 | 0 | 0 | 84.2 | 84.9 | 79.5 |
| 81 | +1 | +1 | −1 | +1 | −1 | +1 | 94.5 | 94.1 | 95.8 |
| 82 | +1 | +1 | −1 | −1 | +1 | −1 | 97.3 | 96.0 | 97.3 |
| 83 | +1 | −1 | −1 | −1 | +1 | +1 | 83.2 | 86.8 | 81.9 |
| 84 | +1 | −1 | +1 | −1 | +1 | −1 | 85.3 | 91.8 | 88.2 |
| 85 | +1 | −1 | +1 | −1 | −1 | −1 | 86.1 | 93.4 | 91.0 |
| 86 | 0 | 0 | 0 | −α | 0 | 0 | 98.4 | 87.5 | 97.6 |
| 87 | −1 | −1 | +1 | +1 | +1 | −1 | 82.4 | 83.7 | 84.2 |
| 88 | −1 | −1 | −1 | −1 | +1 | +1 | 88.6 | 77.4 | 80.2 |
| 89 | 0 | −α | 0 | 0 | 0 | 0 | 58.3 | 59.2 | 62.6 |
| 90 | −1 | −1 | −1 | −1 | −1 | +1 | 87.2 | 73.8 | 77.6 |
Full quadratic polynomial models were applied for all responses (see Table 4 for statistical parameters). A linear relationship between the experimental and predicted values for the responses was observed, as shown in Fig. 6a, with a high correlation co-efficient that indicates the applicability of models. Guan and Yao39 suggested that R2 should be atleast 0.80 for a good fit of the model. In this case, R2 for the model obtained was 0.993, 0.997 and 0.987 for BG, MB and CV, respectively.
| Model summary statistics | ||||||||||||||||
|---|---|---|---|---|---|---|---|---|---|---|---|---|---|---|---|---|
| Source | %RBG | %RMB | %RCV | |||||||||||||
| SDa | R2b | R2 adjustc | R2 predictd | PRESSe | SD | R2 | R2 adjust | R2 predict | PRESS | SD | R2 | R2 adjust | R2 predict | PRESS | ||
| a Standard deviation: square root of the pure (experimental) error.b Co-efficient of determination.c Adjusted co-efficient of determination.d Predicted co-efficient of determination.e Predicted residual sum of squares: a measure of how this particular model fits each point in the design.f Co-efficient of variation, the standard deviation as a percentage of mean.g Adequate precision: compares the range of predicted values at design points to the average predication error. | ||||||||||||||||
| Linear | 4.21 | 0.754 | 0.736 | 0.718 | 1690.3 | 3.96 | 0.759 | 0.741 | 0.717 | 1522.8 | 3.704 | 0.775 | 0.759 | 0.737 | 1335 | |
| 2FI | 3.72 | 0.84 | 0.795 | 0.812 | 1128.1 | 3.63 | 0.834 | 0.783 | 0.799 | 1081.53 | 3.303 | 0.854 | 0.809 | 0.817 | 94 | |
| Quadratic | 0.83 | 0.993 | 0.990 | 0.983 | 102.1 | 0.53 | 0.997 | 0.995 | 0.992 | 42.945 | 1.03 | 0.987 | 0.981 | 0.969 | 160 | Suggested |
| Cubic | 0.85 | 0.996 | 0.989 | 0.659 | 2042.4 | 0.52 | 0.998 | 0.996 | 0.814 | 999.765 | 1.15 | 0.991 | 0.977 | 0.358 | 3256 | Aliased |
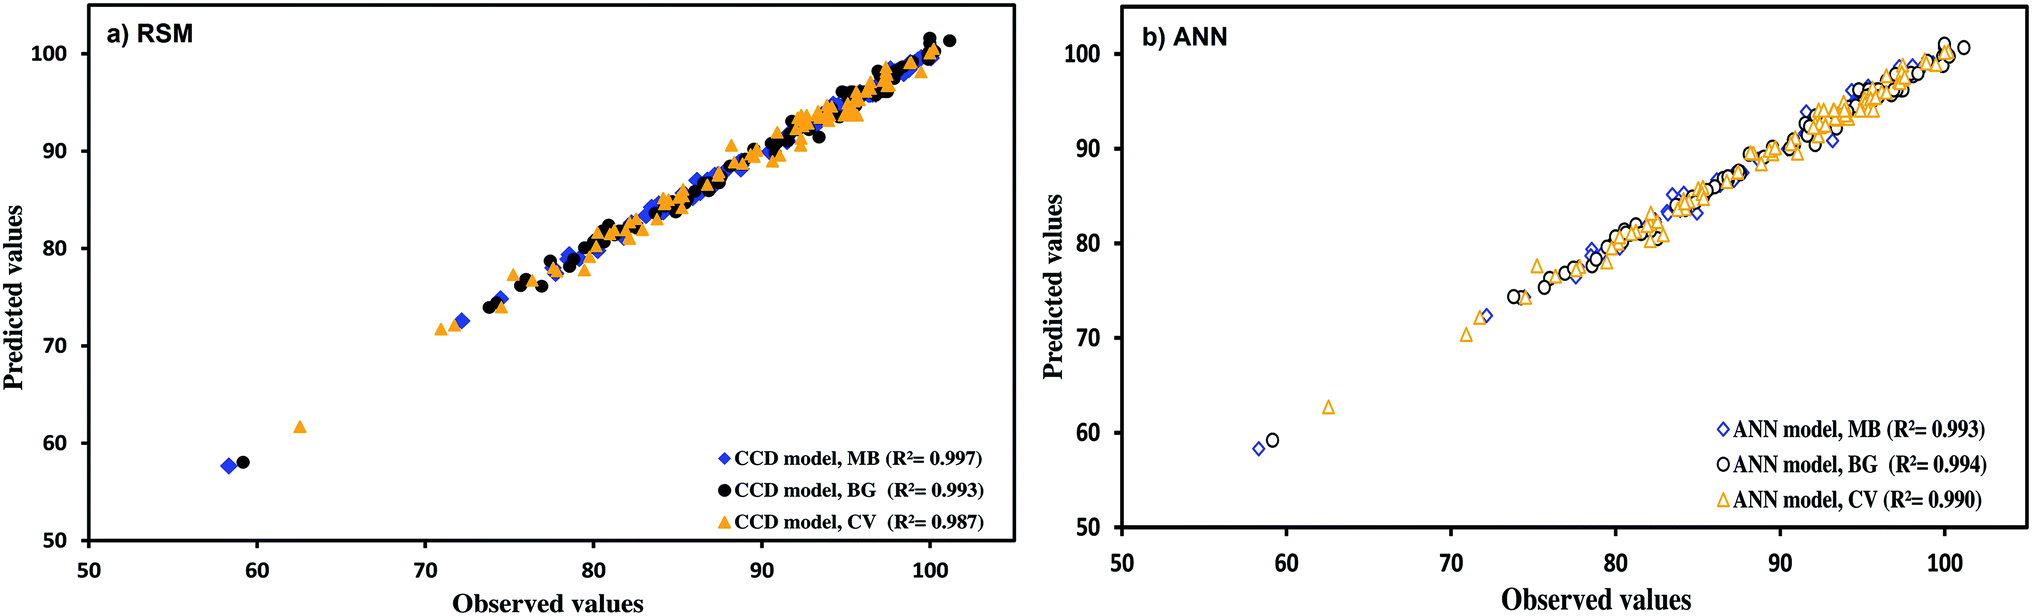 | ||
| Fig. 6 Predicted vs. experimental data for dyes using (a) RSM and (b) ANN. | ||
Table 5 summarizes the results obtained for the ANOVA study. The statistical significance of the model is determined using F-test ANOVA. A p-value less than 0.05 implies the significance of the corresponding variable.28 The independent parameters, including pH, adsorbent dosage, sonication time and initial concentration of each dye, have a significant influence on the yield of the adsorption process (Table 5).
| Source of variation | Dfb | CV | BG | MB | |||||||||
|---|---|---|---|---|---|---|---|---|---|---|---|---|---|
| SSa | MSc | F-value | p-value | SSa | MSc | F-value | p-value | SSa | MSc | F-value | p-value | ||
| a Sum of square: sums of squares, sum of the squared differences between the average values and the overall mean.b Degrees of freedom.c Mean of square: sum of squares divided by Df. | |||||||||||||
| Model | 27 | 5370 | 199 | 711 | <0.0001 | 5950 | 220 | 322 | <0.0001 | 5010 | 185 | 175 | <0.0001 |
| X1 | 1 | 88.21 | 88.21 | 81.214 | 0.0000 | 98.1 | 98.1 | 147.12 | 0.0000 | 87.25 | 87.25 | 365.53 | 0.0000 |
| X12 | 1 | 5.70 | 5.7 | 5.226 | 0.0397 | 91.04 | 91.04 | 136.6 | 0.0000 | 108.1 | 108.1 | 452.87 | 0.0000 |
| X2 | 1 | 2632 | 2632 | 2423.3 | 0.0000 | 3802.4 | 3802.4 | 5703.5 | 0.0000 | 3715 | 3715 | 15![[thin space (1/6-em)]](https://www.rsc.org/images/entities/char_2009.gif) 564 564 |
0.0000 |
| X22 | 1 | 459.8 | 459.8 | 423.32 | 0.0000 | 635.21 | 635.21 | 952.8 | 0.0000 | 657.8 | 657.8 | 2755.6 | 0.0000 |
| X3 | 1 | 192.5 | 192.5 | 177.2 | 0.0000 | 318.16 | 318.16 | 477.24 | 0.0000 | 19.5 | 19.5 | 81.67 | 0.0000 |
| X32 | 1 | 245.0 | 245.0 | 225.6 | 0.0000 | 82.778 | 82.778 | 124.2 | 0.0000 | 210.7 | 210.7 | 882.53 | 0.0000 |
| X4 | 1 | 397.2 | 397.2 | 365.7 | 0.0000 | 11.026 | 11.026 | 16.538 | 0.0013 | 238.3 | 238.3 | 998.41 | 0.0000 |
| X42 | 1 | 19.12 | 19.12 | 17.607 | 0.0011 | 199.4 | 199.4 | 299.1 | 0.0000 | 14.02 | 14.02 | 58.75 | 0.0000 |
| X5 | 1 | 8.418 | 8.418 | 7.751 | 0.0155 | 285.12 | 285.12 | 427.67 | 0.0000 | 0.256 | 0.256 | 1.07 | 0.3196 |
| X52 | 1 | 4.090 | 4.090 | 3.766 | 0.0743 | 59.753 | 59.753 | 89.629 | 0.0000 | 5.052 | 5.052 | 21.16 | 0.0005 |
| X6 | 1 | 615.2 | 615.2 | 566.39 | 0.0000 | 3.773 | 3.773 | 5.659 | 0.0334 | 22.43 | 22.43 | 93.95 | 0.0000 |
| X62 | 1 | 43.4 | 43.4 | 39.933 | 0.0002 | 59.617 | 59.617 | 89.424 | 0.0000 | 20.83 | 20.83 | 87.27 | 0.0000 |
| X1X2 | 1 | 26.9 | 26.9 | 24.730 | 0.0003 | 43.664 | 43.664 | 65.495 | 0.0000 | 72.4 | 72.4 | 303.07 | 0.0000 |
| X1X3 | 1 | 0.118 | 0.118 | 0.109 | 0.7466 | 8.661 | 8.661 | 12.991 | 0.0032 | 17.52 | 17.52 | 73.39 | 0.0000 |
| X1X4 | 1 | 16.8 | 16.8 | 15.463 | 0.0020 | 100.13 | 100.13 | 150.2 | 0.0000 | 20.6 | 20.69 | 86.08 | 0.0000 |
| X1X5 | 1 | 33.8 | 33.8 | 31.102 | 0.0001 | 3.933 | 3.933 | 5.899 | 0.0304 | 16.79 | 16.79 | 70.36 | 0.0000 |
| X1X6 | 1 | 63.4 | 63.4 | 58.387 | 0.0000 | 57.458 | 57.458 | 86.186 | 0.0000 | 0.562 | 0.562 | 2.36 | 0.1488 |
| X2X3 | 1 | 1.011 | 1.011 | 0.931 | 0.3522 | 35.193 | 35.193 | 52.789 | 0.0000 | 0.018 | 0.018 | 0.08 | 0.7852 |
| X2X4 | 1 | 82.31 | 82.31 | 75.786 | 0.0000 | 102.51 | 102.51 | 153.76 | 0.0000 | 113.9 | 113.9 | 477.04 | 0.0000 |
| X2X5 | 1 | 14.7 | 14.7 | 13.527 | 0.0028 | 0.215 | 0.215 | 0.323 | 0.5796 | 19.22 | 19.22 | 80.50 | 0.0000 |
| X2X6 | 1 | 48.4 | 48.4 | 44.560 | 0.0001 | 0.985 | 0.985 | 1.477 | 0.2458 | 5.495 | 5.495 | 23.02 | 0.0004 |
| X3X4 | 1 | 10.9 | 10.9 | 10.015 | 0.0075 | 62.713 | 62.713 | 94.068 | 0.0000 | 13.22 | 13.22 | 55.39 | 0.0000 |
| X3X5 | 1 | 1.2 | 1.2 | 1.094 | 0.3150 | 40.563 | 40.563 | 60.843 | 0.0000 | 38.49 | 38.49 | 161.25 | 0.0000 |
| X3X6 | 1 | 22.42 | 22.42 | 20.641 | 0.0006 | 39.688 | 39.688 | 59.532 | 0.0000 | 2.698 | 2.698 | 11.30 | 0.0051 |
| X4X5 | 1 | 65.33 | 65.33 | 60.149 | 0.0000 | 3.181 | 3.181 | 4.772 | 0.0478 | 23.67 | 23.7 | 99.07 | 0.0000 |
| X4X6 | 1 | 6.9 | 6.9 | 6.336 | 0.0258 | 31.856 | 31.856 | 47.784 | 0.0000 | 8.124 | 8.124 | 34.03 | 0.0001 |
| X5X6 | 1 | 2.83 | 2.83 | 2.606 | 0.1305 | 3.644 | 3.644 | 5.466 | 0.0360 | 53.21 | 53.21 | 222.92 | 0.0000 |
| Lack-of-fit | 49 | 51.52 | 1.051 | 0.968 | 0.5631 | 33.820 | 0.690 | 1.035 | 0.5033 | 14.22 | 0.290 | 1.22 | 0.3652 |
| Pure error | 13 | 14.12 | 1.086 | 8.667 | 0.667 | 3.103 | 0.239 | ||||||
| Total | 89 | 5072 | 5992.8 | 5382.4 | |||||||||
The non-significant value of lack of fit and a significant value for the model proved the validity of the quadratic model. This model for RSM proved to be highly significant due to its high Fisher's F-value (711, 322 and 175 for BG, MB and CV, respectively) with a low probability value (p < 0.0001) (Table 5). The predicted R-squared (0.981, 0.990 and 0.995 for CV, BG and MB, respectively) and the adjusted R-squared (0.969, 0.983 and 0.992 for CV, BG and MB, respectively) are in a reasonable agreement. The residual variation is measured using the co-efficient of variance relative to the size of the mean. A very low value for the co-efficient of variance (0.929, 0.582 and 1.15 for BG, MB and CV, respectively) implies a sufficient precision and reliability of the experimental results. Predicted residual sum of squares (PRESS) is another parameter to express the fitness of the model. The smaller the PRESS, the better the model fits the data points. In the present study, the calculated values of PRESS were 102.1, 42.945 and 160.032 for BG, MB and CV, respectively. The standard deviation and mean values were obtained to be less than 1.1 and larger than 89%, respectively. The following second order models were obtained after the ANOVA study:
| yMB = 34.54 + 10.6X1 + 1739X2 + 4.4X3 − 0.4X4 − 0.444X5 + 0.27X6 + 213X1X2 + 0.5X1X3 − 0.3X1X4 − 0.3X1X5 + 133.4X2X4 + 54.8X2X5 − 29.3X2X6 + 0.23X3X4 + 0.4X3X5 − 0.103X3X6 − 0.15X4X5 + 0.23X5X6 − 0.96X12 − 94378X22 − 1.34X32 − 0.11X62 | (5) |
| yBG = −70.4 + 14.6X1 + 5042X2 + 16.1X3 + 6.8X4 + 3.0X5 − 1.3X6 − 165.2X1X2 + 0.4X1X3 − 0.6X1X4 − 0.12X1X5 + 0.48X1X6 − 148X2X3 + 126.6X2X4 − 0.5X3X4 − 0.4X3X5 − 0.4X3X6 + 0.18X4X6 − 0.9X12 − 92746X22 − 0.84X32 − 0.34X42 − 0.18X52 − 0.18X62 | (6) |
| yCV = 62.4 − 0.34X1 + 1793X2 + 10.6X3 − 3.2X4 + 5.8X5 − 5.7X6 + 130X1X2 + 0.26X1X4 − 0.4X1X5 + 0.5X1X6 + 113.4X2X4 − 48X2X5 + 87X2X6 + 0.21X3X4 + 0.3X3X6 − 0.25X4X5 − 0.22X12 − 78905X22 − 1.44X32 − 0.1X42 − 0.15X62 | (7) |
As mentioned above, Fig. 6a shows the good fit of the RSM model to the experimental data.
The analysis of the results is visualized using standardized main effect Pareto charts (P = 95%) and two factor interaction Pareto charts (P = 95%), as shown in Fig. 7. The results confirm that the factors for X1, X2, X3 and X6 as well as the quadratic effects of X12, X22 and X32 are the most effective factors.
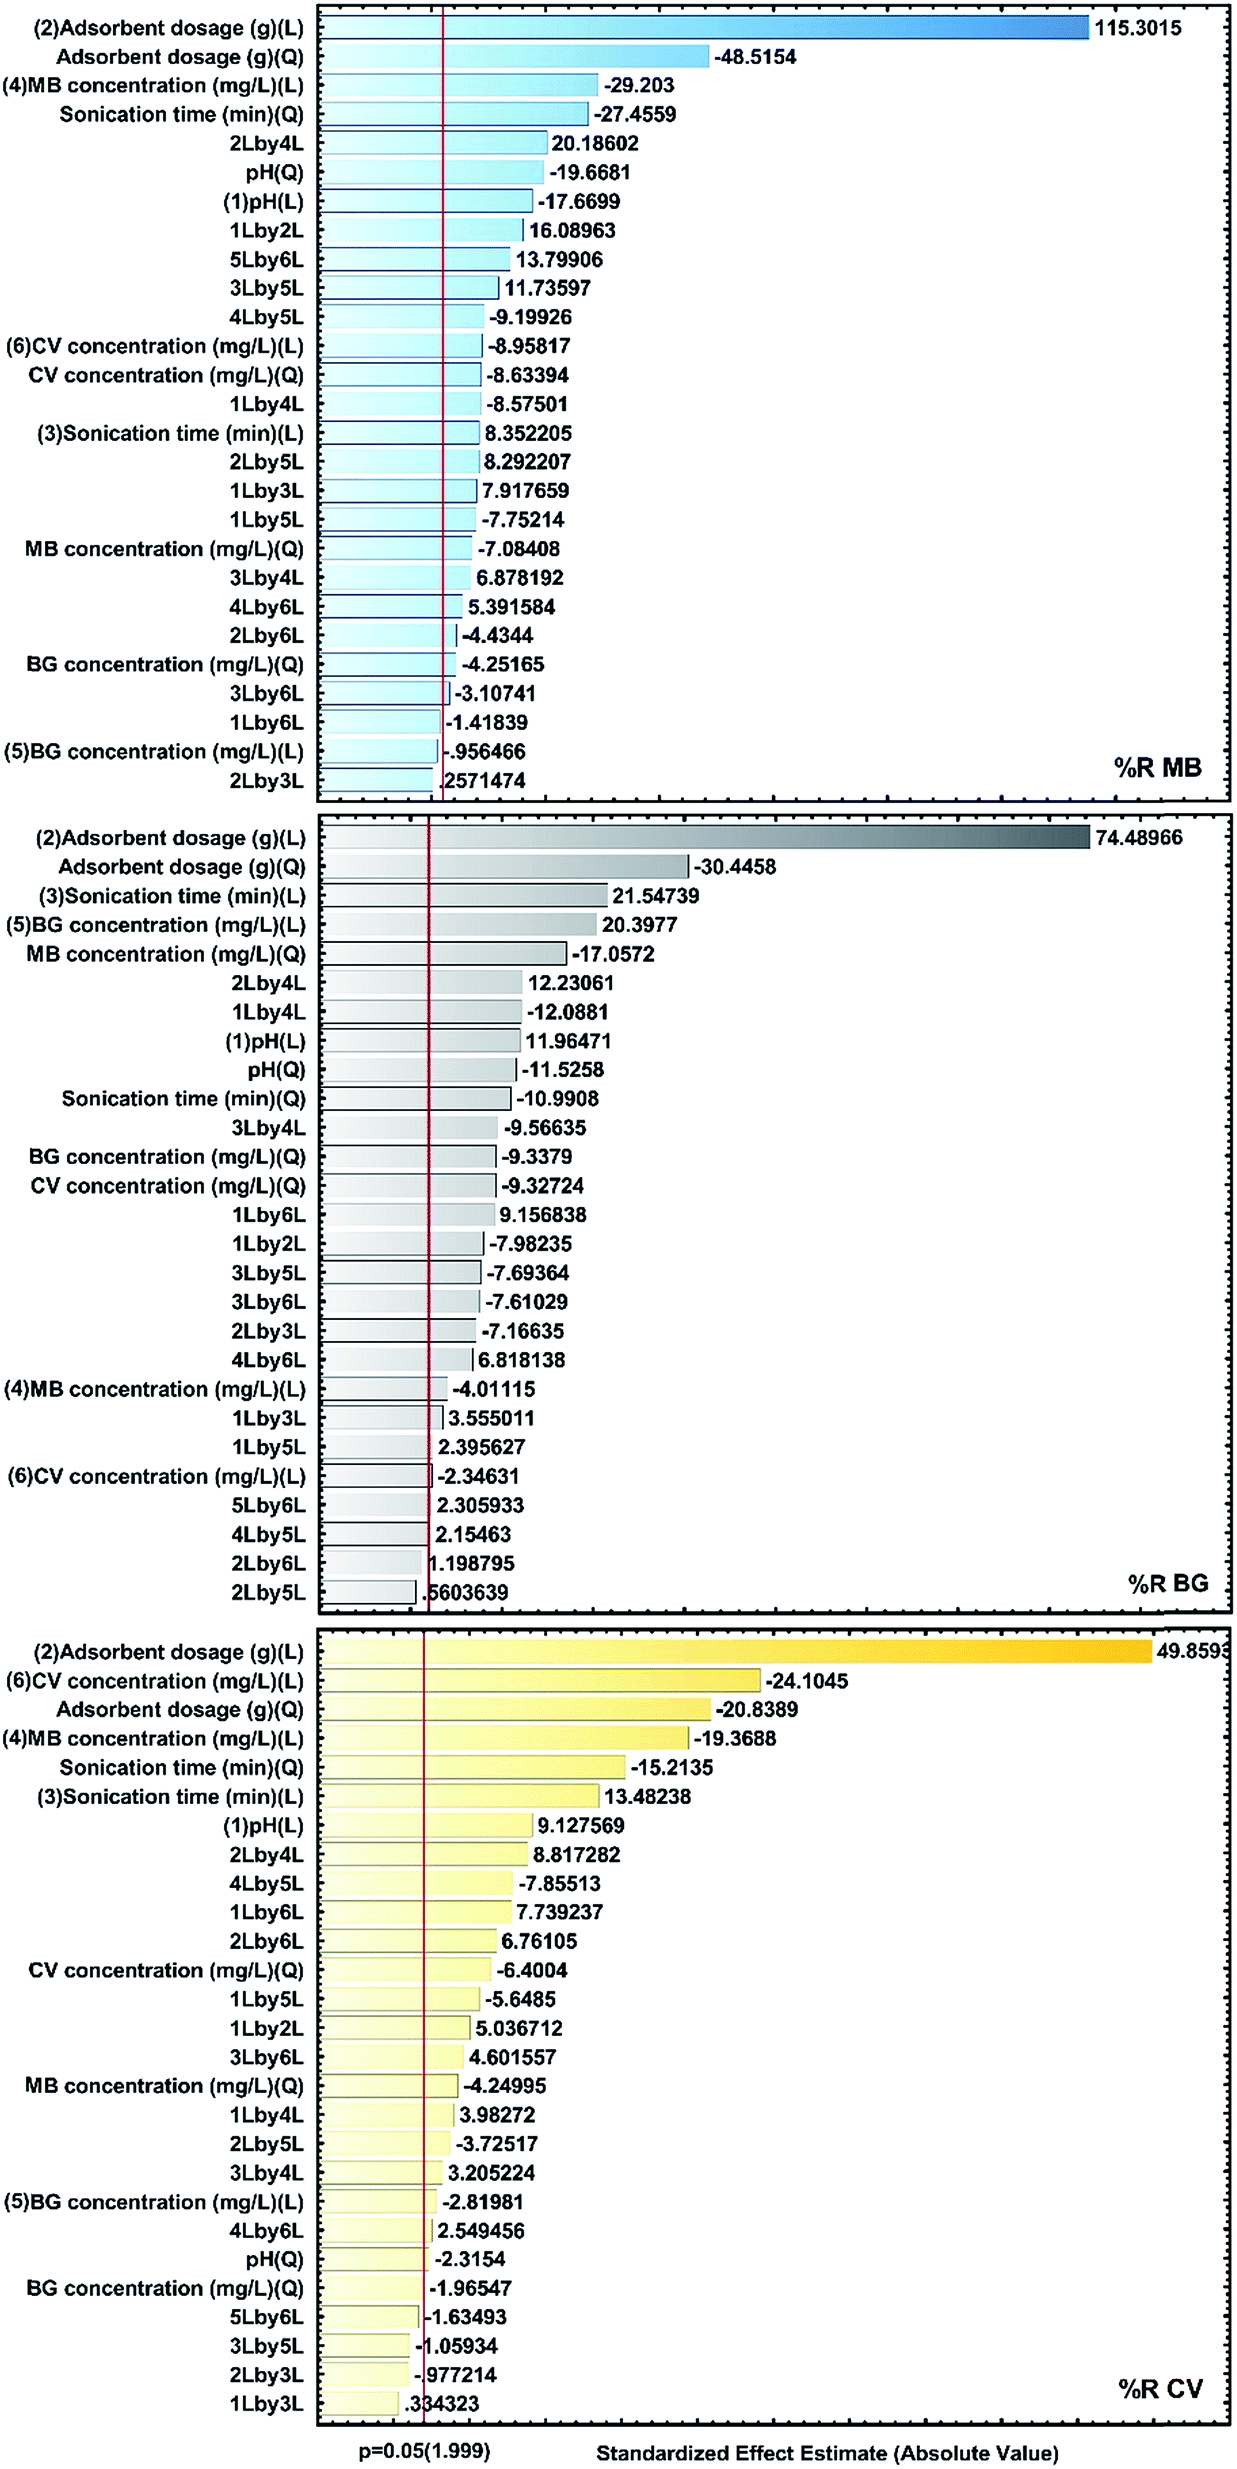 | ||
| Fig. 7 Standardized main effect Pareto chart for the removal of MB, BG and CV using CCD. | ||
3.4. Response surface methodology
RSM is applied to optimize the parameters and explain the nature of the response surface in the experiments. Fig. 8 shows the related fitted three dimensional response surfaces of R% versus the significant variables. These plots were achieved for a certain pair of variables at center values of other variables. Fig. 8a strongly supports that the MB removal percentage increases with increasing pH and sonication time. It can be noted that the surface charge of MnO2-NPs-AC at a pH lower than pHZPC is positive. At pH higher than the pHZPC, the adsorbent charge changes to negative and makes it possible to efficiently remove cationic compounds. According to abovementioned considerations, basic conditions are more ideal for dye adsorption. The maximum adsorption of dyes was achieved at the middle sonication time. It was found that more than 95% of MB removal occurs in 3.0 min and reaches equilibrium after about 4.0 min of sonication. Fig. 8b shows the behavior of R% for MB versus the adsorbent and sonication time. The increase in the amount of adsorbent leads to a significant decrease in the sonication time, whereas at a fixed amount of the adsorbent, the removal percentage was observed to increase with an increase in the sonication time. Fig. 8c shows the changes in the efficiency of BG removal using MnO2-NP-AC. The BG concentration and initial pH of the solution were varied, while the other four variables were held at zero level. A maximum removal efficiency for BG (99%) was reached when the initial pH of the solution and BG concentration were 7 and 6 mg L−1, respectively. This result is due to the influence of pH of the adsorption medium on the BG removal efficiency. As shown in Fig. 8d, the CV removal percentage varies as a function of adsorbent dosage with a positive correlation; therefore, the adsorption increases with an increase in the adsorbent dosage (i.e. an increase in the specific surface area and reactive centers). A significant decrease in the removal percentage with lower amounts of MnO2-NP-AC is due to unbalancing of the dye molecules to vacant sites ratio.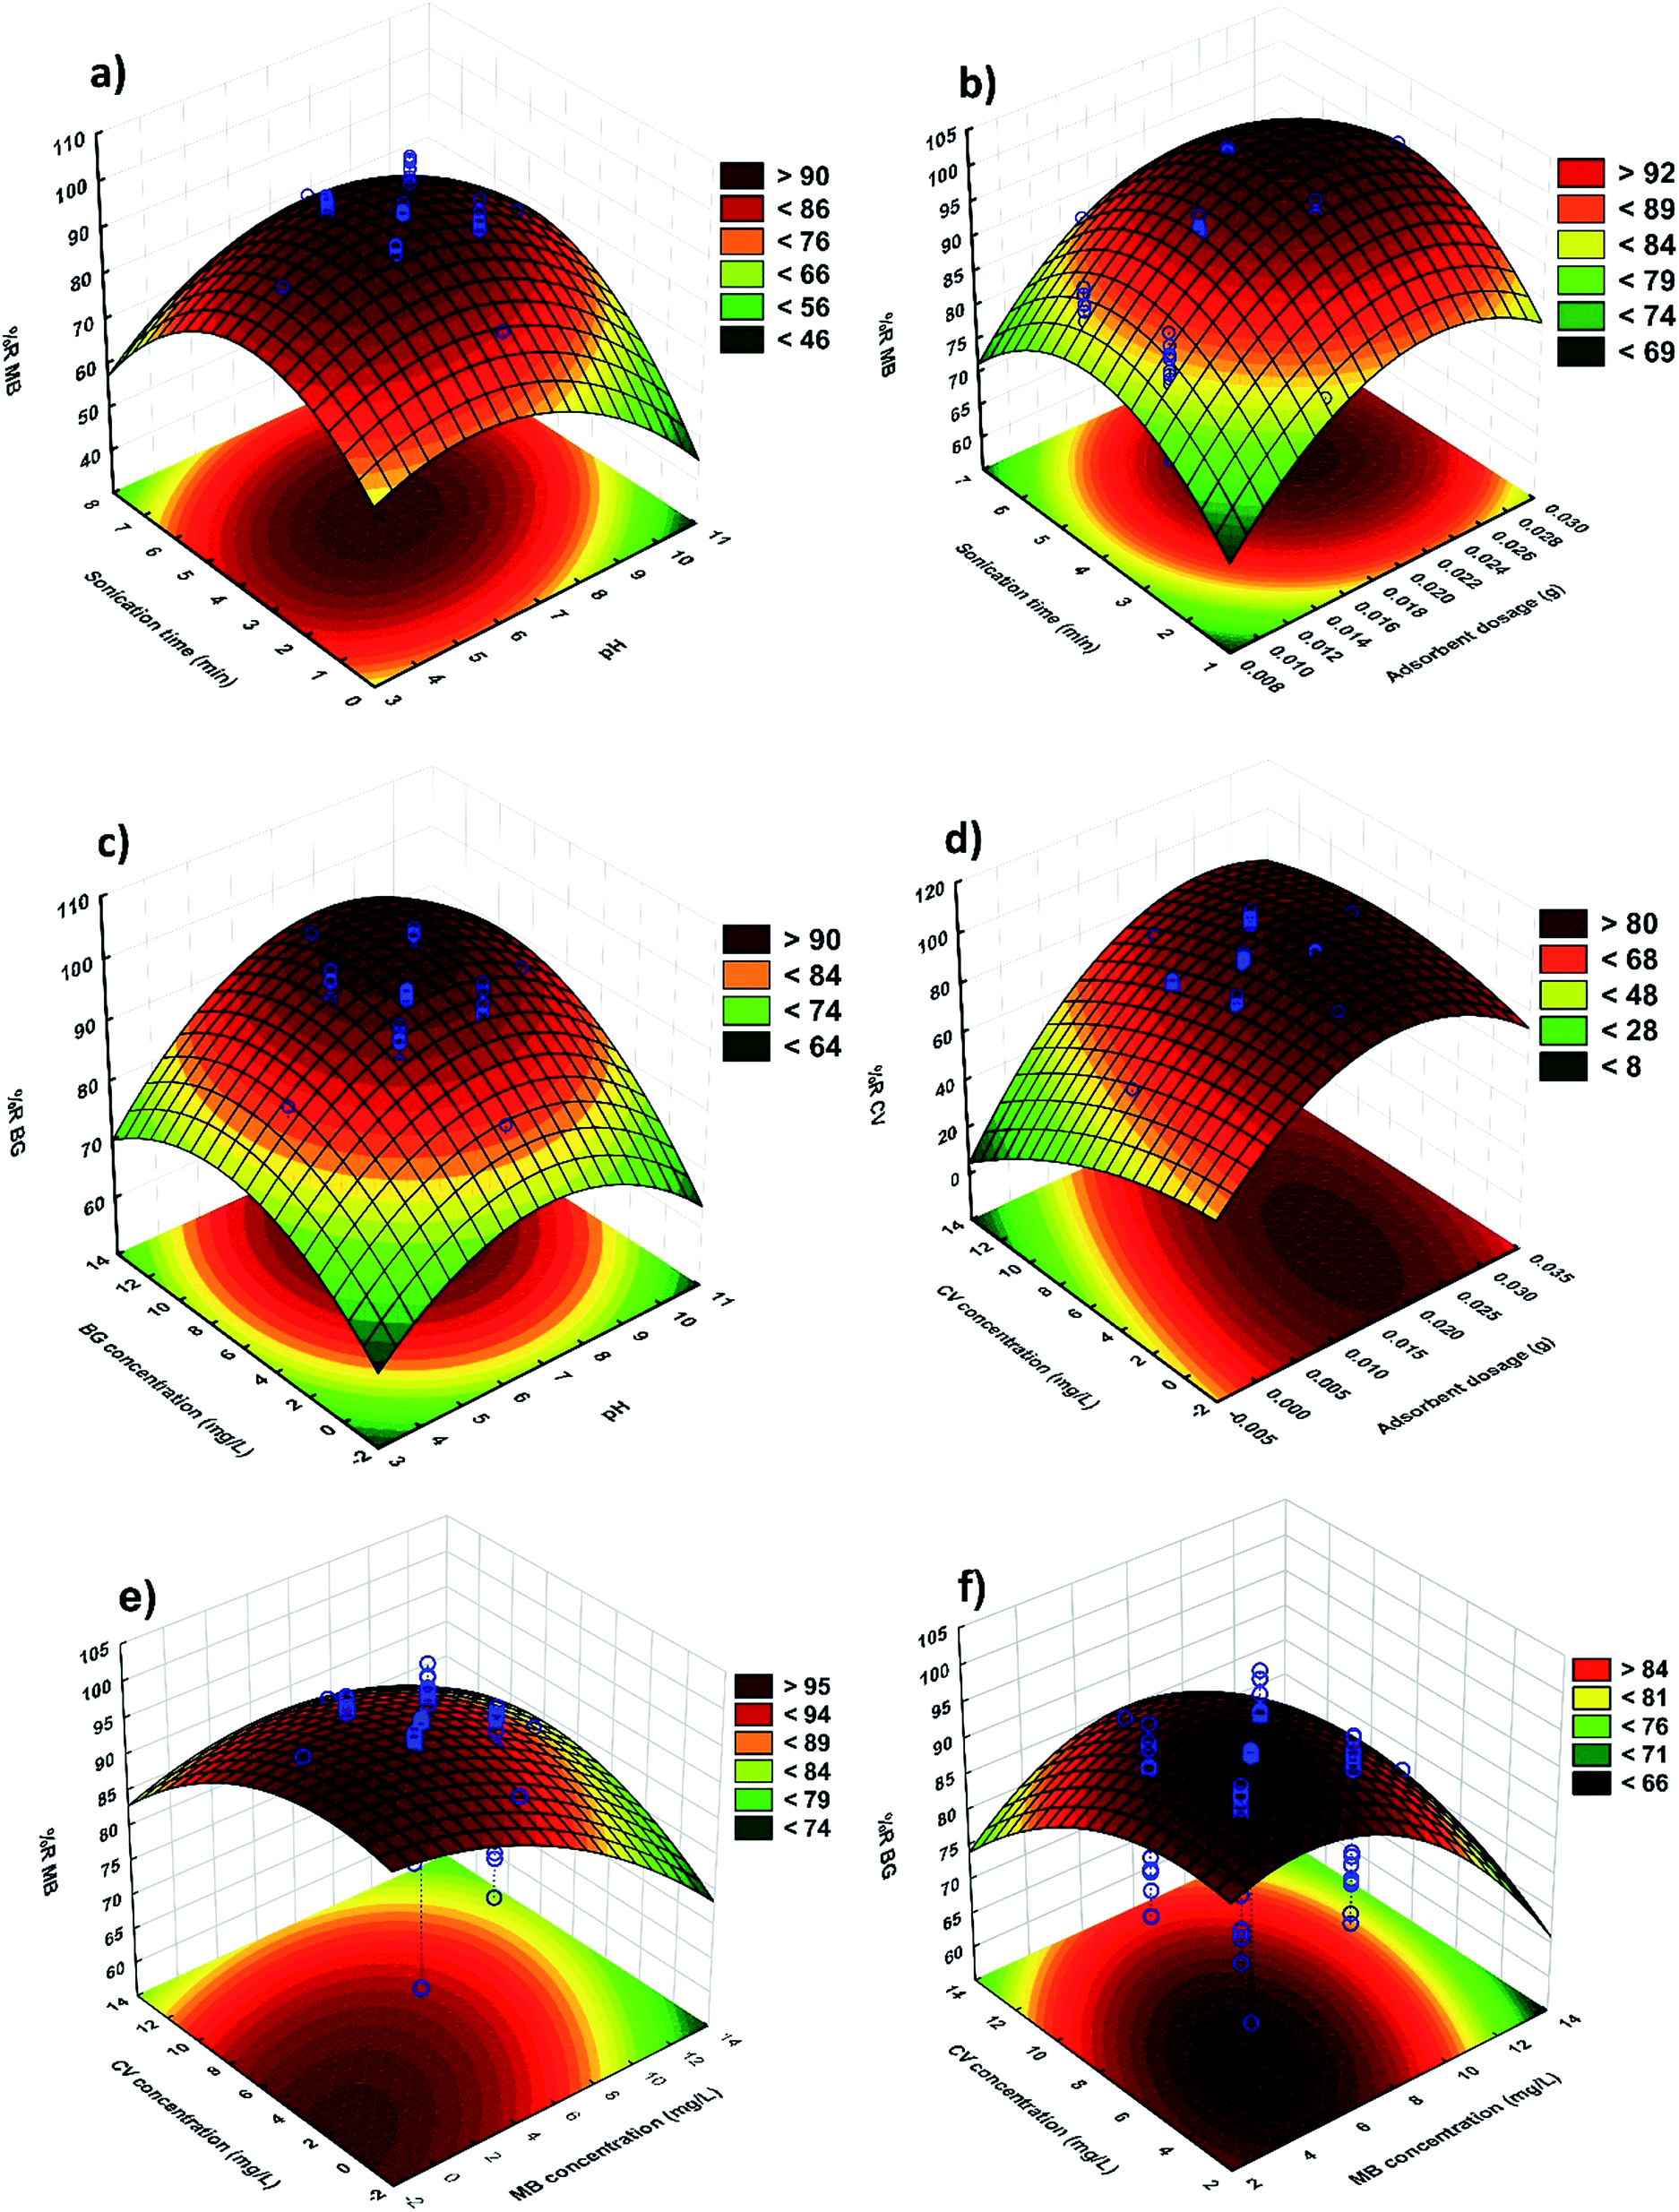 | ||
| Fig. 8 3D response surfaces: (a) pH–sonication time (MB), (b) adsorbent dosage–sonication time (MB), (c) pH–BG concentration (BG), (d) CV concentration–adsorbent dosage (CV), (e) CV concentration–MB concentration (MB) and (f) CV concentration–MB concentration (BG). | ||
The effects of initial MB and BG dyes concentration on the removal percentages of MB and BG are shown in Fig. 8e and f, respectively. It was observed that the removal percentage of each dye decreases upon increasing the dyes concentration, which is due to the decrease in the ratio of available surface adsorption sites to the dyes molecules.
3.5. Optimization of dye adsorption from aqueous solutions using RSM
After analyzing the polynomial equations modeling the dependent and independent variables, the process was further optimized and validated using the desirability criterion of maximum removal of CV, BG and MB. A 3D plot helps to identify an optimum point on the response surface, whereas a response optimizer allows setting a target for the desired output and accordingly displays the optimum solution. The desirability profile for the predicted values was obtained for the optimization of the process (Fig. 9). The desirability close to 1 indicates the most desired conditions and the corresponding responses. The RSM experiments were performed and the maximum R% for each dye was found to be higher than 99%, whereas the minima of 62.55%, 59.16% and 58.32% were observed for CV, BG and MB, respectively.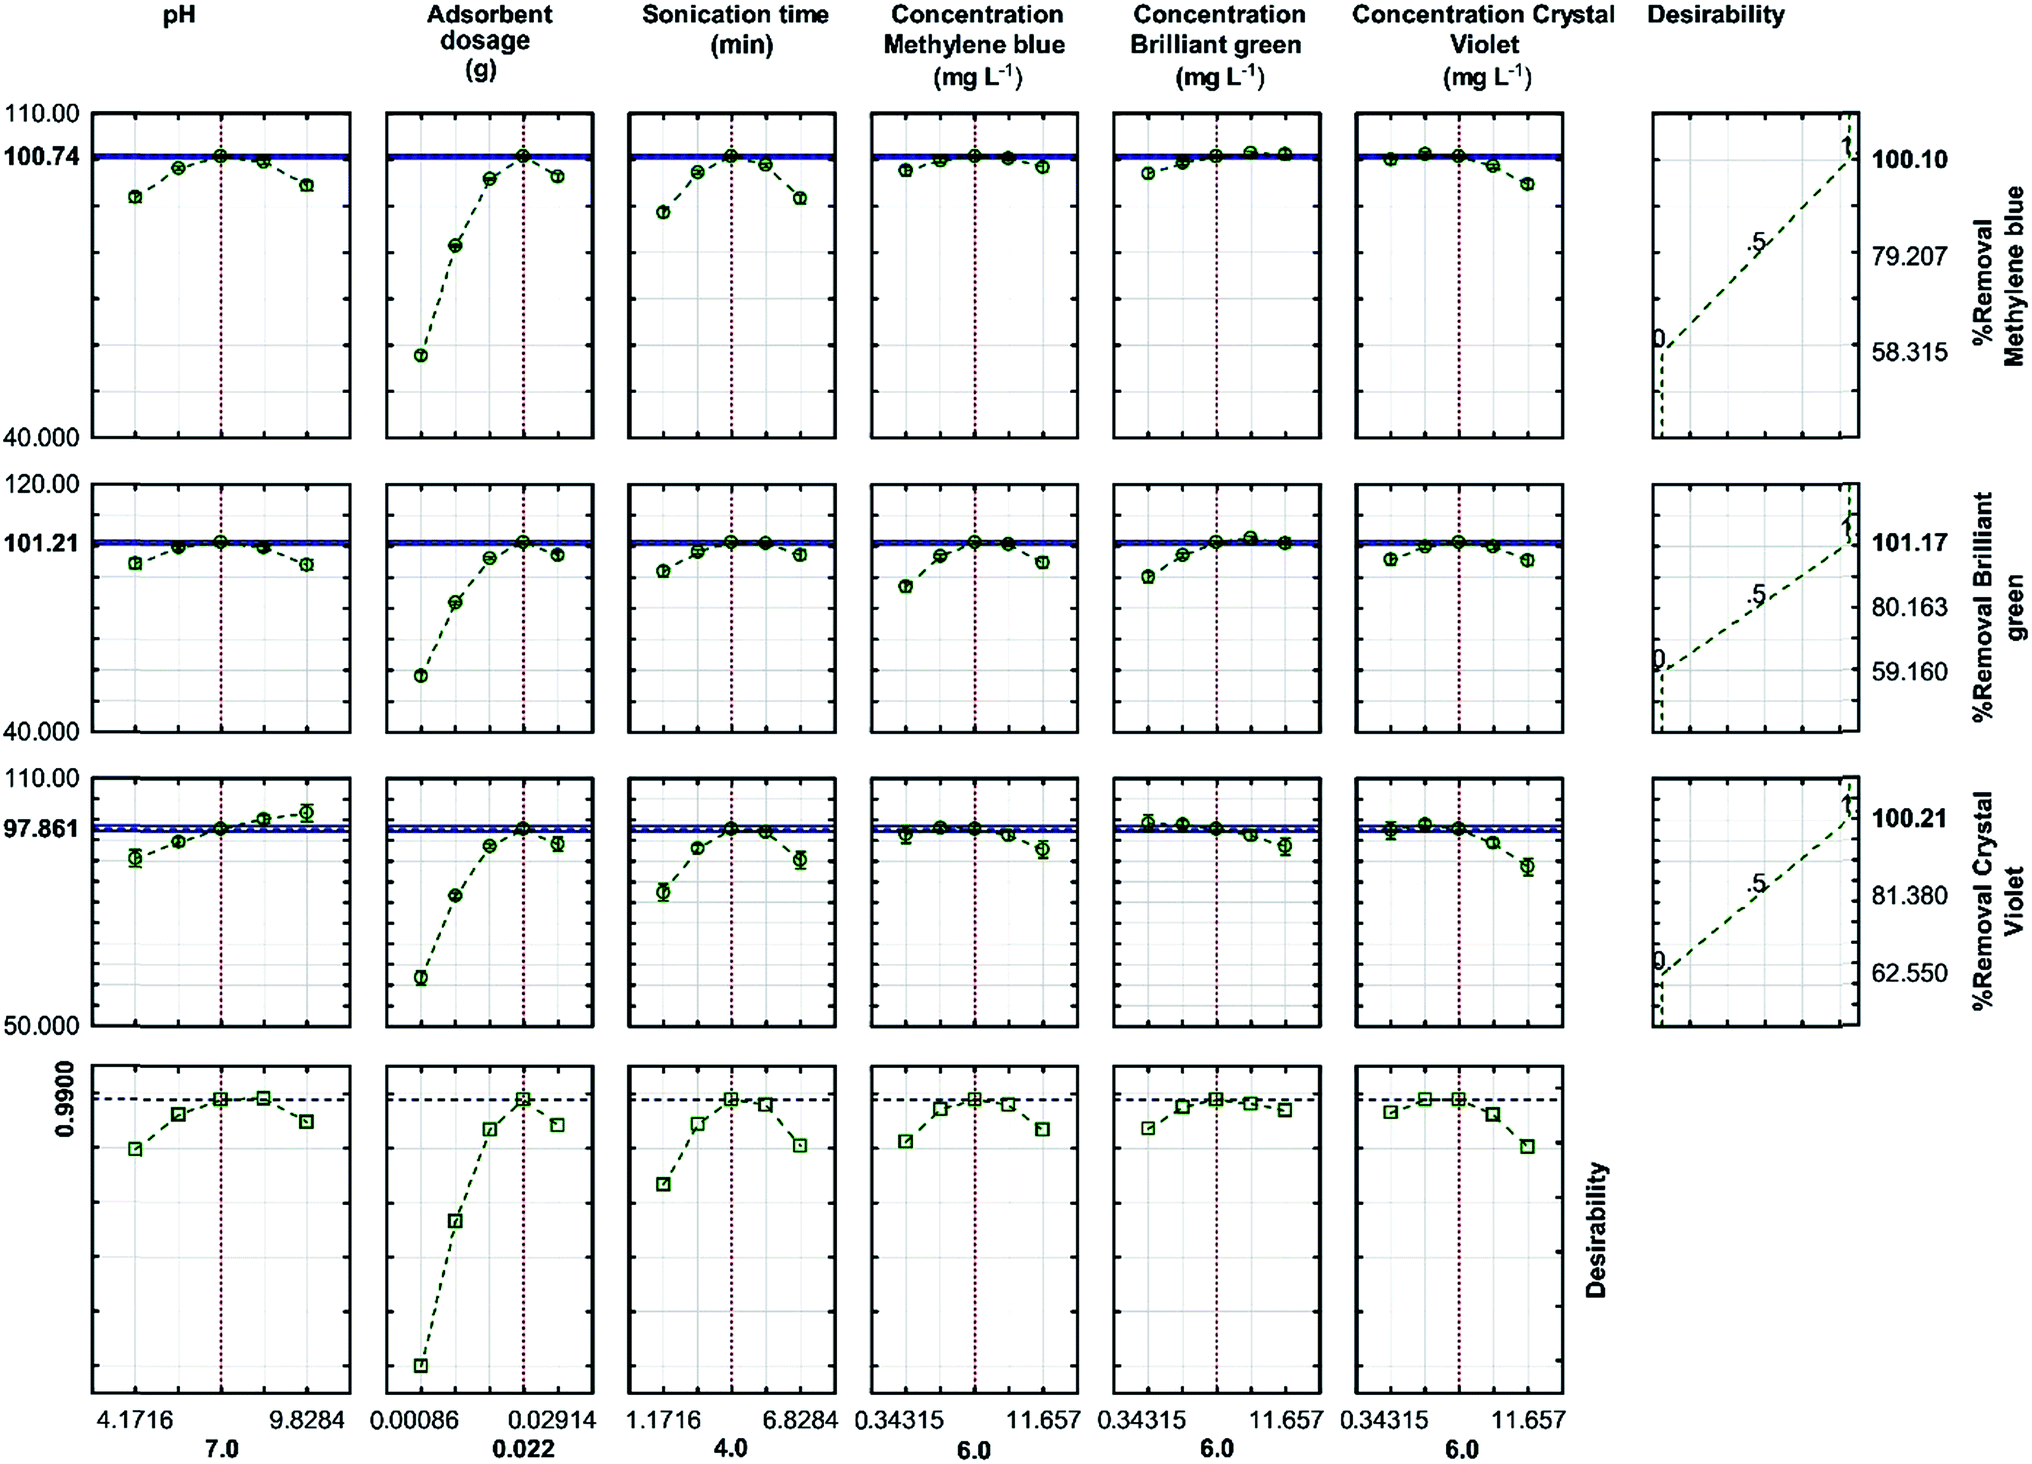 | ||
| Fig. 9 Profiles for the predicted values and desirability function for the removal percentage of MB, BG and CV. The dashed lines indicate the current values after the optimization process. | ||
The optimized values, predicted from the model presented in Fig. 9, were validated by running three experiments under similar conditions. As predicted, the results were in good agreement. Moreover, the adsorption studies also showed the highest efficiency for dye removal, wherein 0.022 g of the adsorbent was used for 4 min (sonication time) at pH 7 with the initial concentration of each dye set to be 6 mg L−1, which was closer to the optimized conditions predicted by the model. This confirms the suitability of the model for the prediction of the process behavior.
3.6. Modeling by artificial neural network (ANN)
An ANN was used for modeling the adsorption studies based on the application of the experimental data under different operating conditions to train and test the neural network model.40 The judgment of the efficiency of the ANN model is based on the maximization of the R2 value and reduction of the MSE value in the training set (1–15 neurons correspond to hidden layer). Table 6 shows the relation among the number of neurons, R2 and MSE for the selected ANN model. The R2 and MSE values are larger than 0.9988 and less than 0.00085, respectively. Therefore, ANN containing 8, 12 and 13 hidden neurons for MB, BG and CV, respectively, were selected as the best model for the prediction of the adsorption behavior. The plot of predicted removal data for the training and testing set (Fig. 6b) supports the good agreement between the experimental and predicted data.| Number of neurons | MB | BG | CV | |||||||||
|---|---|---|---|---|---|---|---|---|---|---|---|---|
| MSE-train | R2-train | MSE-test | R2-test | MSE-train | R2-train | MSE-test | R2-test | MSE-train | R2-train | MSE-test | R2-test | |
| 1 | 0.005421 | 0.923908 | 0.002822 | 0.973670 | 0.011771 | 0.902116 | 0.007638 | 0.941098 | 0.007594 | 0.942125 | 0.005523 | 0.913488 |
| 2 | 0.002228 | 0.987987 | 0.002132 | 0.983070 | 0.005642 | 0.957703 | 0.004329 | 0.975880 | 0.008594 | 0.912345 | 0.003315 | 0.963331 |
| 3 | 0.001753 | 0.988195 | 0.002382 | 0.974333 | 0.001973 | 0.990307 | 0.003541 | 0.978176 | 0.003980 | 0.965908 | 0.005369 | 0.959400 |
| 4 | 0.001337 | 0.991838 | 0.001710 | 0.984631 | 0.001204 | 0.997766 | 0.003013 | 0.968932 | 0.004247 | 0.972391 | 0.005351 | 0.932014 |
| 5 | 0.000505 | 0.998696 | 0.001199 | 0.990081 | 0.000825 | 0.998840 | 0.002274 | 0.980862 | 0.002209 | 0.984881 | 0.003150 | 0.975245 |
| 6 | 0.000334 | 0.999628 | 0.000982 | 0.986712 | 0.000784 | 0.998331 | 0.001657 | 0.988000 | 0.001175 | 0.995872 | 0.002449 | 0.981416 |
| 7 | 0.001172 | 0.995788 | 0.001748 | 0.982144 | 0.001021 | 0.995697 | 0.001314 | 0.985952 | 0.000853 | 0.996699 | 0.001716 | 0.976121 |
| 8 | 0.000273 | 0.999308 | 0.000527 | 0.995920 | 0.001021 | 0.999335 | 0.001922 | 0.983160 | 0.001147 | 0.998017 | 0.002499 | 0.957441 |
| 9 | 0.000309 | 0.999623 | 0.000654 | 0.993499 | 0.000940 | 0.994659 | 0.001551 | 0.985281 | 0.001069 | 0.995633 | 0.001757 | 0.983291 |
| 10 | 0.000367 | 0.999690 | 0.001064 | 0.993552 | 0.001459 | 0.995298 | 0.002652 | 0.975787 | 0.001039 | 0.998368 | 0.002023 | 0.974791 |
| 11 | 0.000350 | 0.999476 | 0.000677 | 0.992291 | 0.001867 | 0.989616 | 0.001742 | 0.986888 | 0.002911 | 0.994962 | 0.003929 | 0.967318 |
| 12 | 0.000336 | 0.999568 | 0.000868 | 0.994985 | 0.000826 | 0.999121 | 0.001236 | 0.998146 | 0.001461 | 0.992040 | 0.001763 | 0.960691 |
| 13 | 0.000979 | 0.999627 | 0.001032 | 0.991068 | 0.000915 | 0.998520 | 0.001844 | 0.983562 | 0.000826 | 0.998468 | 0.001290 | 0.985087 |
| 14 | 0.000572 | 0.999857 | 0.000878 | 0.988946 | 0.001298 | 0.991514 | 0.001259 | 0.990562 | 0.001269 | 0.998376 | 0.001885 | 0.980868 |
| 15 | 0.000608 | 0.999721 | 0.001551 | 0.979541 | 0.000901 | 0.999283 | 0.001636 | 0.985598 | 0.001528 | 0.997022 | 0.002018 | 0.982561 |
3.7. Application of adsorption models to the equilibrium data
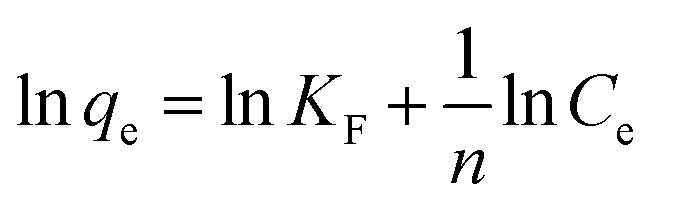
The adsorption isotherm describes the relationship between the amount of dye adsorbed at a constant temperature and its concentration in the equilibrium solution. The isotherms are useful for estimating the total amount of adsorbent needed to adsorb a desired amount of adsorbate from the solution.41 In the present study, equilibrium studies were carried out at 25 °C. The equilibrium data were analyzed using three of the most commonly used isotherms, Langmuir, Freundlich, Temkin and Dubinin–Radushkevich isotherm models under the optimum conditions.Eqn (8)–(11) show the linear equations of the Langmuir,42 Freundlich,43 Temkin,44 and Dubinin–Radushkevich45 models, respectively:
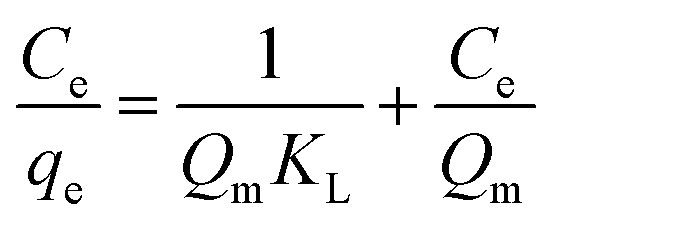 | (8) |
 | (9) |
|
qe = BlnKT + BlnCe
| (10) |
|
lnqe = lnQs − βε2
| (11) |
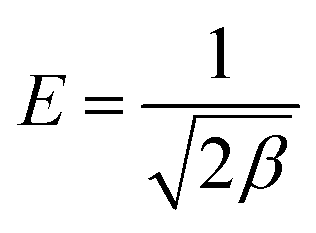
ln(1 + 1/Ce) (Polanyi potential), Qs is the adsorption capacity (mg g−1), β is the constant related to the adsorption energy, R is the gas constant and T is the absolute temperature (K).
Using the activity co-efficient, it is possible to estimate the mean energy of adsorption (kJ mol−1), which represents an indication of the mechanism involved in the adsorption, according to eqn (12):
 | (12) |
The essential characteristics of the Langmuir isotherm can be expressed by a dimensionless constant called equilibrium parameter as
 | (13) |
| Isotherm | Parameters | Dye | |||||||||||
|---|---|---|---|---|---|---|---|---|---|---|---|---|---|
| CV | BG | MB | |||||||||||
| 0.005 g | 0.010 g | 0.015 g | 0.022 g | 0.005 g | 0.010 g | 0.015 g | 0.022 g | 0.005 g | 0.010 g | 0.015 g | 0.022 g | ||
| Langmuir | Qm (mg g−1) | 263.16 | 148.81 | 108.23 | 86.66 | 206.20 | 147.27 | 94.69 | 68.82 | 234.20 | 141.83 | 95.51 | 74.02 |
| KL (L mg−1) | 0.874 | 4.048 | 4.666 | 3.746 | 0.976 | 4.140 | 8.874 | 8.117 | 2.160 | 3.890 | 7.425 | 5.774 | |
| R2 | 0.995 | 0.995 | 0.999 | 0.995 | 0.999 | 0.995 | 0.999 | 0.998 | 0.996 | 0.999 | 0.997 | 0.999 | |
| RL | 0.0367–0.1862 | 0.0082–0.0471 | 0.0071–0.0411 | 0.0088–0.0507 | 0.0330–0.1701 | 0.0080–0.0461 | 0.0037–0.0220 | 0.0041–0.0240 | 0.0152–0.0847 | 0.0085–0.0489 | 0.0045–0.0262 | 0.0057–0.0335 | |
| χ2 | 0.1079 | 0.1544 | 0.1911 | 0.0541 | 0.0723 | 0.4029 | 0.0535 | 0.1004 | 0.0620 | 0.1002 | 0.1978 | 0.0478 | |
| Freundlich | 1/n | 0.445 | 0.385 | 0.569 | 0.644 | 0.379 | 0.380 | 0.4688 | 0.514 | 0.336 | 0.486 | 0.475 | 0.565 |
| KF (L mg−1) | 7.637 | 7.688 | 7.928 | 7.313 | 7.018 | 7.65 | 7.804 | 7.017 | 8.471 | 7.986 | 7.614 | 7.060 | |
| R2 | 0.972 | 0.982 | 0.969 | 0.986 | 0.927 | 0.975 | 0.958 | 0.974 | 0.975 | 0.962 | 0.972 | 0.973 | |
| χ2 | 1.2852 | 1.1234 | 1.0113 | 0.8462 | 1.5695 | 1.1229 | 1.0096 | 0.8759 | 1.2317 | 1.1420 | 1.0120 | 0.8582 | |
| Temkin | B | 52.85 | 25.66 | 23.47 | 17.93 | 43.31 | 22.036 | 19.445 | 14.50 | 37.34 | 29.65 | 19.54 | 15.93 |
| KT (L mg−1) | 10.63 | 76.21 | 47.93 | 42.35 | 10.27 | 79.08 | 100.08 | 88.69 | 54.38 | 42.61 | 85.30 | 60.25 | |
| R2 | 0.994 | 0.978 | 0.994 | 0.984 | 0.984 | 0.987 | 0.990 | 0.991 | 0.994 | 0.998 | 0.995 | 0.995 | |
| χ2 | 0.1406 | 0.3574 | 0.1754 | 0.2276 | 0.1292 | 0.1929 | 0.1326 | 0.1843 | 0.078 | 0.1513 | 0.1425 | 0.1421 | |
| Dubinin–Radushkevich | Qs (mg g−1) | 186.3 | 94.38 | 86.84 | 65.04 | 156.5 | 98.69 | 86.20 | 61.07 | 174.0 | 115.4 | 83.56 | 63.18 |
| β × 10−8 | 7.190 | 1.550 | 2.370 | 2.540 | 9.210 | 1.810 | 1.850 | 1.900 | 2.710 | 2.800 | 1.940 | 2.310 | |
| E (kJ mol−1) | 2.637 | 5.679 | 4.652 | 6.274 | 2.329 | 5.255 | 5.198 | 7.254 | 4.295 | 5.226 | 5.077 | 6.579 | |
| R2 | 0.907 | 0.961 | 0.980 | 0.972 | 0.928 | 0.984 | 0.986 | 0.983 | 0.937 | 0.984 | 0.981 | 0.975 | |
| χ2 | 2.4415 | 1.8350 | 1.6036 | 1.7303 | 2.2308 | 1.6564 | 1.5032 | 1.6532 | 1.9397 | 1.4639 | 1.8026 | 1.6895 | |
The Langmuir, Freundlich Temkin and Dubinin–Radushkevich parameters were obtained under the optimum conditions according to the intercept and slope from the plots between Ce/qe vs. Ce (Fig. 10a), lnqe vs. lnCe (Fig. 10b), qe vs. lnCe (Fig. 10c) and lnqe vs. ε2.
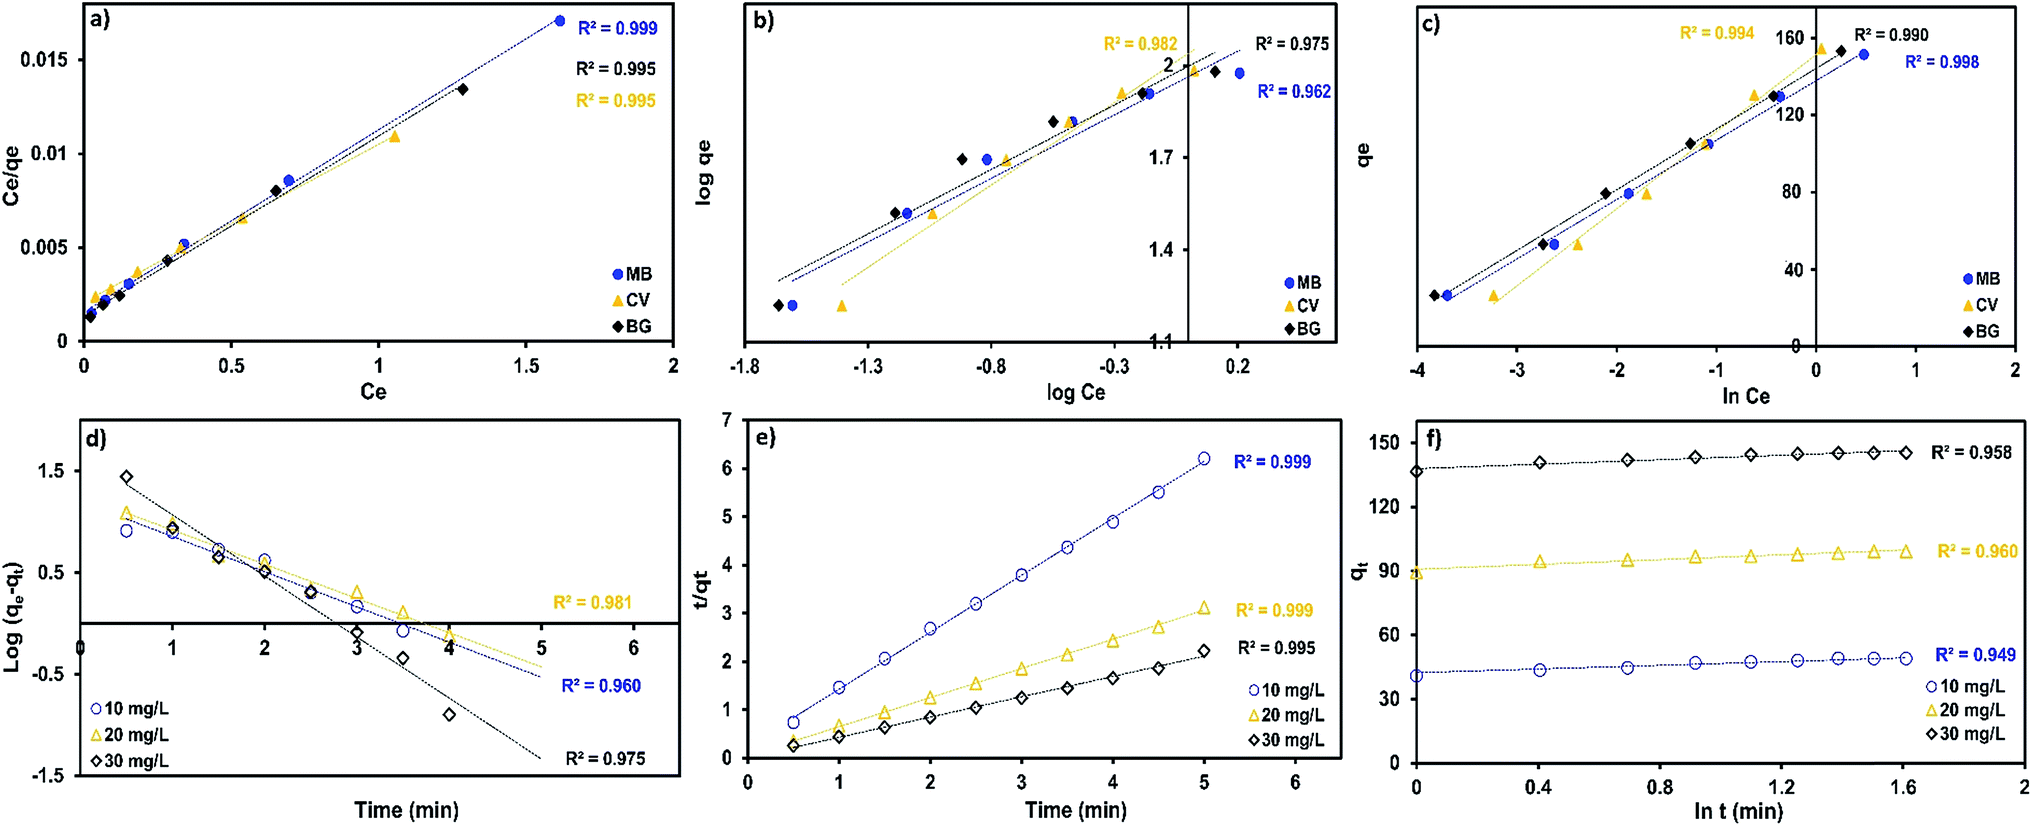 | ||
| Fig. 10 Data obtained for dye adsorption on MnO2-NP-AC at different initial concentrations of dyes used to determine the isotherm parameters: (a) Langmuir, (b) Freundlich and (c) Temkin (C0 = 5–30 mg L−1, adsorbent dosage = 0.01 g, sonication time = 4 min, pH = 7.0), (d) pseudo-first order, (e) pseudo-second-order kinetic and (f) Elovich plots for CV adsorption on MnO2-NP-AC. | ||
The outcome values of parameters Qm, KL, KF, 1/n, B, KT, Qs, β, E and R2 for all the experiments for the removal of dyes are presented in Table 7.
A comparison of correlation co-efficients (R2) of the linearized form of the three isotherm models indicates that the Langmuir model (see Fig. 10a) yields a better fit for the experimental equilibrium adsorption data than the Freundlich, Temkin and Dubinin–Radushkevich isotherm models. The experimental data of the three dyes produced a higher value of correlation co-efficients (0.995) with the Langmuir model than from the Freundlich model (0.927–0.986), which suggests the monolayer coverage of the surface of adsorbent by dyes molecules.
The correlation co-efficient (R2) and non-linear chi-square test (χ2) were obtained and shown in Table 7. It was found that the smallest χ2 and highest R2 values for the Langmuir isotherm among the applied models confirm the high efficiency of the Langmuir isotherm to represent the experimental data. In other words, the Langmuir isotherm is the most applicable model.
The results were also fitted by the Temkin model (see Table 7), which suggested a reduction in the heat of adsorption along with coverage due to sorbent–adsorbate interactions. As a result, adsorption of dyes could be characterized by a uniform distribution of binding energies up to the maximum value.
The free energy of dye adsorption was determined via the Dubinin–Radushkevich (D–R) model. As can be seen from Table 7, the experimental results were fitted by the D–R model with a relatively good correlation co-efficient (0.90–0.98). The values of the calculated mean energy (E) of adsorption for all three dyes were less than 8 kJ mol−1. The increase in E value with an increase in the adsorbent mass shows a higher tendency of the dye molecule for adsorption onto the adsorbent surface.
3.8. Kinetics
Several kinetic models are available in the literature to describe the mechanism of solute adsorption onto an adsorbent. In this study, the adsorption of the three selected dyes onto MnO2-NP-AC was investigated by the pseudo first-order,46 pseudo second-order,47 intraparticle diffusion,48 and Elovich49 to find the most suitable model describing the kinetics of the adsorption process.The linear form of the pseudo first-order rate expression of Lagergren46 can be written as follows:
 | (14) |
The pseudo second-order model can be expressed in the following linear form:47
 | (15) |
The intraparticle diffusion equation is given as follows:48
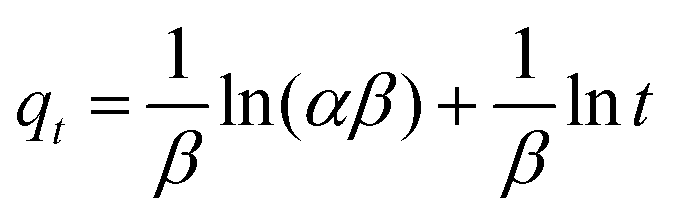
| qt = Kdift1/2 + C | (16) |
The Elovich kinetic model49 is described by eqn (17):
 | (17) |
Table 8 lists the values of the rate constants of the four kinetic models tested in this study, namely, the pseudo first-order, pseudo second-order, intraparticle diffusion and Elovich models, along with their respective R2 and χ2 values that were estimated by linear fitting of experimental data collected at various times.
| Model | Parameters | Value of parameters | ||||||||
|---|---|---|---|---|---|---|---|---|---|---|
| CV | BG | MB | ||||||||
| Concentration (mg L−1) | ||||||||||
| 10 | 20 | 30 | 10 | 20 | 30 | 10 | 20 | 30 | ||
| Pseudo-first-order-kinetic | k1 (min−1) | 0.0134 | 0.0129 | 0.0230 | 0.0145 | 0.0124 | 0.0128 | 0.0163 | 0.0239 | 0.0242 |
| qe (calc.) (mg g−1) | 15.977 | 18.093 | 46.830 | 11.855 | 16.807 | 18.634 | 7.888 | 30.960 | 31.320 | |
| R2 | 0.960 | 0.981 | 0.975 | 0.968 | 0.977 | 0.818 | 0.977 | 0.876 | 0.970 | |
| χ2 | 2.5510 | 1.7113 | 0.9721 | 1.5913 | 1.6527 | 2.9861 | 0.8546 | 1.6639 | 0.7212 | |
| Pseudo-second-order-kinetic | k2 (min−1) | 0.0015 | 0.0015 | 0.0014 | 0.0111 | 0.0016 | 0.0003 | 0.0044 | 0.0022 | 0.0021 |
| qe (calc.) (mg g−1) | 51.282 | 101.01 | 149.25 | 48.544 | 93.340 | 135.14 | 50.080 | 98.039 | 140.85 | |
| R2 | 0.999 | 0.999 | 0.996 | 0.999 | 0.999 | 0.999 | 0.999 | 0.999 | 0.999 | |
| χ2 | 0.01392 | 0.0075 | 0.0120 | 0.0094 | 0.0132 | 0.0203 | 0.0044 | 0.0088 | 0.0067 | |
| Intraparticle diffusion | Kdif (mg g−1 min−1/2) | 0.807 | 1.018 | 1.790 | 0.557 | 0.918 | 0.674 | 0.412 | 0.843 | 0.600 |
| C (mg g−1) | 35.950 | 82.841 | 118.45 | 38.335 | 77.477 | 122.98 | 42.922 | 83.274 | 130.43 | |
| R2 | 0.943 | 0.902 | 0.661 | 0.900 | 0.926 | 0.950 | 0.810 | 0.730 | 0.834 | |
| χ2 | 0.37652 | 0.4079 | 1.3309 | 0.2236 | 0.3314 | 0.8511 | 0.3462 | 1.0440 | 0.7058 | |
| Elovich | β (mg g−1 min−1) | 0.233 | 0.239 | 0.253 | 0.332 | 0.293 | 0.295 | 0.430 | 0.489 | 0.310 |
| α (g mg−1) | 134.66 | 412.70 | 630.91 | 127.63 | 335.12 | 521.68 | 139.37 | 283.27 | 536.18 | |
| R2 | 0.949 | 0.960 | 0.958 | 0.980 | 0.992 | 0.973 | 0.920 | 0.942 | 0.931 | |
| χ2 | 0.34107 | 0.6144 | 0.5789 | 0.1391 | 0.1001 | 0.4136 | 0.2281 | 0.7522 | 0.6337 | |
| Experimental data | qe (exp) (mg g−1) | 48.90 | 99.09 | 145.26 | 47.22 | 92.30 | 133.40 | 49.32 | 96.22 | 139.10 |
The correlation co-efficient (R2) values for the pseudo-second order rate equation (0.996–0.999 for CV, 0.999 for BG and 0.999 for MB) were found to be higher than those for pseudo-first order rate equation (0.960–0.977 for CV, 0.818–0.977 for BG and 0.876–0.977 for MB). The qe(exp) values (48.90–145.26 mg g−1 for CV, 47.22–133.40 mg g−1 for BG and 49.32–139.10 mg g−1 for MB) were in close agreement with qe(calc) (51.28–149.25 mg g−1 for CV, 48.544–135.14 mg g−1 for BG and 50.08–140.85 mg g−1 for MB) for the pseudo-second order model.
It was observed that the intraparticle diffusion model was inappropriate to describe the adsorption kinetics, whereas the Elovich model was best to represent the adsorption of dyes onto MnO2-NP-AC (R2 = 0.920–0.992). The pseudo second-order model exhibited the best fit (R2 > 0.995 for all sets of runs).
3.9. Comparison of RSM and ANN
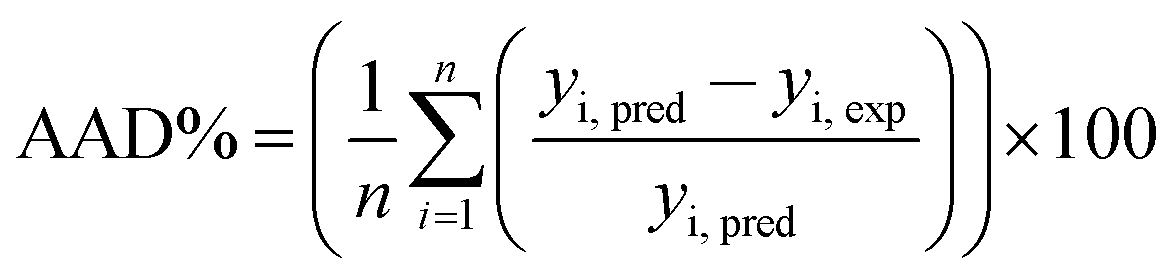
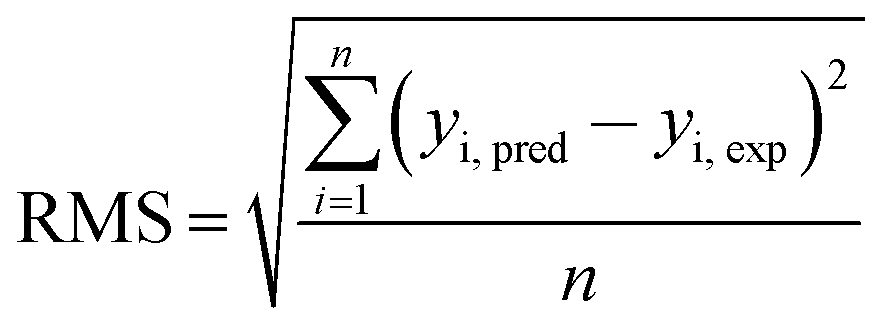
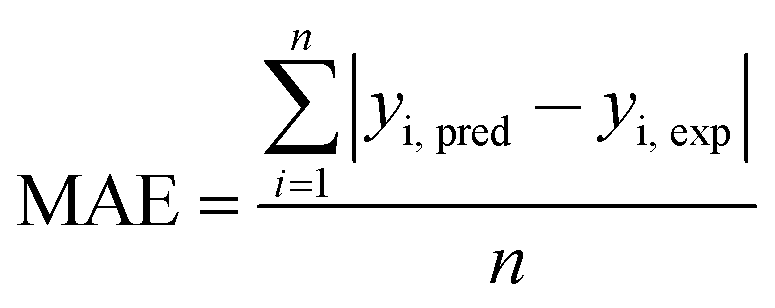
Judgment of the usefulness of ANN and RSM models is based on the criteria such as the absolute average deviation (AAD), mean squared error (RMS), mean absolute error (MAE) and the correlation co-efficient (R2) calculated by eqn (18)–(21), respectively:50
 | (18) |
 | (19) |
 | (20) |
 | (21) |
| Optimization runs for the RSM and ANN models | |||||||||||||||||||||
|---|---|---|---|---|---|---|---|---|---|---|---|---|---|---|---|---|---|---|---|---|---|
| Run | Factors | Experimental values | RSM predicted | ANN predicted | Absolute error | ||||||||||||||||
| RSM | ANN | ||||||||||||||||||||
| X1 | X2 | X3 | X4 | X5 | X6 | %RMB | %RBG | %RCV | %RMB | %RBG | %RCV | %RMB | %RBG | %RCV | MB | BG | CV | MB | BG | CV | |
| 1 | 7.0 | 0.022 | 4.0 | 6.0 | 6.0 | 6.0 | 96.64 | 99.40 | 95.15 | 100.74 | 101.21 | 97.86 | 99.78 | 100.68 | 96.76 | 4.10 | 1.81 | 2.71 | 0.38 | 1.28 | 1.61 |
| 2 | 7.0 | 0.022 | 4.0 | 6.0 | 6.0 | 6.0 | 97.86 | 98.87 | 94.70 | 100.74 | 101.21 | 97.86 | 99.78 | 100.68 | 96.76 | 2.88 | 2.34 | 3.16 | 0.91 | 1.81 | 2.06 |
| 3 | 7.0 | 0.022 | 4.0 | 6.0 | 6.0 | 6.0 | 99.43 | 96.30 | 96.62 | 100.74 | 101.21 | 97.86 | 99.78 | 100.68 | 96.76 | 1.31 | 4.91 | 1.24 | 3.48 | 4.38 | 0.14 |
| 4 | 7.0 | 0.022 | 4.0 | 6.0 | 6.0 | 6.0 | 98.35 | 97.53 | 97.90 | 100.74 | 101.21 | 97.86 | 99.78 | 100.68 | 96.76 | 2.39 | 3.68 | −0.04 | 2.25 | 3.15 | −1.14 |
| 5 | 7.0 | 0.022 | 4.0 | 6.0 | 6.0 | 6.0 | 99.12 | 95.41 | 96.23 | 100.74 | 101.21 | 97.86 | 99.78 | 100.68 | 96.76 | 1.62 | 5.80 | 1.63 | 4.37 | 5.27 | 0.53 |
| 6 | 7.0 | 0.022 | 4.0 | 6.0 | 6.0 | 6.0 | 97.98 | 98.72 | 92.77 | 100.74 | 101.21 | 97.86 | 99.78 | 100.68 | 96.76 | 2.76 | 2.49 | 5.09 | 1.06 | 1.96 | 3.99 |
| Average | 98.23 | 97.71 | 95.56 | 100.74 | 101.21 | 97.86 | 99.78 | 100.68 | 96.76 | 2.51 | 3.50 | 2.30 | 2.08 | 2.98 | 1.20 | ||||||
|
|||||||||||||||||||||
| RSM and ANN predictions for the totally unseen data | |||||||||||||||||||||
| 1 | 4.3 | 0.015 | 2.5 | 6.9 | 7.6 | 6.0 | 87.50 | 88.21 | 81.61 | 89.80 | 89.80 | 83.22 | 88.98 | 88.72 | 82.02 | 2.3 | 1.59 | 1.61 | 1.48 | 0.51 | 0.41 |
| 2 | 7.9 | 0.028 | 3.7 | 7.8 | 4.5 | 7.8 | 94.62 | 93.25 | 98.10 | 96.10 | 95.30 | 99.80 | 95.85 | 94.76 | 99.43 | 1.48 | 2.05 | 1.7 | 1.23 | 1.51 | 1.33 |
| 3 | 5.2 | 0.027 | 5.0 | 6.0 | 7.0 | 6.0 | 89.76 | 93.70 | 88.32 | 91.70 | 96.40 | 90.00 | 90.65 | 95.32 | 89.67 | 1.94 | 2.7 | 1.68 | 0.89 | 1.62 | 1.35 |
| 4 | 9.0 | 0.023 | 5.1 | 6.4 | 6.1 | 4.7 | 96.33 | 95.11 | 97.87 | 99.10 | 96.40 | 99.90 | 98.23 | 98.12 | 96.25 | 2.77 | 1.29 | 2.03 | 1.9 | 3.01 | −1.62 |
| 5 | 7.6 | 0.020 | 5.7 | 6.2 | 6.6 | 4.2 | 99.12 | 96.34 | 93.67 | 98.20 | 99.80 | 96.00 | 99.67 | 98.20 | 94.11 | −0.92 | 3.46 | 2.33 | 0.55 | 1.86 | 0.44 |
| 6 | 6.5 | 0.018 | 4.8 | 4.0 | 6.7 | 4.4 | 98.25 | 96.21 | 97.42 | 99.40 | 99.50 | 98.90 | 98.90 | 98.34 | 96.50 | 1.15 | 3.29 | 1.48 | 0.65 | 2.13 | −0.92 |
| 7 | 8.7 | 0.010 | 5.3 | 7.7 | 7.6 | 5.2 | 72.24 | 83.24 | 82.68 | 75.60 | 85.48 | 81.66 | 74.32 | 83.78 | 84.34 | 3.36 | 2.24 | −1.02 | 2.08 | 0.54 | 1.66 |
| 8 | 4.4 | 0.020 | 1.5 | 4.8 | 4.0 | 7.9 | 83.78 | 76.34 | 75.21 | 85.68 | 78.17 | 77.02 | 84.25 | 77.42 | 77.49 | 1.9 | 1.83 | 1.81 | 0.47 | 1.08 | 2.28 |
| 9 | 4.3 | 0.020 | 2.0 | 2.4 | 4.1 | 10.6 | 79.31 | 77.11 | 59.42 | 81.13 | 78.40 | 62.3 | 81.12 | 78.54 | 61.23 | 1.82 | 1.29 | 2.88 | 1.81 | 1.43 | 1.81 |
| 10 | 6.0 | 0.013 | 6.8 | 11.5 | 4.1 | 3.3 | 55.43 | 70.98 | 75.01 | 60.21 | 73.91 | 77.85 | 58.87 | 72.43 | 76.49 | 4.78 | 2.93 | 2.84 | 3.44 | 1.45 | 1.48 |
| 2.06 | 2.27 | 1.73 | 1.45 | 1.51 | 0.82 | ||||||||||||||||
| Appraisal of the ANN and RSM models | R | R2 | AAD | MAE | RMS | ||||||||||
|---|---|---|---|---|---|---|---|---|---|---|---|---|---|---|---|
| Response | MB | BG | CV | MB | BG | CV | MB | BG | CV | MB | BG | CV | MB | BG | CV |
| RSM (n = 10 runs) | 0.9975 | 0.9968 | 0.9964 | 0.9951 | 0.9937 | 0.9928 | 2.608 | 2.541 | 2.083 | 0.0341 | 0.0267 | 0.0253 | 0.0280 | 0.0254 | 0.0233 |
| ANN (n = 10 runs) | 0.9991 | 0.9978 | 0.9969 | 0.9983 | 0.9957 | 0.9938 | 1.850 | 1.686 | 1.098 | 0.0185 | 0.0169 | 0.0212 | 0.0239 | 0.0182 | 0.0257 |
| RSM (n = 90 runs) | 0.9985 | 0.9965 | 0.9935 | 0.9970 | 0.9930 | 0.9870 | 0.4162 | 0.5909 | 0.7601 | 0.3703 | 0.5250 | 0.6709 | 0.4388 | 0.6871 | 0.8540 |
| ANN (n = 90 runs) | 0.9965 | 0.9970 | 0.9950 | 0.9930 | 0.9940 | 0.9900 | 0.4518 | 0.4518 | 0.6202 | 0.4086 | 0.4775 | 0.5510 | 0.6315 | 0.6355 | 0.7522 |
Table 9 shows the observed and modeled results of six test experiments under the optimum conditions and ten test experiments for unseen data. This table suggested that the ANN model is not only stable and flexible, but also offer a certain degree of extrapolation outside the training data. The RSM was also applied well. However, ANN showed an overall better applicability than the RSM.
Fig. 6 indicates the comparative plot for RSM and ANN prediction for the designed experiments. The generalization capability can be best judged only with a completely unseen dataset. Therefore, it was decided to test both the models using unseen data. The experimental and predicted removal percentages are summarized in Table 9. The correlation co-efficients for the unseen data using the ANN model were obtained to be 0.9991, 0.9978 and 0.9969 for MB, BG and CV, respectively, whereas the corresponding values for the RSM model were found to be 0.9975, 0.9968 and 0.9964. The comparative values of correlation co-efficient, AAD, MAE and RMS are given in Table 9. The values of AAD for RSM were obtained to be 0.4162 for MB, 0.5909 for BG and 0.7601 for CV. The AAD for ANN were found to be 0.4518 for MB, 0.4518 for BG and 0.6202 for CV. The absolute errors for ANN and RSM models were >2% and <2%, respectively, for all dyes. MAE and RMS for the ANN model are lower than the RSM model. It was found that both the models were applicable to predict the experimental data. However, the prediction capability of the ANN model was higher than the RSM model. The upper predictive accuracy of the ANN model can be attributed to its universal capability to approximate the non-linearity of the system, whereas RSM is only restricted to the second-order polynomial.
3.10. Comparison of the presented procedure with other methods
Table 10 compares the pH, adsorption capacity (mg g−1) and contact time (min) of the different types of adsorbents used for the removal of dyes. The value of (Qmax) in this study using an environmental friendly and low cost adsorbent is significantly higher than those reported in most of the previous works.6,8,10–13,19,52–71 As seen in Table 10, the contact time for the proposed method is preferable and superior to those found in the literature. This may be associated with the homogeneous surface of MnO2-NP-AC. The rapid uptake and quick establishment of equilibrium shows the efficiency of ultrasound power in wastewater treatment. Ultrasound is a highly recommended tool to improve the mass transfer process and the affinity between adsorbate and adsorbent. The other advantage of this process is its neutral working pH.| Adsorbent | Dye | pH | Sorption capacity (mg g−1) | Contact time (min) | Ref. |
|---|---|---|---|---|---|
| Coniferous pinus bark (CPBP) | CV | 8.0 | 32.78 | 120 | 52 |
| Tomato plant root (TPR powder) | CV | 6.7 | 94.34 | 15 | 53 |
| Wood apple shell (W-as) | CV | 10.0 | 129.90 | 120 | 54 |
| Grapefruit peel (GFP) | CV | 6.0 | 254.20 | 60 | 6 |
| Wheat straw (EWS) | CV | 4.0 | 227.30 | 300 | 55 |
| Treated ginger waste (TGW) | CV | 9.5 | 277.70 | 150 | 56 |
| Palm kernel fiber (PKF) | CV | 7.2 | 78.90 | 60 | 57 |
| Soil-silver nanocomposite (soil–AgNP) | CV | 4.7 | 1.92 | 30 | 13 |
| Magnetic nanocomposite | CV | 8.50 | 113.31 | 30 | 58 |
| Magnetic calcium ferrite nanoparticle CaFe2O4 | CV | 5.0 | 10.67 | 30 | 59 |
| MnO2-NPs-AC | CV | 7.0 | 263.16 | 4.0 | This work |
| Zinc oxide nanoparticles loaded on AC | BG | 5.0 | 142.90 | 35 | 60 |
| Pine-fruit shell by chemically AC | BG | 5.5 | 219.10 | 240 | 61 |
| Pine-fruit shell by chemically and physically AC | BG | 5.5 | 263.40 | 240 | 61 |
| Surfactant modified nano-γ-alumina | BG | 4.0 | 168.59 | 50 | 62 |
| Surfactant doped polyaniline/MWCNTs composite | BG | 3.0 | 476.19 | 240 | 63 |
| Graphite oxide nanoparticle (GO-NP) | BG | 7.0 | 232.56 | 14 | 8 |
| Graphite oxide nanoparticle (GO-NP) | BG | 7.0 | 416.67 | 10 | 10 |
| Ruthenium nanoparticles-AC (Ru-NP-AC) | BG | 6.0 | 94.70 | 45 | 19 |
| MnO2-NPs-AC | BG | 7.0 | 206.20 | 4.0 | This work |
| MWCNTs filled with Fe2O3 particles | MB | 6.0 | 42.90 | 60 | 64 |
| Activated carbon (walnut shells) | MB | 7.0 | 315.00 | 1440 | 65 |
| Ag NPs-AC | MB | 2.5 | 71.43 | 15 | 66 |
| Au-NP-AC | MB | 7.0 | 185.00 | 1.6 | 67 |
| Graphene | MB | 10.0 | 153.85 | 255 | 68 |
| PDA microspheres | MB | 6.5 | 90.70 | 100 | 69 |
| Fe3O4 nanoparticles | MB | 6.0 | 89.20–91.90 | 2 | 70 |
| Humic acid-coated Fe3O4-NP (HA-Fe3O4) | MB | 8.4 | 93.08 | 27 | 11 |
| NiS-NP-AC | MB | 8.1 | 46–52 | 5.46 | 71 |
| CuO-NP-AC | MB | 7.0 | 10.55 | 15 | 12 |
| MnO2-NPs-AC | MB | 7.0 | 234.20 | 4.0 | This work |
4. Conclusions
The rapid and simultaneous ultrasound-assisted adsorption of CV, BG and MB from an aqueous solution and the effects of various parameters on the adsorption in the batch system were successfully modeled using RSM and ANN, wherein MnO2-NP-AC was used as an efficient, environmental friendly and cost-effective adsorbent. The most important conclusions from this study are summarized as follows:(1) The optimum conditions were found as follows: an initial pH of 7.0, sonication time of 4.0 min, initial dyes concentration of 6 mg L−1 and adsorbent dosage of 0.022 g. A small amount of the adsorbent (0.04 g) was capable of removing a high percentage of the dyes, i.e. 97%, 100% and 100% for CV, BG and MB, respectively.
(2) The results of the RSM and ANN methodologies based on the validation data showed that the RSM (R2 > 0.987) and ANN (R2 > 0.990) are useful and accurate methods to predict the adsorption process.
(3) The experimental equilibrium data fitting to the Langmuir, Freundlich, Temkin and Dubinin–Radushkevich models showed that the Langmuir model applies well for the evaluation and description of the actual behavior of adsorption with a high adsorption capacity in the single component system (263.16, 206.2 and 234.20 mg g−1 for CV, BG and MB, respectively).
(4) The pseudo-second-order rate model accurately described the kinetics of adsorption.
(5) MnO2-NP-AC has a high adsorption capacity when compared to other adsorbents for dye removal from an aqueous medium.
Acknowledgements
The authors express their appreciation to the Graduate School and Research Council of the Yasouj University for their financial support.References
- R. Wangpradit and P. Chitprasert, Int. Biodeterior. Biodegrad., 2014, 93, 168–176 CrossRef CAS PubMed.
- E. Forgacs, T. Cserhati and G. Oros, Environ. Int., 2004, 30, 953–971 CrossRef CAS PubMed.
- M. Ghaedi, A. Ghaedi, F. Abdi, M. Roosta, A. Vafaei and A. Asghari, Ecotoxicol. Environ. Saf., 2013, 96, 110–117 CrossRef CAS PubMed.
- A. Asfaram, M. Ghaedi, A. Goudarzi and M. Rajabi, Dalton Trans., 2015, 44, 14707–14723 RSC.
- M. Ghaedi, H. Hossainian, M. Montazerozohori, A. Shokrollahi, F. Shojaipour, M. Soylak and M. K. Purkait, Desalination, 2011, 281, 226–233 CrossRef CAS PubMed.
- A. Saeed, M. Sharif and M. Iqbal, J. Hazard. Mater., 2010, 179, 564–572 CrossRef CAS PubMed.
- Y. Lin, X. He, G. Han, Q. Tian and W. Hu, J. Environ. Sci., 2011, 23, 2055–2062 CrossRef CAS.
- N. Zeinali, M. Ghaedi and G. Shafie, J. Ind. Eng. Chem., 2014, 20, 3550–3558 CrossRef CAS PubMed.
- A. Asfaram, M. Ghaedi, S. Agarwal, I. Tyagi and V. Kumar Gupta, RSC Adv., 2015, 5, 18438–18450 RSC.
- M. Ghaedi, N. Zeinali, A. M. Ghaedi, M. Teimuori and J. Tashkhourian, Spectrochim. Acta, Part A, 2014, 125, 264–277 CrossRef CAS PubMed.
- X. Zhang, P. Zhang, Z. Wu, L. Zhang, G. Zeng and C. Zhou, Colloids Surf., A, 2013, 435, 85–90 CrossRef CAS PubMed.
- M. Ghaedi, A. Ghaedi, M. Hossainpour, A. Ansari, M. Habibi and A. Asghari, J. Ind. Eng. Chem., 2014, 20, 1641–1649 CrossRef CAS PubMed.
- M. K. Satapathy and P. Das, J. Environ. Chem. Eng., 2014, 2, 708–714 CrossRef CAS PubMed.
- D. Morshedi, Z. Mohammadi, M. M. A. Boojar and F. Aliakbari, Colloids Surf., B, 2013, 112, 245–254 CrossRef CAS PubMed.
- Z. Yang, H. Yang, Z. Jiang, T. Cai, H. Li, H. Li, A. Li and R. Cheng, J. Hazard. Mater., 2013, 254, 36–45 CrossRef PubMed.
- F. Gulshan, S. Yanagida, Y. Kameshima, T. Isobe, A. Nakajima and K. Okada, Water Res., 2010, 44, 2876–2884 CrossRef CAS PubMed.
- S. Raghu, C. W. Lee, S. Chellammal, S. Palanichamy and C. A. Basha, J. Hazard. Mater., 2009, 171, 748–754 CrossRef CAS PubMed.
- M. Bagheri, H. Younesi, S. Hajati and S. M. Borghei, Int. J. Biol. Macromol., 2015, 80, 431–444 CrossRef CAS PubMed.
- S. Hajati, M. Ghaedi, B. Barazesh, F. Karimi, R. Sahraei, A. Daneshfar and A. Asghari, J. Ind. Eng. Chem., 2014, 20, 2421–2427 CrossRef CAS PubMed.
- F. Nasiri azad, M. Ghaedi, K. Dashtian, M. Montazerozohori, S. Hajati and E. Alipanahpour, RSC Adv., 2015, 5, 61060–61069 RSC.
- M. Roosta, M. Ghaedi, A. Daneshfar, R. Sahraei and A. Asghari, J. Ind. Eng. Chem., 2015, 21, 459–469 CAS.
- A. R. Bagheri, M. Ghaedi, S. Hajati, A. M. Ghaedi, A. Goudarzi and A. Asfaram, RSC Adv., 2015, 5, 59335–59343 RSC.
- M. Ghaedi, A. Ansari, F. Bahari, A. M. Ghaedi and A. Vafaei, Spectrochim. Acta, Part A, 2015, 137, 1004–1015 CrossRef CAS PubMed.
- M. Khajeh, M. Kaykhaii and A. Sharafi, J. Ind. Eng. Chem., 2013, 19, 1624–1630 CrossRef CAS PubMed.
- S. Hajati, S. Tougaard, J. Walton and N. Fairley, Surf. Sci., 2008, 602, 3064–3070 CrossRef CAS PubMed.
- J. Zolgharnein and A. Shahmoradi, J. Chem. Eng. Data, 2010, 55, 3428–3437 CrossRef CAS.
- M. Maghsoudi, M. Ghaedi, A. Zinali, A. M. Ghaedi and M. H. Habibi, Spectrochim. Acta, Part A, 2015, 134, 1–9 CrossRef CAS PubMed.
- M. Ghaedi, E. Alam Barakat, A. Asfaram, B. Mirtamizdoust, A. A. Bazrafshan and S. Hajati, RSC Adv., 2015, 5, 42376–42387 RSC.
- M. Jamshidi, M. Ghaedi, K. Dashtian, S. Hajati and A. A. Bazrafshan, RSC Adv., 2015, 5, 59522–59532 RSC.
- M. Ghaedi, S. Y. S. Jaberi, S. Hajati, M. Montazerozohori, A. Asfaram and M. Zare, IEEE Sens. J., 2015, 15, 2974–2983 CrossRef CAS.
- S. Hajati, M. Ghaedi and S. Yaghoubi, J. Ind. Eng. Chem., 2015, 21, 760–767 CrossRef CAS PubMed.
- M. Ghaedi, H. Mazaheri, S. Khodadoust, S. Hajati and M. K. Purkait, Spectrochim. Acta, Part A, 2015, 135, 479–490 CrossRef CAS PubMed.
- A. Asfaram, M. Ghaedi, S. Hajati, A. Goudarzi and A. A. Bazrafshan, Spectrochim. Acta, Part A, 2015, 145, 203–212 CrossRef CAS PubMed.
- M. Ghaedi, S. Hajati, M. Zare, M. Zare and S. Y. Shajaripour Jaberi, RSC Adv., 2015, 5, 38939–38947 RSC.
- S. Hajati, M. Ghaedi, Z. Mahmoudi and R. Sahraei, Spectrochim. Acta, Part A, 2015, 150, 1002–1012 CrossRef CAS PubMed.
- X. Chu and H. Zhang, Mod. Appl. Sci., 2009, 3, P177 Search PubMed.
- D. Jaganyi, M. Altaf and I. Wekesa, Appl. Nanosci., 2013, 3, 329–333 CrossRef CAS.
- Y. C. Zhang, T. Qiao, X. Y. Hu and W. D. Zhou, J. Cryst. Growth, 2005, 280, 652–657 CrossRef CAS PubMed.
- X. Guan and H. Yao, Food Chem., 2008, 106, 345–351 CrossRef CAS PubMed.
- S. Elemen, E. P. A. Kumbasar and S. Yapar, Dyes Pigm., 2012, 95, 102–111 CrossRef CAS PubMed.
- R. Jain and M. Shrivastava, J. Hazard. Mater., 2008, 152, 216–220 CrossRef CAS PubMed.
- I. Langmuir, J. Am. Chem. Soc., 1916, 38, 2221–2295 CrossRef CAS.
- H. Freundlich, Z. Phys. Chem., 1906, 57, 385–471 CAS.
- M. Temkin and V. Pyzhev, Acta Physicochim. URSS, 1940, 12, 217–222 Search PubMed.
- M. Dubinin and L. Radushkevich, Chem. Zentralbl., 1947, 1, 875–889 Search PubMed.
- S. Lagergren, K. Sven. Vetenskapsakad. Handl., 1898, 24, 1–39 Search PubMed.
- Y.-S. Ho and G. McKay, Process Biochem., 1999, 34, 451–465 CrossRef CAS.
- E. Daneshvar, M. Kousha, M. S. Sohrabi, A. Khataee and A. Converti, Chem. Eng. J., 2012, 195, 297–306 CrossRef PubMed.
- C. A. Başar, J. Hazard. Mater., 2006, 135, 232–241 CrossRef PubMed.
- M. Antonopoulou, V. Papadopoulos and I. Konstantinou, J. Chem. Technol. Biotechnol., 2012, 87, 1385–1395 CrossRef CAS PubMed.
- E. Betiku and A. E. Taiwo, Renewable Energy, 2015, 74, 87–94 CrossRef CAS PubMed.
- R. Ahmad, J. Hazard. Mater., 2009, 171, 767–773 CrossRef CAS PubMed.
- C. Kannan, N. Buvaneswari and T. Palvannan, J. Hazard. Mater., 2009, 249, 1132–1138 CAS.
- X. S. Wang, X. Liu, L. Wen, Y. Zhou, Y. Jiang and Z. Li, Sep. Sci. Technol., 2008, 43, 3712–3731 CrossRef CAS PubMed.
- R. Gong, S. Zhu, D. Zhang, J. Chen, S. Ni and R. Guan, Desalination, 2008, 230, 220–228 CrossRef CAS PubMed.
- R. Kumar and R. Ahmad, Desalination, 2011, 265, 112–118 CrossRef CAS PubMed.
- G. O. El-Sayed, Desalination, 2011, 272, 225–232 CrossRef CAS PubMed.
- K. P. Singh, S. Gupta, A. K. Singh and S. Sinha, J. Hazard. Mater., 2011, 186, 1462–1473 CrossRef CAS PubMed.
- S. An, X. Liu, L. Yang and L. Zhang, Chem. Eng. Res. Des., 2015, 94, 726–735 CrossRef CAS PubMed.
- M. Ghaedi, G. Negintaji, H. Karimi and F. Marahel, J. Ind. Eng. Chem., 2014, 20, 1444–1452 CrossRef CAS PubMed.
- T. Calvete, E. C. Lima, N. F. Cardoso, S. L. Dias and E. S. Ribeiro, Clean: Soil, Air, Water, 2010, 38, 521–532 CrossRef CAS PubMed.
- J. Zolgharnein, M. Bagtash and T. Shariatmanesh, Spectrochim. Acta, Part A, 2015, 137, 1016–1028 CrossRef CAS PubMed.
- R. Kumar, M. O. Ansari and M. Barakat, Ind. Eng. Chem. Res., 2014, 53, 7167–7175 CrossRef CAS.
- S. Qu, F. Huang, S. Yu, G. Chen and J. Kong, J. Hazard. Mater., 2008, 160, 643–647 CrossRef CAS PubMed.
- J. Yang and K. Qiu, Chem. Eng. J., 2010, 165, 209–217 CrossRef CAS PubMed.
- M. Ghaedi, S. Heidarpour, S. Nasiri Kokhdan, R. Sahraie, A. Daneshfar and B. Brazesh, Powder Technol., 2012, 228, 18–25 CrossRef CAS PubMed.
- M. Roosta, M. Ghaedi, A. Daneshfar, R. Sahraei and A. Asghari, Ultrason. Sonochem., 2014, 21, 242–252 CrossRef CAS PubMed.
- T. Liu, Y. Li, Q. Du, J. Sun, Y. Jiao, G. Yang, Z. Wang, Y. Xia, W. Zhang and K. Wang, Colloids Surf., B, 2012, 90, 197–203 CrossRef CAS PubMed.
- J. Fu, Z. Chen, M. Wang, S. Liu, J. Zhang, J. Zhang, R. Han and Q. Xu, Chem. Eng. J., 2015, 259, 53–61 CrossRef CAS PubMed.
- M. Ghaedi, S. Hajjati, Z. Mahmudi, I. Tyagi, S. Agarwal, A. Maity and V. Gupta, Chem. Eng. J., 2015, 268, 28–37 CrossRef CAS PubMed.
- M. Ghaedi, M. Pakniat, Z. Mahmoudi, S. Hajati, R. Sahraei and A. Daneshfar, Spectrochim. Acta, Part A, 2014, 123, 402–409 CrossRef CAS PubMed.
| This journal is © The Royal Society of Chemistry 2015 |