
Bouquet-like calcium sulfate dihydrate: a highly efficient adsorbent for Congo red dye†
Xin-Jian Jia,
Jinshu Wang*,
Junshu Wu,
Yucheng Du,
Bingxin Zhao and
Daniel den Engelsen
Key Laboratory of Advanced Functional Materials of Ministry of Education, College of Materials Science and Engineering, Beijing University of Technology, Beijing 100124, China. E-mail: wangjshu@bjut.edu.cn; Fax: +86-10-67391101; Tel: +86-10-67391101
First published on 18th August 2015
Abstract
A unique bouquet-like calcium sulfate dihydrate (BCSD) was successfully synthesized from calcium chloride and aluminum potassium sulfate in aqueous sodium carboxymethyl cellulose (CMC) solution by means of a metathesis reaction. The morphology and structure of BCSD were characterized by scanning electron microscopy, powder X-ray diffraction and transmission electron microscopy. The adsorption of different organic dyes from aqueous solutions onto the as-synthesized BCSD was then investigated, taking into account the influences of adsorbent dose (1.0–3.5 g L−1), solution pH (5.0–12.0) and adsorption time. The results indicated that the temperature and agitation rate had no effect on the morphology of the samples. With the increase of CMC concentration from 0.10% to 0.50%, lamellar calcium sulfate dihydrate (LCSD) gradually transformed into rod-like calcium sulfate dihydrate (RCSD), and eventually generated BCSD. The as-prepared BCSD was monoclinic with preferential [021] and [041] orientations. Moreover, BCSD selectively adsorbed Congo red (CR) instead of rhodamine B and methyl orange. The adsorption equilibrium process of CR was an exothermic process and could adequately be described by the Langmuir isotherm model. The calculated maximum adsorption quantity (qmax) was 1224.09 mg g−1 at 303.5 K, which was almost 12 times larger than that onto LCSD (100.80 mg g−1). Additionally, the adsorption process of CR was a multi-step process, and the adsorption kinetics could be described in terms of a pseudo-second-order model. From attenuated total reflectance Fourier transform infrared spectroscopy and X-ray photoelectron spectroscopy studies it was concluded that CR was chemisorbed on BCSD. These results indicate that BCSD is a promising candidate in wastewater treatment.
1. Introduction
Recently, the fabrication and properties of inorganic functional materials possessing novel structures and morphologies have attracted considerable attention,1 because of their special purposes in the fields of catalysis,2 optoelectronics,3,4 medicine,5 CO2 capture,6 gas sensing,7 and wastewater treatment.8 Therefore, the modification of inorganic compounds has become a hot topic in academic and industrial research.With the development of industry, various dyestuffs are applied in textile, paper, food, pharmaceutical, plastics, and cosmetics industries.9 Approximately 70 billion tons of dye effluents are annually discharged to the environment.10 The vast majority of dyestuffs are organic compounds that have high chemical stability and are as a rule toxic to aquatic organisms as well as human beings in some cases. Therefore, it is necessary to take some purification measures before sewage discharge. Various chemical, physical and biological technologies are applied in the treatment of dye removal, such as flocculation, membrane filtration, chemical oxidation, photocatalysis and biodegradation,11 however, adsorption is regarded as one of the best methods due to its simplicity.12,13 Nevertheless, the application of large quantities of adsorbents is still restricted because of low removal efficiency, high material cost and complicated preparation process. Because of increasingly serious environmental problems induced by organic dyes, synthesizing more practical adsorbents and exploring the adsorption mechanisms are becoming urgent.
Calcium sulfate dihydrate (CSD), also known as gypsum, is one of the most common natural products and industrial by-products.14 As a traditional cement-like material, gypsum and its subhydrates display extremely strong morphology-dependent properties, and have been widely utilized as construction material, inorganic filler, food additive, medical material, and bone graft substitute.15,16 There are also publications related to sewage treatment, in which gypsum acts as a skeleton builder in sludge dewatering.17,18 Most publications in this field refer to composites of gypsum with other materials and there are only a few reports on dye adsorption onto pure gypsum with granular and tabular morphology.19,20 Furthermore, the synthesis of pure gypsum with other morphology and its adsorption behavior have seldom been reported.
In this paper, we describe the synthesis of a novel bouquet-like calcium sulfate dihydrate (BCSD) structure through a metathesis reaction of calcium chloride and aluminum potassium sulfate in an aqueous sodium carboxymethyl cellulose (CMC) solution. The morphology and structure of BCSD were characterized, and its adsorption capacity for organic dyes in aqueous solution was investigated. Congo red (CR), as a known human carcinogen, is widely used in textile and plastics industries, and commonly selected as a model pollutant.21 The effects of adsorbent dose, solution pH and temperature on the adsorption of CR onto BCSD were then studied. In addition, the results of the adsorption measurements were analyzed in terms of adsorption isotherms and kinetic models in quite some detail. The mechanism of the adsorption process was further explored.
2. Experimental
2.1. Chemicals
Analytical grade calcium chloride (CaCl2), aluminum potassium sulfate (KAl(SO4)2·12H2O) and CMC were obtained from Beijing Chemical Works (Beijing, China), and utilized to prepare BCSD without further treatment. Analytical grade CR, rhodamine B (RB) and methyl orange (MO) were purchased from Aladdin Chemistry Co. Ltd (Shanghai, China). All solutions were prepared from deionized water with a resistivity of 18 MΩ cm.2.2. Synthesis of BCSD
The samples were synthesized as follows: firstly, the CMC solutions of various mass concentrations were prepared in deionized water using ultrasonic cavitation. Subsequently, 8.0 mmol (887.9 mg) CaCl2 was dissolved into 20 mL of CMC solution, and then 4.0 mmol (1897.5 mg) KAl(SO4)2·12H2O was added with continuous stirring at 50 °C. The mixture was agitating until a white precipitate appeared. Finally, the product was filtered, washed successively with deionized water and anhydrous ethanol (three times), and then dried in an oven at 60 °C for 12 h.2.3. Characterization
The morphology of the samples was investigated by scanning electron microscope (SEM, Hitachi S-4800). The crystal structure and phase of the samples were characterized by powder X-ray diffraction (XRD, Shimadzu XRD-7000) with Cu-Kα radiation (λ = 1.54056 Å) at room temperature. The accelerating voltage was set at 40 kV with 30 mA emission current. The growth orientations were determined with a transmission electron microscope (TEM, FEI Tecnai) combined with selected area electron diffraction (SAED) at an acceleration voltage of 300 kV. The specific surface areas were derived from N2 adsorption–desorption isotherms measured with a Brunauer–Emmett–Teller apparatus (BET, Micromeritics ASAP2020) at 77 K. The surface compositions and chemical states were characterized by X-ray photoelectron spectroscopy (XPS, Thermo Fisher K-Alpha) equipped with a monochromatic Al Kα X-ray source (hν = 1486.6 eV). Survey spectra were recorded with pass energy of 200.0 eV and step size of 1.000 eV. High-resolution spectra were measured with pass energy of 50.0 eV and step size of 0.100 eV. The functional groups were analyzed with an attenuated total reflectance Fourier transform infrared spectrometer (ATR-FT-IR, Bruker TENSOR27) in the range from 4000 to 400 cm−1 at a resolution of 4 cm−1. The concentrations of CR, RB, and MO in the supernatant were evaluated from the absorbance measured with a UV/visible spectrophotometer (UV/vis, Shimadzu UV-2550) at 498 nm, 554 nm, and 464 nm, respectively.2.4. Adsorption experiments
The selective adsorption tests of BCSD with different organic dyes were conducted by adding 40 mg sample into 20 mL of dye solution with a concentration of 100 mg L−1. In order to investigate the effects of adsorbent dose and solution pH on adsorption efficacy, the dosages were changed from 1.0 to 3.5 g L−1, and the pH, adjusted with 0.1 M HCl and 0.1 M NaOH, was varied from 5.0 to 12.0. The adsorption equilibrium processes were studied in the CR solutions with concentrations ranging from 100 to 4000 mg g−1. The contact times were controlled in the range of 0 to 10 h. At predetermined points in time, 10 mL of the suspension was extracted and centrifuged at 10![[thin space (1/6-em)]](https://www.rsc.org/images/entities/char_2009.gif) 000 rpm for 5 min. The concentrations of supernatant were measured by UV/vis spectrometry. All experiments were carried out in batch mode at 303.5 K and performed three times unless otherwise specified.
000 rpm for 5 min. The concentrations of supernatant were measured by UV/vis spectrometry. All experiments were carried out in batch mode at 303.5 K and performed three times unless otherwise specified.
The removal efficiency (Re), adsorption capacity at equilibrium (qe, mg g−1) and adsorption quantity at time t (qt, mg g−1) of dye onto BCSD were evaluated according to eqn (S1)–(S3) (ESI†),10,13 where the corresponding parameters were elaborated.
3. Results and discussion
3.1. Morphology and microstructure
The SEM images of as-prepared samples made from CaCl2 and KAl(SO4)2·12H2O in water and solutions of 0.05%, 0.10%, 0.20%, 0.30%, 0.40%, 0.50% CMC are shown in Fig. 1 and Fig. S1–S3 (ESI†). It can be seen that the concentrations of CMC have a great influence on the morphology of the samples. When the synthesis was done in water (Fig. 1a) or in a solution of 0.05% CMC (Fig. S1, ESI†), the product mainly consisted of lamellar calcium sulfate dihydrate (LCSD). By increasing the CMC concentration from 0.10% to 0.50%, LCSD gradually transformed into rod-like calcium sulfate dihydrate (RCSD, Fig. 1b and Fig. S2, ESI†), and eventually generated BCSD (Fig. 1c, Fig. S3, ESI† and Fig. 1d). Altering the reaction temperature (20–80 °C) and agitation rate (120–420 r min−1) while keeping the CMC concentrations constant, had no effect on the morphology of CSD.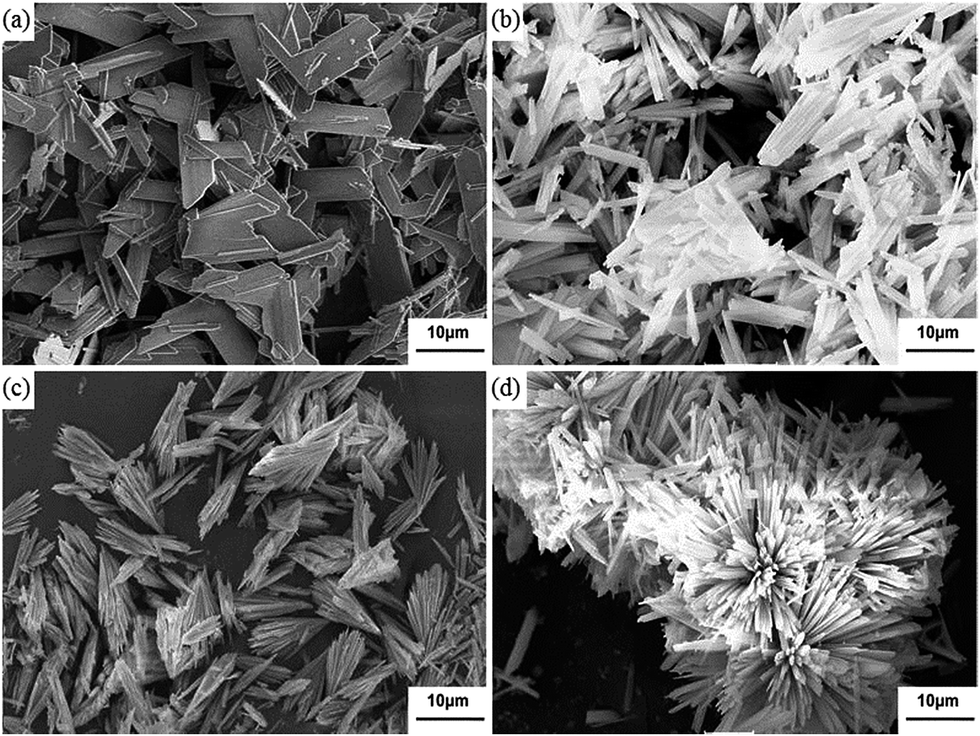 | ||
| Fig. 1 SEM images of CSD formed from CaCl2 and KAl(SO4)2·12H2O in water (a) and CMC solutions of 0.10% (b), 0.30% (c), 0.50% (d). | ||
The XRD patterns of as-obtained CSD in water and solutions with different concentrations of CMC are shown in Fig. 2, clearly indicating that the samples have high crystallinity. The positions of all diffraction peaks are consistent with those of pure CSD (space group: C2/c) as shown in JCPDS card file no. 33-0311. No impurity diffraction peaks are detected. BCSD is monoclinic with calculated lattice constants of a = 6.281 Å, b = 15.121 Å and c = 5.638 Å. Compared with the standard pattern, the relative intensity of the diffraction peak corresponding to the (020) plane is gradually decreasing with the increase of the CMC concentration, whereas those corresponding to (021) and (041) planes are increasing, which implies that BCSD has a tendency to grow preference in the [021] and [041] directions.22,23 The crystal shape anisotropy originates from the different surface energies faceted by particular crystallographic planes, which can be quantitatively scaled by the chemical bonding theory of single crystal growth.24–26 In water and CMC solutions with low concentration, CSD crystals grow along [020], [021] and [041] orientations. With the increase of CMC concentration, the adsorption of CMC molecules to the (020) plane of CSD will gradually lower the surface energy of this facet relative to the (021) and (041) planes. The crystals then tend to grow along [021] and [041] orientations, resulting in BCSD crystals.
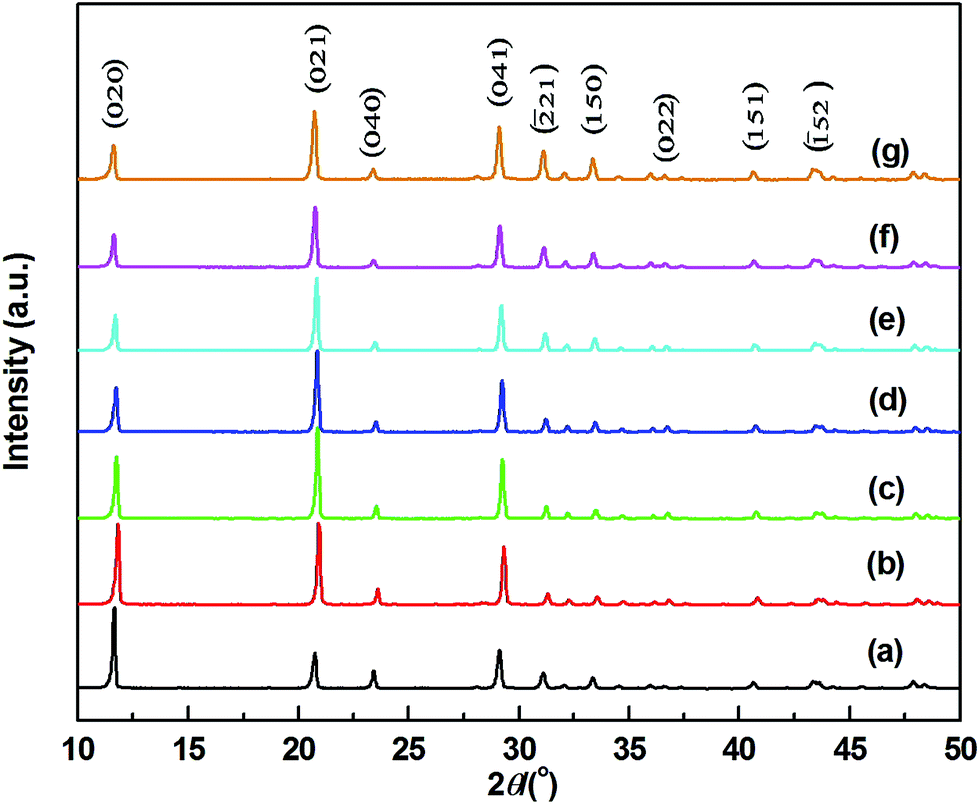 | ||
| Fig. 2 XRD patterns of as-obtained CSD formed from CaCl2 and KAl(SO4)2·12H2O in water (a) and CMC solutions of 0.05% (b), 0.1% (c), 0.2% (d), 0.3% (e), 0.4% (f) and 0.5% (g). | ||
In order to provide further evidence for these preferential growth directions, TEM and high-resolution TEM (HR-TEM) images of BCSD are shown in Fig. 3. As shown in the inset of Fig. 3a, the diffraction spots of the SAED pattern exhibit lattice distribution, indicating the single-crystalline structure of BCSD. Moreover, the clear lattice fringes reveal that BCSD has a high crystallinity (Fig. 3b). The measured d-spacings are 3.1 Å and 4.4 Å corresponding to the diffraction peaks of the [041] and [021] orientations, respectively (Fig. 3c and d). This result indicates that the (021) and (041) lattice planes are preferentially exposed to the air (and the solution),15,27 which is consistent with the results of the XRD patterns.
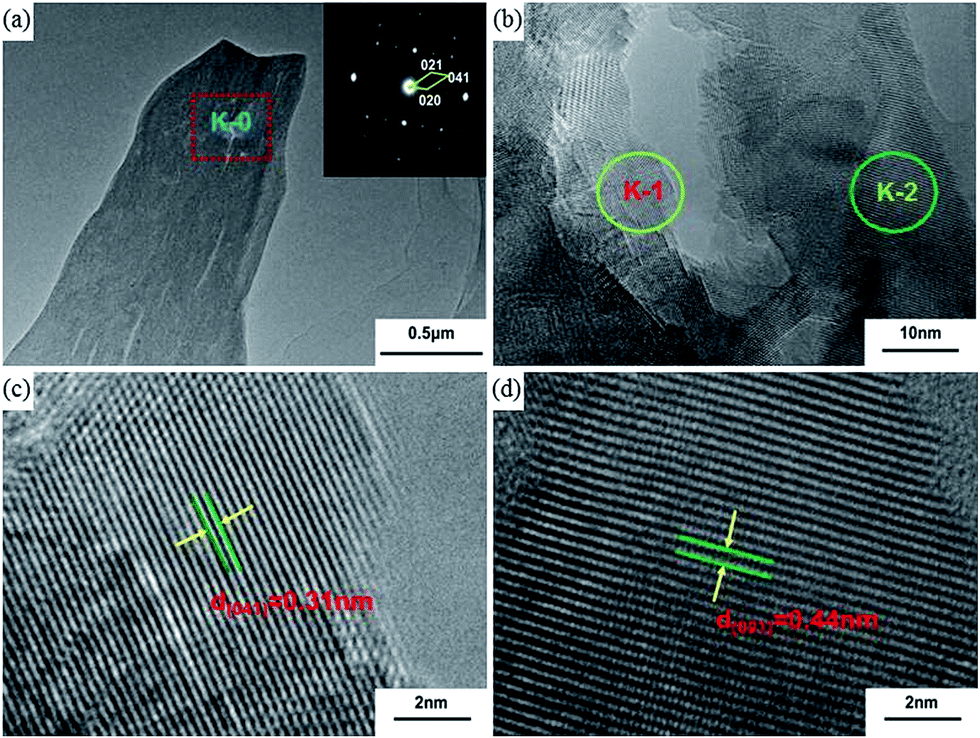 | ||
| Fig. 3 (a) TEM image of BCSD (inset: SAED pattern), (b) magnified TEM image of K-0 in (a) and HR-TEM images of selected area K-1 (c) and K-2 (d) marked in (b). | ||
3.2. Adsorption of organic dyes on BCSD
The adsorption measurements of CR, RB, and MO on BCSD in aqueous solutions were carried out at 303.5 K. Fig. 4 shows that only a very short time is needed to reach adsorption equilibrium, indicating that the removal efficiency of CR from an aqueous solution is about 98% in the initial 10 min, corresponding to a removal capacity of 49 mg g−1. Opposite to this behavior of CR, there is almost no adsorption of RB and MO. CR and MO are sulfonated anionic dyes, which belong to the class of Lewis bases, but RB is a non-sulfonated cationic dye, which is thus a Lewis acid (Table S1, ESI†). Although MO can bind with BCSD (Lewis acid) through electrostatic attraction, the interaction is assumed to be very weak because of the steric hindrance of the two methyl groups,28 which explains the extremely small amount of MO adsorption. The non-effective adsorption of RB might be attributed to the electrostatic repulsion between positively charged dye molecules and active sites in BCSD.29 This consideration explains why BCSD selectively adsorbs CR rather than RB and MO. | ||
| Fig. 4 Removal efficiencies of CR, RB, and MO solutions (100 mg L−1) with BCSD at 303.5 K (inset: photo-image of CR solutions in the presence of BCSD at different contact times). | ||
3.3. Effects of adsorbent dose and solution pH on CR removal
The influence of adsorbent dosage on CR adsorption onto BCSD is illustrated in Fig. 5. A remarkable increase in removal efficiencies of CR from 38.3% to 74.4% was found when the adsorbent dosage was gradually increased from 1.0 to 2.5 g L−1. This can be explained by the formation of a large number of active adsorption sites.30 The leveling off of the removal efficiency at doses more than 2.5 g L−1 might be due to partial aggregation of adsorbent, which led to a relative decrease of binding sites.31 Nevertheless, the adsorption amount of CR per unit mass decreased significantly from 1533.5 to 873.1 mg g−1 with the increase of adsorbent dose. This effect can be explained by the limited availability of CR molecules leading to incomplete saturation (unsaturation) of the adsorption sites.32 Consequently, by taking into account the removal efficiency and adsorption capacity simultaneously, we chose an optimal dose of 2.5 g L−1 for the further experiments.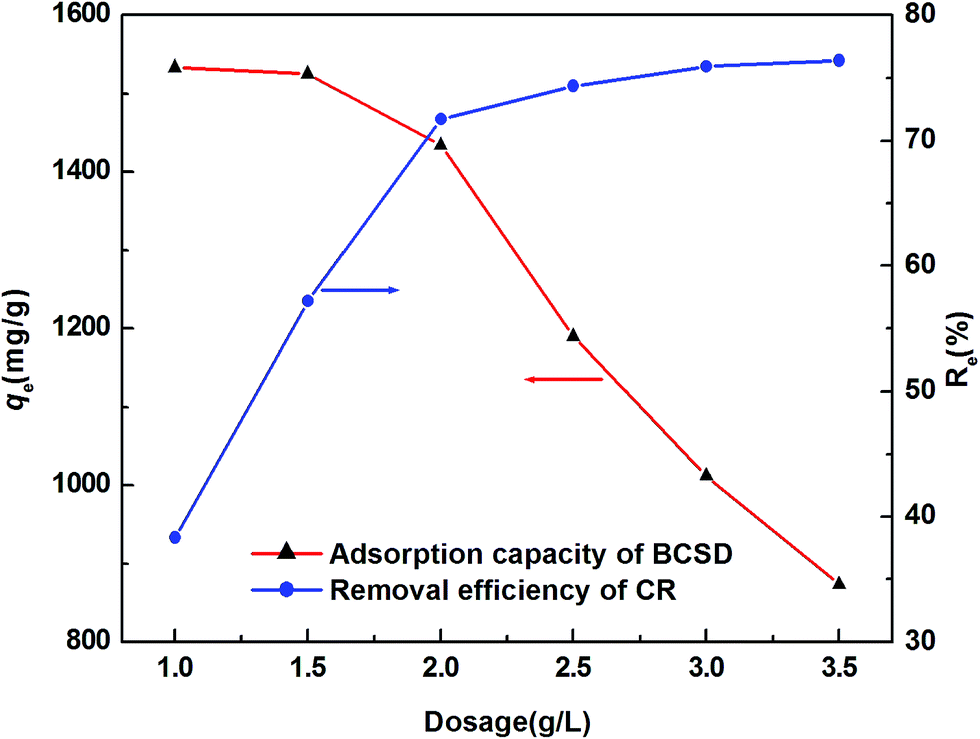 | ||
| Fig. 5 Effect of adsorbent dose on the adsorption of CR onto BCSD at 303.5 K. | ||
An important factor affecting the chemical properties of adsorbate and adsorbent is the pH value of the solution.33 Fig. 6a shows the effect of the initial pH the CR solution on the adsorption capacity of BCSD. It can be seen that the adsorption quantities of CR per unit mass decreased from 1366.0 to 243.0 mg g−1 when the pH of the solution increased from 5.0 to 12.0. Meanwhile, the removal efficiencies of CR also decreased from 85.4% to 15.2% with this change of the pH. This phenomenon can be ascribed to the variation of surface charges on both adsorbate and adsorbent.34 CR is an acid dye containing two negatively charged sulfonic groups (–SO3−) and has its isoelectric point at a pH of about 3.10 Under the experimental conditions the CR molecules were negatively charged, while the surface of BCSD at acidic condition was positively charged due to the protonation of oxygen at the crystal surface.35 So, the high adsorption capability of BCSD at low pH can be attributed to the electrostatic attraction between positive and negative charges. By increasing the pH, the protonation became less, causing less electrostatic attraction. It should be mentioned that the smaller adsorption capability of BCSD at high pH might also be due to a cooperative effect of hydrogen bonds and van der Waals forces.32,36 This implies that electrostatic attraction is not the only mechanism for CR adsorption onto BCSD. Fig. 6b illustrates the adsorption process and the two types of interaction between BCSD and CR. By considering also environmental arguments, we finally selected a pH of 7 for the further experiments.
 | ||
| Fig. 6 (a) Effect of solution pH on the adsorption of CR onto BCSD at 303.5 K, (b) schematic depiction of the adsorption process and interaction between BCSD and CR. | ||
3.4. Adsorption isotherms
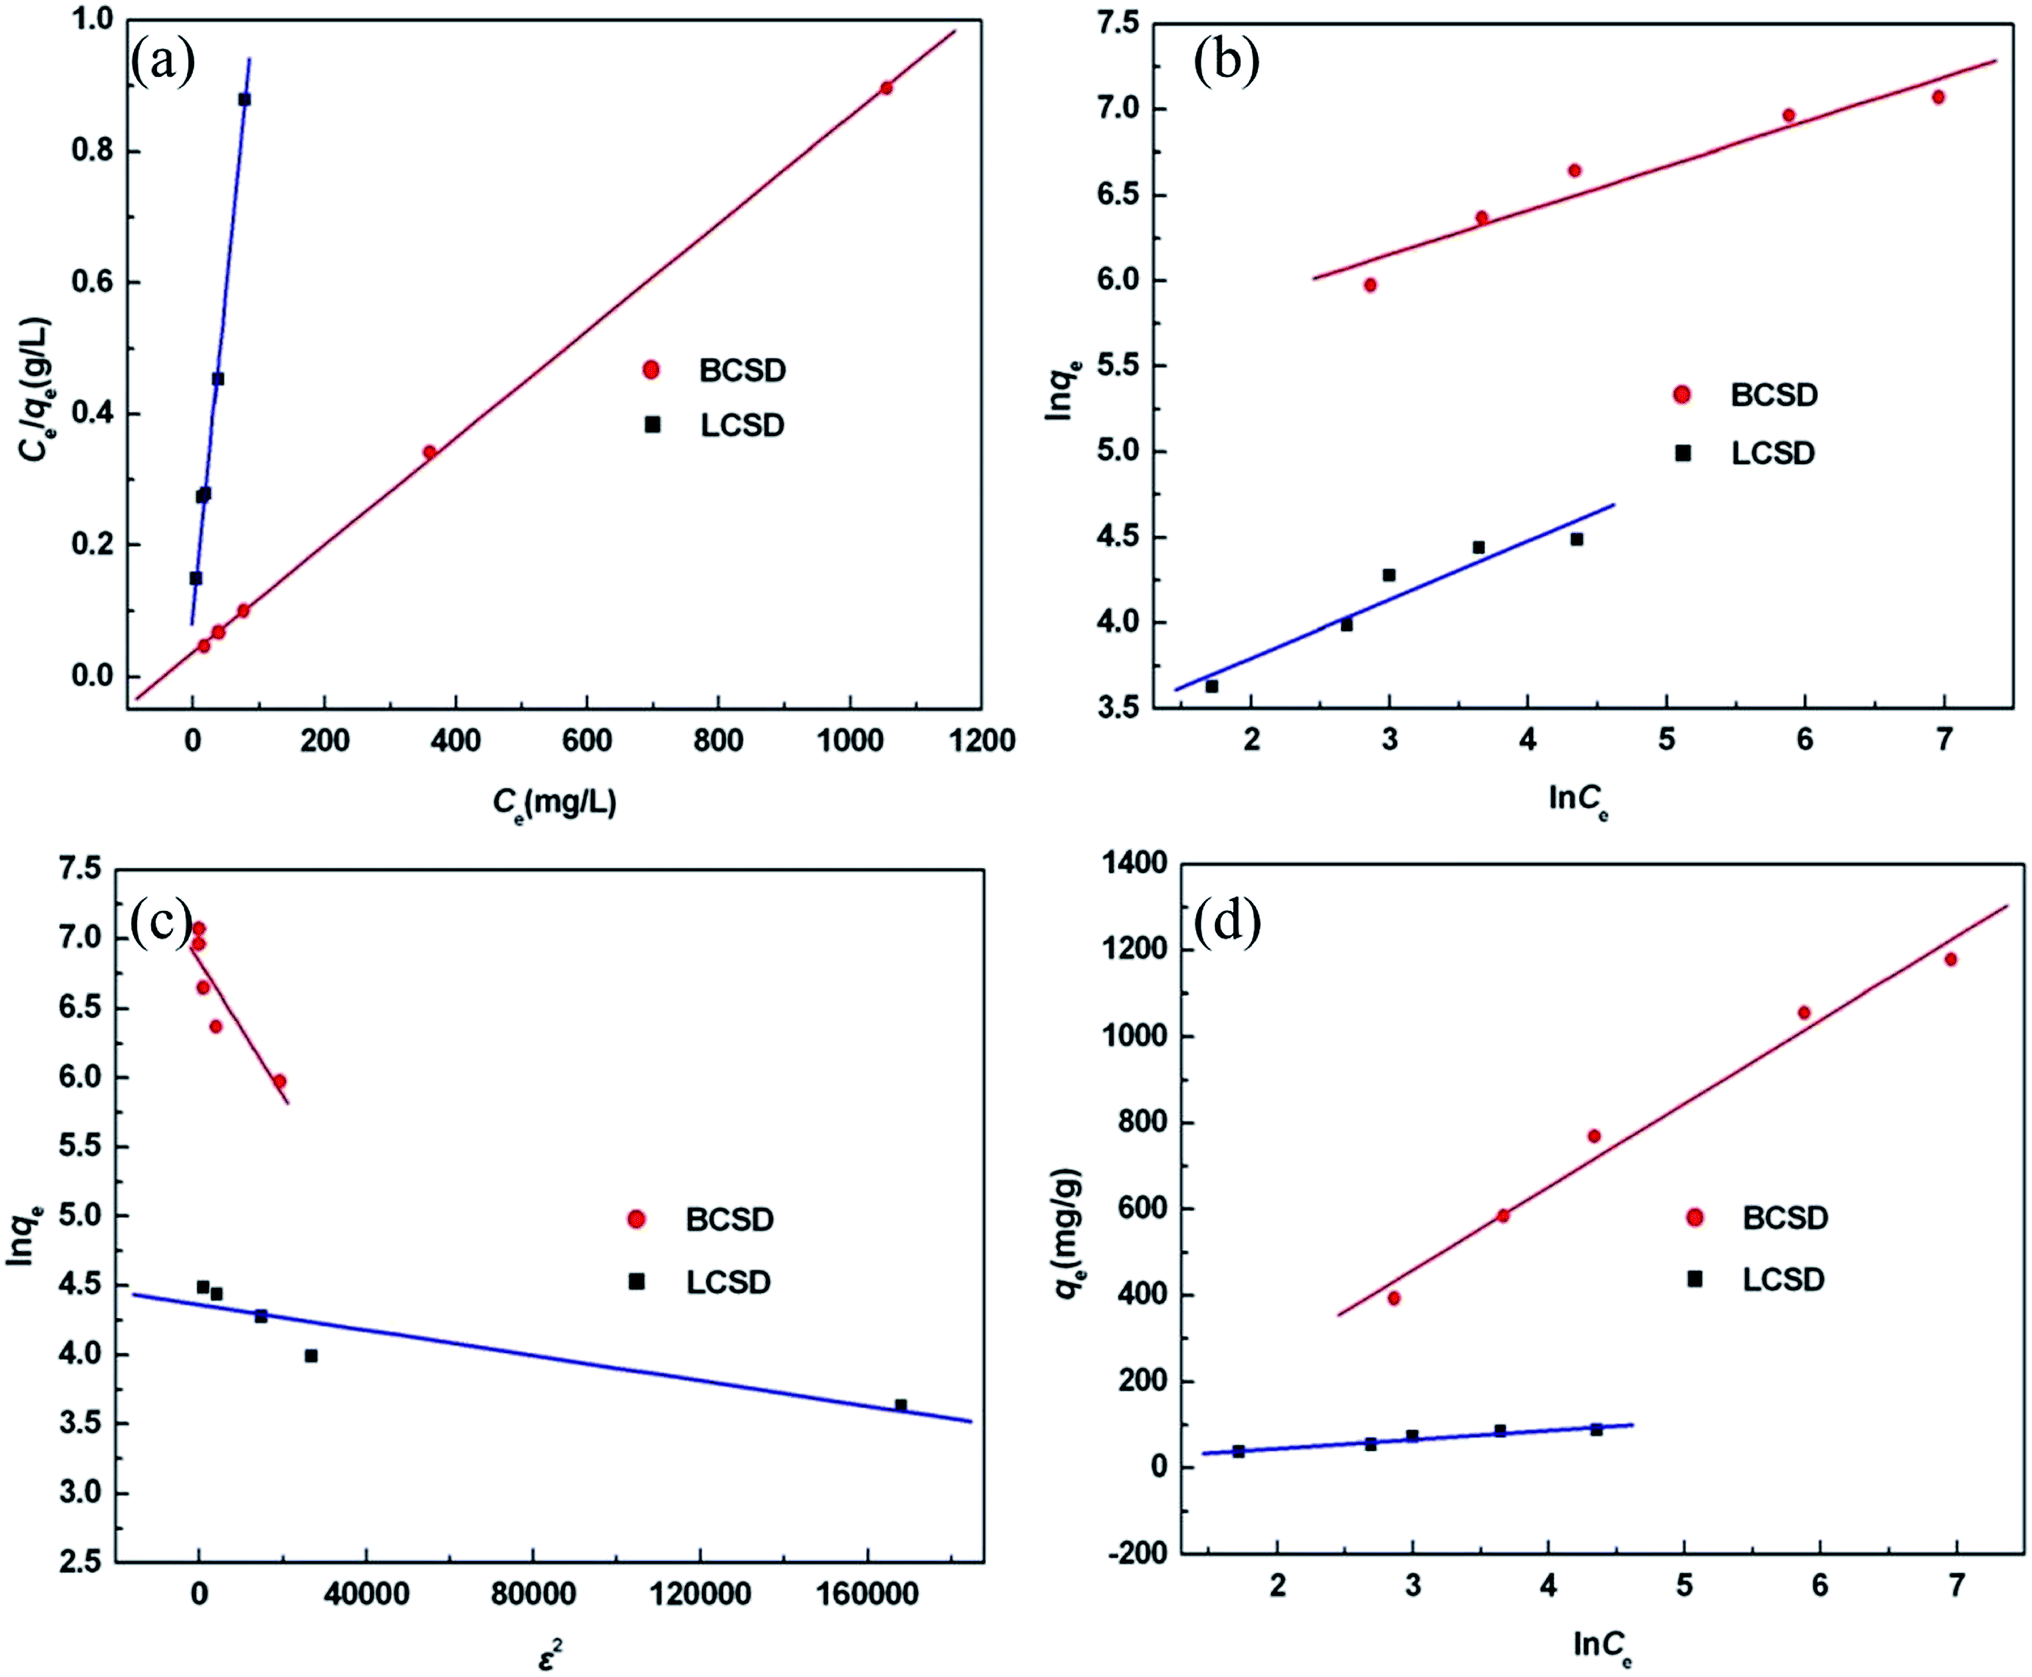
In order to quantitatively describe the adsorption behavior of an adsorbate onto an adsorbent, several types of adsorption isotherms have been proposed.32 We have applied four common models, viz. Langmuir, Freundlich, Dubinin–Radushkevich (D–R) and Temkin in this study to analyze the adsorption equilibrium process of CR onto BCSD. The control experiments for the adsorption of CR onto LCSD were simultaneously carried out at the same experimental conditions.In the Langmuir model37 it is assumed that a monolayer adsorption process occurs on the homogeneous surface of an adsorbent without considering the interaction between adsorbate molecules. The ratio Ce/qe between the equilibrium concentration of CR in solution (Ce, mg L−1) and the adsorption capacity at equilibrium (qe, mg g−1) can be expressed in this model in terms of the maximum adsorbed quantity (qmax, mg g−1) and a function of the free energy of adsorption (kL, L mg−1), as shown in eqn (S4) (ESI†).38
Another feature of the Langmuir model is the so-called separation factor (RL) utilized to evaluate the type of isotherm. It is a dimensionless equilibrium constant and is defined in eqn (S5) (ESI†).39 When 0 < RL < 1, the Langmuir model is well suitable to describe the adsorption process. For RL > 1, the Langmuir isotherm is inappropriate. When RL = 1, the adsorption process is linear. Finally, when RL = 0, the adsorption process is irreversible. Fig. 7a shows that the distribution diagrams of the experimental points agree favorably with the Langmuir model. As listed in Table S2 (ESI†), the obtained values of the correlation coefficients (R2 > 0.99) are very high. Moreover, all values of RL range from 0.011 to 0.434. It may be concluded that the adsorption of CR onto BCSD is a monolayer adsorption process.
 | ||
| Fig. 7 Isotherm models of (a) Langmuir, (b) Freundlich, (c) D–L, and (d) Temkin for adsorption of CR. | ||
In the Freundlich model, it is supposed that a multilayer adsorption process takes place on the non-homogeneous surface of an adsorbent. This model can be represented by eqn (S6) (ESI†),40 in which the corresponding parameters are described in detail. The Freundlich isotherms are plotted in Fig. 7b, and the corresponding parameters are listed in Table S2 (ESI†). The Freundlich isotherms yield lower R2 values (R2 < 0.93) than the Langmuir isotherms suggesting that the adsorption of CR onto BCSD is not a multilayer adsorption process.
The D–R model, which is frequently used to distinguish between physical and chemical adsorption, is shown in eqn (S7) (ESI†).41 It can be expressed in terms of the maximum adsorbed quantity (qm, mg g−1), a variate of the mean adsorption free energy (kD, mol2 kJ−2), and the Polanyi potential ε defined in eqn (S8) (ESI†). The mean adsorption free energy, expressed in E (kJ mol−1), can be calculated according to eqn (S9) (ESI†). Fig. 7c depicts that the distribution diagrams of the experimental points are not consistent with the D–R model. Moreover, as listed in Table S2 (ESI†), the obtained values of R2 are less than 0.83. These results indicate that the adsorption process cannot be described by the D–R model.
In the Temkin model it is supposed that the adsorption heat of all molecules in the adsorbed layer decreases linearly by increasing the adsorbed quantity: in this way the interaction between adsorbate molecules is taken into account. It is described in eqn (S10) (ESI†),42 where qe can be expressed in terms of the adsorption heat (b, equal to −ΔH, kJ mol−1) and the Temkin isotherm constant (kT, L mg−1). Fig. 7d shows that the distribution diagrams of the experimental points agree well with the Temkin model. As listed in Table S2 (ESI†), the obtained values of R2 are more than 0.93, which also indicates that the adsorption process is quite well represented by the Temkin model. The values of b are positive, which signifies that the adsorption is an exothermic process.32
By comparing the values of R2 for the four isotherm models, the adsorption equilibrium process of CR is best represented by the Langmuir isotherm model. The calculated value of qmax for BCSD is 1224.09 mg g−1, which is more than 12 times than that for LCSD (100.80 mg g−1). The nitrogen adsorption–desorption isotherms and BET curves of BCSD and LCSD obtained at 77 K are shown in Fig. S4 (ESI†). Since BCSD and LCSD have similar specific surface area (12.14 m2 g−1 and 11.17 m2 g−1, respectively), the highly efficient adsorption of BCSD may be associated with the preferentially exposed (021) and (041) planes (Fig. S5–S7, ESI†) in BCSD.43 It can be noticed in Table S3 (ESI†) that compared with other adsorbents,9,10,21,32,34,36,40,44,45 BCSD has the highest adsorption capability. Therefore, BCSD can be an excellent and promising candidate for wastewater treatment.
3.5. Thermodynamic studies
Temperature is a very important parameter for adsorption studies, so three thermodynamic parameters, viz. the changes of Gibb's free energy (ΔG0, kJ mol−1), entropy (ΔS0, J mol−1 K−1) and enthalpy (ΔH0, kJ mol−1) were investigated to explore the effect of temperature on adsorption of CR onto the adsorbents. The corresponding equations are shown in eqn (S11)–(S12) (ESI†),38 in which ΔG0 can be expressed in terms of the distribution coefficient of adsorbent (Kq, L g−1), and lnKq can be expressed in terms of the ΔS0, ΔH0 and T. The values of thermodynamic parameters are listed in Table S4 (ESI†). The negative values of ΔH0 confirm that the adsorption of CR on BCSD is exothermic. An increase in temperature will lead to a decrease in adsorbate onto adsorbent. The negative values of ΔS0 mean that a decrease in randomness of the solid/liquid interface during the adsorption of CR onto adsorbents. Furthermore, the negative values of ΔG0 indicate that the adsorption processes are spontaneous.
3.6. Adsorption kinetics
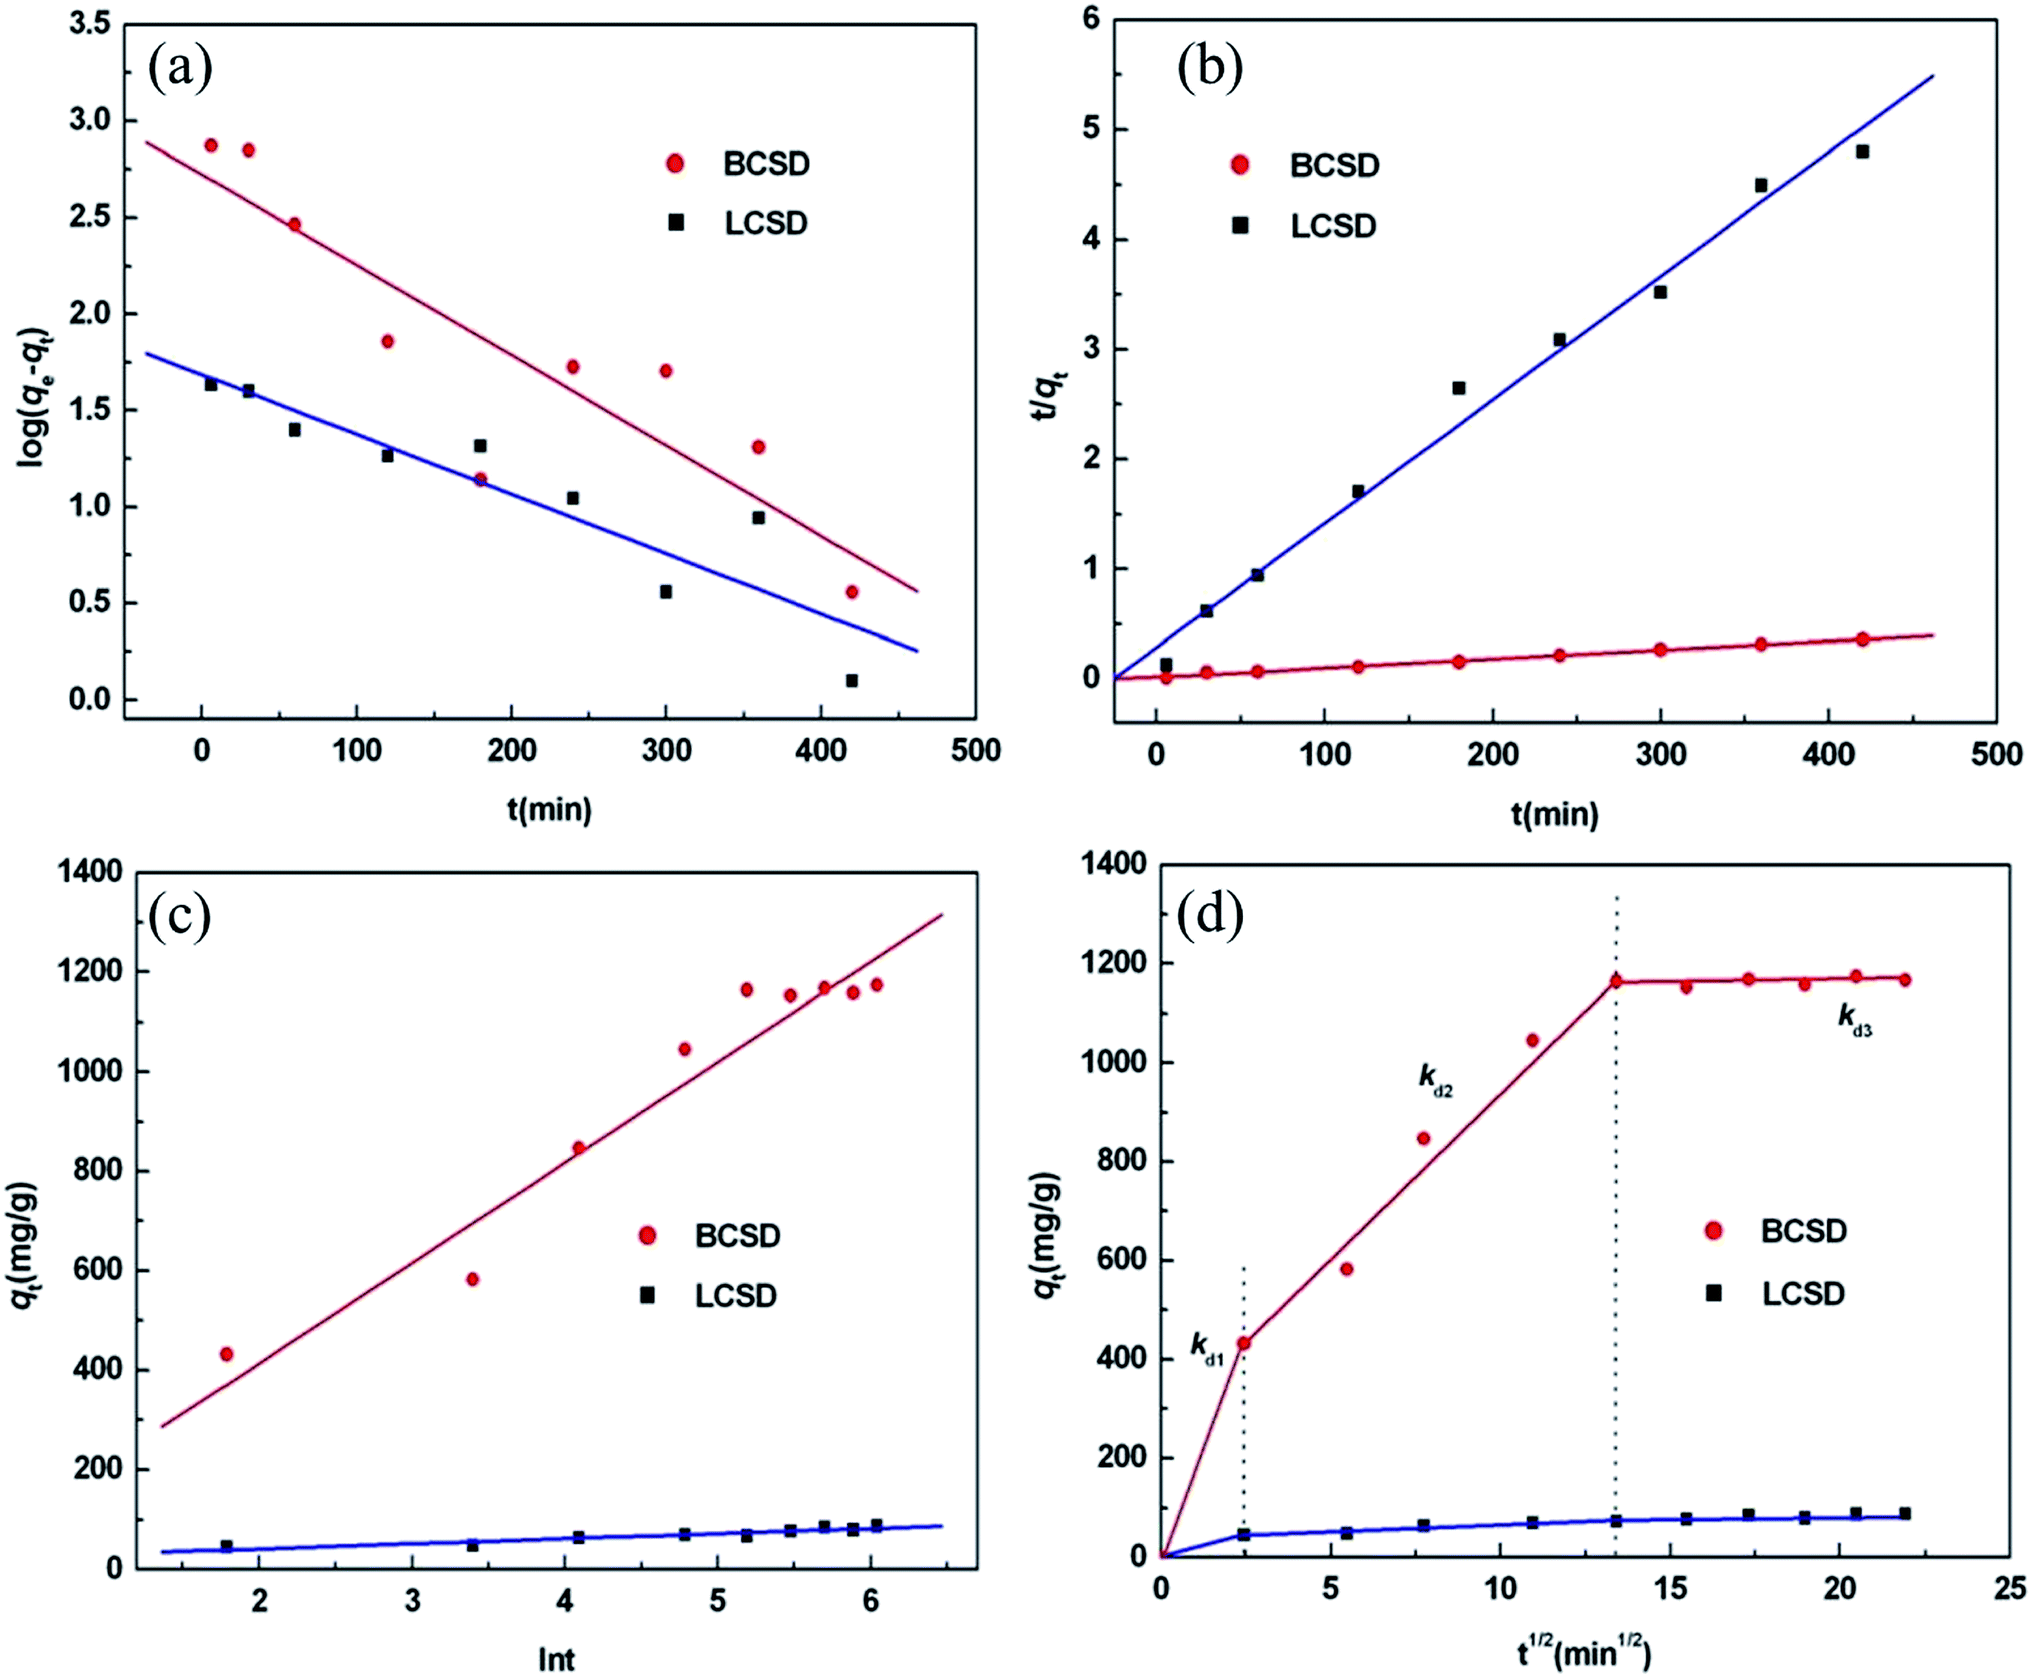
In order to investigate the adsorption mechanism and the rate-controlling step of adsorption process, four different kinetic models were adopted to describe the relationship between the adsorbed quantity and sorption time, viz. the pseudo-first-order model, the pseudo-second-order model, the Elovich model and the intra-particle diffusion model. The control experiments for adsorption of CR onto LCSD were carried out under the same experimental conditions, simultaneously. The corresponding kinetic equations will be considered in the sequel.The pseudo-first-order kinetic model can be represented as eqn (S13) (ESI†),10 in which corresponding parameters are defined in detail. Fig. 8a demonstrates that the distribution diagrams of the experimental points do not meet this linear model. Additionally, as shown in Table S5 (ESI†), the calculated values and experimental values of qe do not match and the values of R2 are less than 0.85, which also indicates that the adsorption process cannot be described by the pseudo-first-order kinetic model.
 | ||
| Fig. 8 Kinetic models of (a) pseudo-first-order, (b) pseudo-second-order, (c) Elovich, and (d) intra-particle diffusion for adsorption of CR. | ||
In the pseudo-second-order sorption model it is assumed that one molecule CR needs two sites on the BCSD surface, while the CR concentration is constant.46 This model can be described by eqn (S14) (ESI†),47 in which the ratio t/qe can be expressed in terms of the rate constant (k2, g mg−1 min−1) and time (t, min). Fig. 8b illustrates that the scatter diagrams of the experimental points agree well with eqn (S14),† which is linear in t. Moreover, as listed in Table S5 (ESI†), the calculated values and experimental values of qe are close to each other. Furthermore, the correlation coefficients (R2 > 0.98) are very high. Based on these results, it can be concluded that the pseudo-second-order rate model fits well with the adsorption kinetics of CR onto LCSD and BCSD. It was found by Ho and McKay46 that most adsorbents in aqueous solution show pseudo-second order kinetics, especially at long sorption time. So, the adsorption of CR onto BCSD behaves as the majority of the investigated sorption processes in water.
The linear equation of Elovich' kinetic model can be represented by eqn (S15) (ESI†),48 in which qt is expressed in terms of the initial adsorption rate (α, mg g−1 min−1) and Elovich desorption constant (β, g mg−1). Fig. 8c shows that the scatter plots of the experimental points do not match very well with eqn (S15).† This behavior is also reflected in the rather low correlation coefficients (R2 < 0.90) listed in Table S5 (ESI†). These results indicate that Elovich' adsorption kinetics of CR onto LCSD and BCSD is not likely.
The intra-particle diffusion model proposed by Weber and Morris is usually utilized to understand the diffusion mechanism of an adsorption process.33 Its linear form can be written as eqn (S16) (ESI†), in which qt can be expressed in terms of the rate constant of intra-particle diffusion at stage i (kid, mg g−1 min−1/2) and a constant Ci, the value of which directly affects the boundary layer thickness of molecular diffusion. Generally, if the values of Ci at various stages are equal to zero, intra-particle diffusion is the only rate-controlling step. As illustrated in Fig. 8d, the distributions of the experimental points exhibit a non-linear trend and may be divided into three linear regions, which indicate that the adsorption process of CR is a multi-step process. In the initial linear region, the removal efficiency of CR is dominated by surface adsorption due to the boundary layer effect, causing a sharp increase of the adsorption quantity. In the second linear region, intra-particle diffusion acts as the rate-controlling step, and the adsorption rate becomes smaller than that of the initial linear region. In the third linear region, the adsorption rate gradually slows down until the adsorption equilibrium. As listed in Table S5 (ESI†), the values of k1d and k2d of BCSD are larger than those of LCSD, which may be associated with the preferentially exposed (021) and (041) planes in BCSD.43 The values of the rate constants (kid) display a declining trend in the adsorption process; this can be attributed to the decrease of the concentration gradient with time. Moreover, all values of R2 in different linear regions are greater than 0.90, demonstrating that the intra-particle diffusion model can be used to describe adsorption kinetics of CR onto LCSD and BCSD, but not the only rate-controlling step.
3.7. Study on the ATR-FT-IR spectrum
The ATR-FT-IR spectra of CR, BCSD before and after adsorption are shown in Fig. 9. Compared with the spectra of BCSD and CR (Fig. 9a and c), the bands of BCSD after adsorption have changed substantially (Fig. 9b). It can be seen that the adsorption peaks at 3468 cm−1 for the N–H stretching of primary amine, 1223, 1178 and 1120 cm−1 for the RSO3− ν3 stretching, 698 cm−1 for the C–H stretching of di-substituted aromatic compound and 638 cm−1 for the C–C bending vibrations49–51 are hidden by those at 3520 and 3398 cm−1 for the O–H stretching, 1112 cm−1 for the SO42− ν3 stretching, 667 and 598 cm−1 for the SO42− ν4 stretching vibrations15,52,53 of BCSD respectively. The peaks at 1583 cm−1 for the N![[double bond, length as m-dash]](https://www.rsc.org/images/entities/char_e001.gif) N stretching, 1440 cm−1 for the CC stretching of aromatic compound, 1355 cm−1 for the C–N bending and 825 cm−1 for the ring vibrations of p-di-substituted aromatic compound49 in CR are much weaker or almost invisible. Moreover, the peak for the RSO3− ν1 stretching vibration (1063 cm−1)50 of CR shifts to lower wavenumber (1041 cm−1), which is a clear evidence of the bond between CR and BCSD. These observations indicate that chemical adsorption is involved in the adsorption of CR onto BCSD.
N stretching, 1440 cm−1 for the CC stretching of aromatic compound, 1355 cm−1 for the C–N bending and 825 cm−1 for the ring vibrations of p-di-substituted aromatic compound49 in CR are much weaker or almost invisible. Moreover, the peak for the RSO3− ν1 stretching vibration (1063 cm−1)50 of CR shifts to lower wavenumber (1041 cm−1), which is a clear evidence of the bond between CR and BCSD. These observations indicate that chemical adsorption is involved in the adsorption of CR onto BCSD.
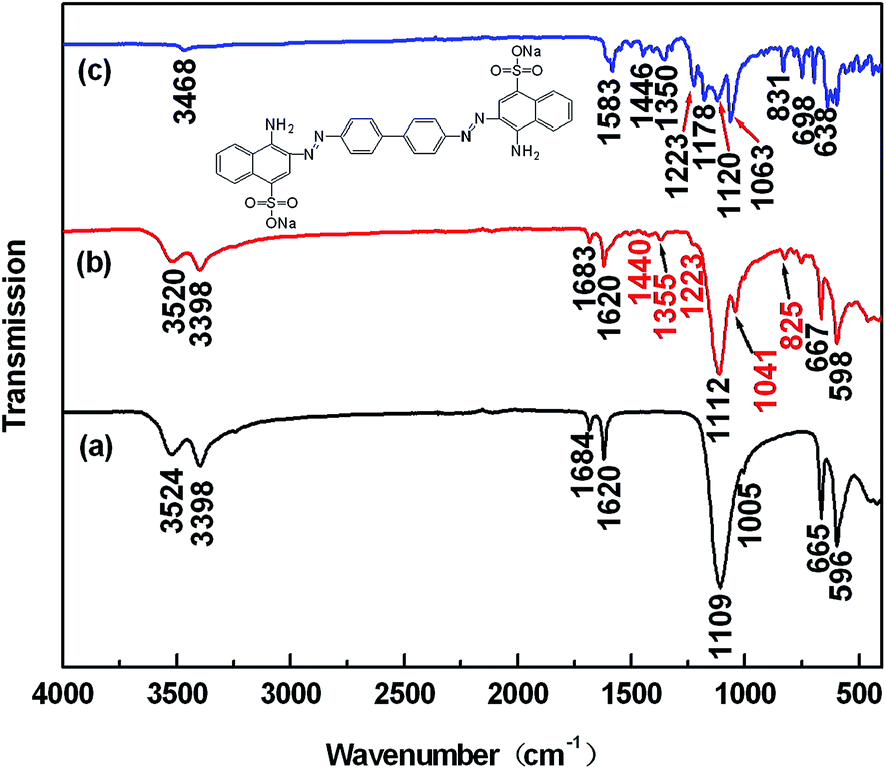 | ||
| Fig. 9 ATR-FT-IR spectra of (a) BCSD, (b) BCSD after adsorption, and (c) CR. | ||
3.8. Study of XPS spectra
To provide further evidence for the chemical adsorption of CR onto BCSD, XPS was carried out and the results are shown in Fig. 10. As depicted in Fig. 10a, the elements O, Ca, C and S are present in the full scan of BCSD before and after adsorption. The presence of C is due to the adsorption of CO2 or adventitious hydrocarbon pollution.54 Moreover, Na and N are also detected on BCSD after adsorption, which are characteristic elements of CR. This result indicates that CR has been adsorbed by BCSD. Fig. 10b displays the high-resolution spectrum of O 1s. The peak at 530.48 eV can be attributed to the oxygen atoms of the CR molecules, whilst the peak at 531.08 eV can be assigned to the oxygen atoms of BCSD molecules. The O 1s region of BCSD after adsorption can be fitted to two peaks. The peak at 531.08 eV is relatively weak and in accordance with the oxygen atoms of BCSD molecules. The peak at 531.90 eV is relatively strong and is assigned to oxygen related bonds formed between BCSD and CR molecules, indicating that chemisorption is the main interaction between adsorbate and adsorbent.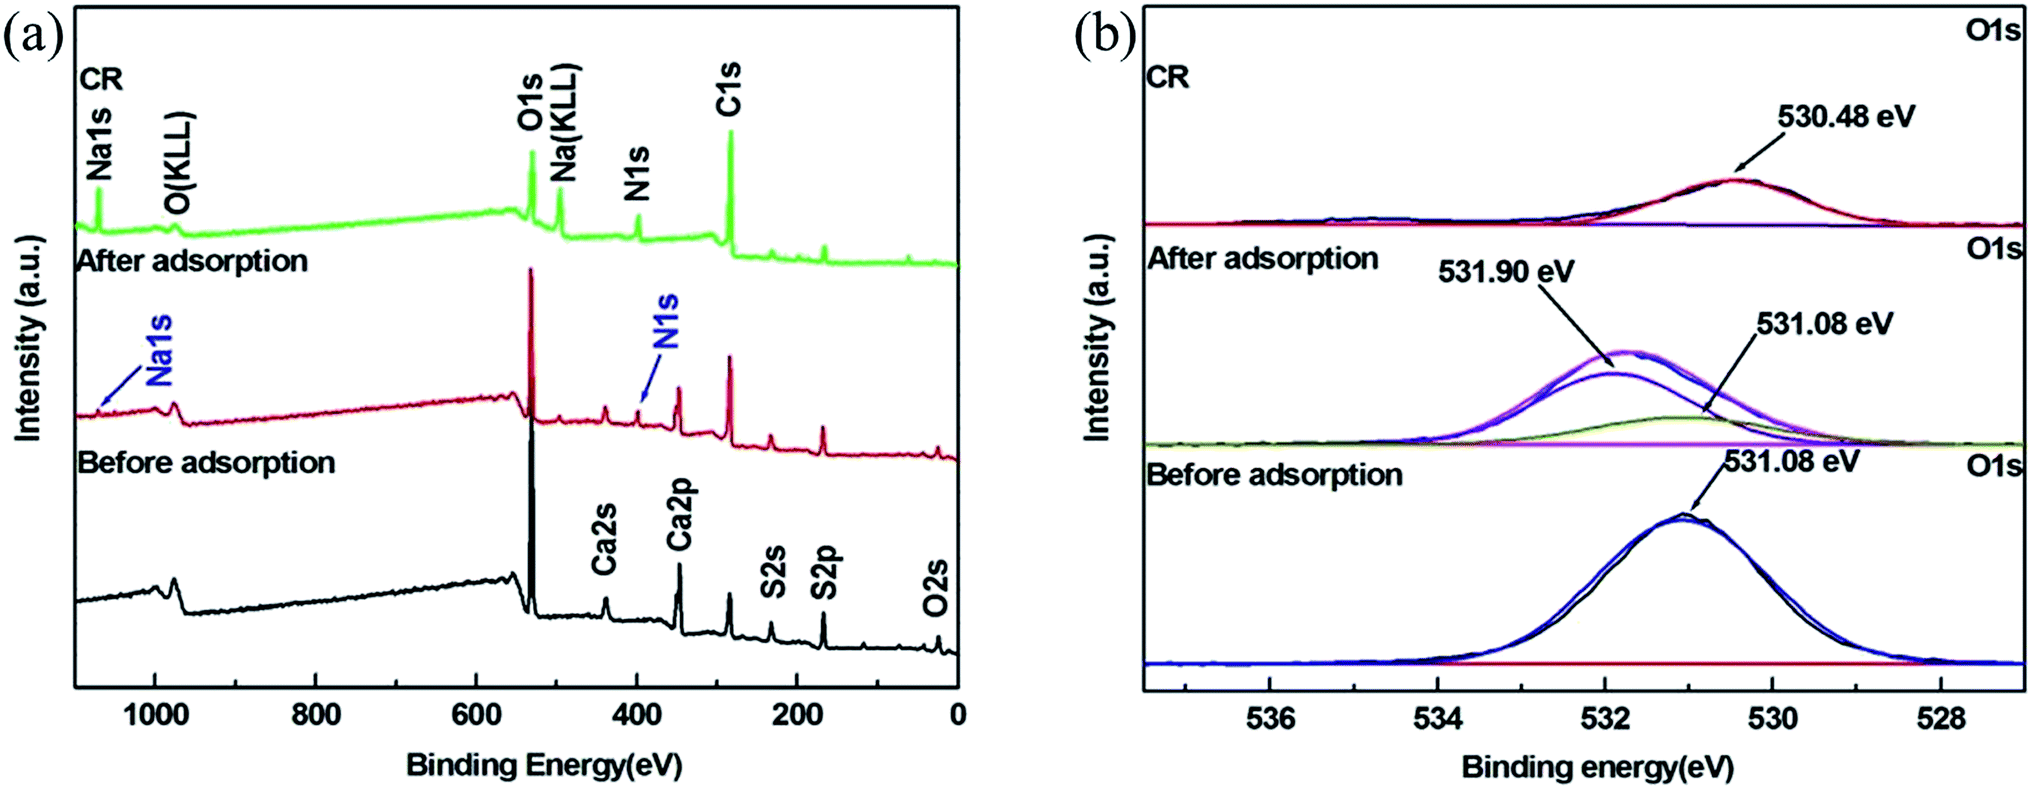 | ||
| Fig. 10 XPS spectra of BCSD, BCSD after adsorption and CR. (a) Full scan; (b) O 1s. | ||
Finally, we like to address the question why BCSD has a large adsorption capability for CR while LCSD has not. As indicated in Fig. 2 the (021) and (041) planes of BCSD are more exposed to the solution than those of LCSD, and from the BET measurements we found that the total surface area of BCSD and LCSD are almost equal. So, the main difference between BCSD and LCSD is a redistribution of the (020) plane to (021) and (041) planes. The latter two planes consist largely of oxygen atoms, which are likely protonated in acidic solutions.55 From our kinetic sorption studies it was concluded that the pseudo-second order sorption process was most likely. From these results we propose the following mechanism for the adsorption of CR onto BCSD:
| 2HS+ + CR2− → (HS)2CR | (1) |
4. Conclusions
In summary, we have described the selective synthesis of BCSD that has a high capability of selectively adsorbing CR rather than RB and MO. The crystal of BCSD grew preferentially in [021] and [041] orientations. The adsorption amount of CR per unit mass decreased with the increase of adsorbent dose and pH. The removal efficiency of CR decreased with an increasing pH, but increased with an increasing amount of adsorbent. The Temkin model demonstrated that adsorption equilibrium process was an exothermic process. The adsorption equilibrium isotherm results can adequately be described by the Langmuir isotherm model, and the calculated maximum adsorption quantity was 1224.09 mg g−1 at 303.5 K, which was larger than other conventional adsorbents. The adsorption kinetics could be described in terms of the pseudo-second-order model. The intra-particle diffusion model indicated that the adsorption process of CR is a multi-step process, but intra-particle diffusion was not the only rate-controlling step. From ATR-FT-IT and XPS studies it was concluded that CR was chemisorbed on BCSD. We consider that BCSD is an economical and promising candidate to be tested on semi-industrial scale for the purification of water polluted with azo dyes.Acknowledgements
We are pleased to acknowledge the National Natural Science Foundation of China (No. 51471006, No. 51225402 and No. 51402008), Beijing Natural Science Foundation (2151001, 2142008, and 2154043), Guangxi Natural Science Foundation (2014GXNSFBA118039 and 2014GXNSFBB118001), Importation and Development of High-Caliber Talents Project of Beijing Municipal Institutions (CIT&TCD201404038) for financial support of this work. Technical supports from Rui-Yun Zhao (Yuncheng environmental protection monitoring station) and Rong Wei (HUA JIN Textile Printing and Dyeing Co., Ltd of Shanxi province) are also gratefully acknowledged.References
- K. Chen, S. Song and D. Xue, J. Mater. Chem. A, 2015, 3, 2441–2453 CAS.
- H. Liu, Z. An and J. He, ACS Catal., 2014, 4, 3543–3550 CrossRef CAS.
- K. Chen, S. Song, F. Liu and D. Xue, Chem. Soc. Rev., 2015, 44, 6230–6257 RSC.
- K. Chen, C. Sun and D. Xue, Phys. Chem. Chem. Phys., 2015, 17, 732–750 RSC.
- P. Prokopovich, R. Leech, C. J. Carmalt, I. P. Parkin and S. Perni, Int. J. Nanomed., 2013, 8, 2227–2237 CrossRef PubMed.
- T. W. Kim, I. Y. Kim, T. S. Jung, C. H. Ko and S. Hwang, Adv. Funct. Mater., 2013, 23, 4377–4385 CrossRef CAS PubMed.
- L. Gao, Z. Cheng, Q. Xiang, Y. Zhang and J. Xu, Sens. Actuators, B, 2015, 208, 436–443 CrossRef CAS PubMed.
- A. Funes, J. de Vicente, L. Cruz-Pizarro and I. de Vicente, Water Res., 2014, 53, 110–122 CrossRef CAS PubMed.
- A. Afkhami and R. Moosavi, J. Hazard. Mater., 2010, 174, 398–403 CrossRef CAS PubMed.
- S. Liu, Y. Ding, P. Li, K. Diao, X. Tan, F. Lei, Y. Zhan, Q. Li, B. Huang and Z. Huang, Chem. Eng. J., 2014, 248, 135–144 CrossRef CAS PubMed.
- A. Ahmad, S. H. Mohd-Setapar, C. S. Chuong, A. Khatoon, W. A. Wani, R. Kumar and M. Rafatullah, RSC Adv., 2015, 5, 30801–30818 RSC.
- M. Vakili, M. Rafatullah, B. Salamatinia, A. Z. Abdullah, M. H. Ibrahim, K. B. Tan, Z. Gholami and P. Amouzgar, Carbohydr. Polym., 2014, 113, 115–130 CrossRef CAS PubMed.
- A. Aluigi, F. Rombaldoni, C. Tonetti and L. Jannoke, J. Hazard. Mater., 2014, 268, 156–165 CrossRef CAS PubMed.
- A. E. S. Van Driessche, L. G. Benning, J. D. Rodriguez-Blanco, M. Ossorio, P. Bots and J. M. Garía-Ruiz, Science, 2012, 336, 69–72 CrossRef CAS PubMed.
- B. Kong, B. Guan, M. Z. Yates and Z. Wu, Langmuir, 2012, 28, 14137–14142 CrossRef CAS PubMed.
- L. Li, Y. J. Zhu and M. G. Ma, Mater. Lett., 2008, 62, 4552–4554 CrossRef CAS PubMed.
- A. Ding, F. Qu, H. Liang, S. Guo, Y. Ren, G. Xu and G. Li, RSC Adv., 2014, 4, 24762–24768 RSC.
- M. T. M. Pendergast and E. M. V. Hoek, Energy Environ. Sci., 2011, 4, 1946–1971 CAS.
- F. Deniz and S. D. Saygideger, Desalination, 2010, 262, 161–165 CrossRef CAS PubMed.
- M. A. Rauf, S. M. Qadri, S. Ashraf and K. M. Al-Mansoori, Chem. Eng. J., 2009, 150, 90–95 CrossRef CAS PubMed.
- J. Tian, P. Tian, G. Ning, H. Pang, Q. Song, H. Chen and H. Fang, RSC Adv., 2015, 5, 5123–5130 RSC.
- I. L. Chen, T. Y. Chen, Y. C. Wei, C. C. Hu and T. L. Lin, Nanoscale, 2014, 6, 2861–2871 RSC.
- H. He, H. Li, W. Xia, X. Shen, M. Zhou, J. Han, X. Zeng and W. Cai, J. Mater. Chem. C, 2015, 3, 1724–1731 RSC.
- C. Sun and D. Xue, Cryst. Growth Des., 2015, 15, 2867–2873 CAS.
- C. Sun and D. Xue, Cryst. Growth Des., 2014, 14, 2282–2287 CAS.
- C. Sun and D. Xue, CrystEngComm, 2014, 16, 2129–2135 RSC.
- J. Seo, J. Jang, S. Park, C. Kim, B. Park and J. Cheon, Adv. Mater., 2008, 20, 4269–4273 CrossRef CAS PubMed.
- X. Z. Luo, X. J. Jia, J. H. Deng, J. L. Zhong, H. J. Liu, K. J. Wang and D. C. Zhong, J. Am. Chem. Soc., 2013, 135, 11684–11687 CrossRef CAS PubMed.
- D. Mahanta, G. Madras, S. Radhakrishnan and S. Patil, J. Phys. Chem. B, 2009, 113, 2293–2299 CrossRef CAS PubMed.
- R. R. Mohammed, M. R. Ketabchi and G. McKay, Chem. Eng. J., 2014, 243, 31–42 CrossRef CAS PubMed.
- J. Wang, R. Peng, J. Yang, Y. Liu and X. Hu, Carbohydr. Polym., 2011, 84, 1169–1175 CrossRef CAS PubMed.
- Q. Du, J. Sun, Y. Li, X. Yang, X. Wang, Z. Wang and L. Xia, Chem. Eng. J., 2014, 245, 99–106 CrossRef CAS PubMed.
- J. Fu, Z. Chen, M. Wang, S. Liu, J. Zhang, J. Zhang, R. Han and Q. Xu, Chem. Eng. J., 2015, 259, 53–61 CrossRef CAS PubMed.
- J. Xiong, C. Jiao, C. Li, D. Zhang, H. Lin and Y. Chen, Cellulose, 2014, 21, 3073–3087 CrossRef CAS.
- C. C. Obunwo, I. Ubong and G. I. Ordu, Int. J. Biol. Chem. Sci., 2012, 6, 2202–2210 Search PubMed.
- J. Li, D. H. Ng, P. Song, C. Kong, Y. Song and P. Yang, Biomass Bioenergy, 2015, 75, 189–200 CrossRef CAS PubMed.
- I. Langmuir, J. Am. Chem. Soc., 1918, 40, 1361–1403 CrossRef CAS.
- J. S. Cao, J. X. Lin, F. Fang, M. T. Zhang and Z. R Hu, Bioresour. Technol., 2014, 163, 199–205 CrossRef CAS PubMed.
- T. W. Weber and R. K. Chakravorti, AIChE J., 1974, 20, 228–238 CrossRef CAS PubMed.
- M. Bhaumik, R. McCrindle and A. Maity, Chem. Eng. J., 2013, 228, 506–515 CrossRef CAS PubMed.
- M. J. C. Calagui, D. B. Senoro, C. C. Kan, J. W. L. Salvacion, C. M. Futalan and M. W. Wan, J. Hazard. Mater., 2014, 277, 120–126 CrossRef CAS PubMed.
- S. J. Allen, Q. Gan, R. Matthews and P. A. Johnson, Bioresour. Technol., 2003, 88, 143–152 CrossRef CAS.
- L. Ye, Y. Su, X. Jin, H. Xie and C. Zhang, Environ. Sci.: Nano, 2014, 1, 90–112 RSC.
- Y. Yao, S. Miao, S. Liu, L. P. Ma, H. Sun and S. Wang, Chem. Eng. J., 2012, 184, 326–332 CrossRef CAS PubMed.
- J. Wu, H. Li, J. Wang and Z. Li, J. Nanosci. Nanotechnol., 2013, 13, 5452–5460 CrossRef CAS PubMed.
- Y. S. Ho and G. McKay, Process Biochem., 1999, 34, 451–465 CrossRef CAS.
- V. Vadivelan and K. V. Kumar, J. Colloid Interface Sci., 2005, 286, 90–100 CrossRef CAS PubMed.
- N. Yeddou and A. Bensmaili, Desalination, 2005, 185, 499–508 CrossRef CAS PubMed.
- A. A. Telke, S. M. Joshi, S. U. Jadhav, D. P. Tamboli and S. P. Govindwar, Biodegradation, 2010, 21, 283–296 CrossRef CAS PubMed.
- B. Acemioğlu, J. Colloid Interface Sci., 2004, 274, 371–379 CrossRef PubMed.
- C. W. M. Yuen, S. K. A. Ku, P. S. R. Choi, C. W. Kan and S. Y. Tsang, Res. J. Text. Apparel, 2005, 9, 26–38 Search PubMed.
- Y. Chen and Q. Wu, Colloids Surf., A, 2008, 325, 33–37 CrossRef CAS PubMed.
- J. L. Bishop, M. D. Lane, M. D. Dyar, S. J. King, A. J. Brown and G. A. Swayze, Am. Mineral., 2014, 99, 2105–2115 CrossRef.
- L. Yue, S. Wang, G. Shan, W. Wu, L. Qiang and L. Zhu, Appl. Catal., B, 2015, 176, 11–19 CrossRef PubMed.
- A. Galstyan, A. Robertazzi and E. W. Knapp, J. Am. Chem. Soc., 2012, 134, 7442–7449 CrossRef CAS PubMed.
Footnote |
| † Electronic supplementary information (ESI) available. See DOI: 10.1039/c5ra11514k |
| This journal is © The Royal Society of Chemistry 2015 |