Novel tough and thermally stable cyanate ester resins with high flame retardancy, low dielectric loss and constant based on a phenolphthalein type polyarylether sulfone

Lin Zhao, Li Yuan, Guozheng Liang* and Aijuan Gu*
Jiangsu Key Laboratory of Advanced Functional Polymer Design and Application, College of Chemistry, Chemical Engineering and Materials Science, Soochow University, Suzhou, China. E-mail: ajgu@suda.edu.cn; lgzheng@suda.edu.cn; Fax: +86 51265880089; Tel: +86 51265880967

Received 5th June 2015 , Accepted 1st July 2015

First published on 1st July 2015


Abstract

It still remains a big challenge to improve the toughness and flame retardancy of cyanate ester (CE) resin through a simple and effective method without sacrificing its excellent dielectric properties and thermal stability. New modified CE resins were facilely developed through melt-blending with a phenolphthalein type polyarylether sulfone (cPES), and the integrated performances including the reactivity, mechanical, dielectric, thermal and flame retarding properties were systematically investigated. Results show that compared with CE resin, cPES/CE resins have 1.2–3.2 times higher impact strengths according to the concentration of cPES on the basis of maintaining good thermal stability, high modulus, low dielectric constant and loss. Through analyzing thermogravimetric kinetics, cone calorimeter tests, and the structures of chars and pyrolysis gases, it is proven that the addition of cPES into CE resin greatly increases the difficulty of catching fire, reflected by the time to ignition (TTI), fire performance index (FPI) and fire growth index (FGI); while once ignited, the cPES/CE resin exhibits a bigger heat release rate and total heat release. These attractive results demonstrate that cPES is a multi-functional modifier of CE resin. The reason for this was systematically revealed through discussing the influence of cPES on the structure of the crosslinked network.

1. Introduction

Owing to its outstanding thermal and hot-wet resistance, high mechanical property, and good processing feature, etc., thermally resistant thermosetting resin (TS) has been treated as the key fundamental material in many cutting-edge fields such as studies concerning applications for aerospace, electrical information storage, new energy research, insulation, and so on.1–3 However, compared with thermoplastic polymers, thermally resistant TS resins have great brittleness due to the three-dimensional crosslinking characteristics, and thus toughening has been a core and interesting topic for thermally resistant TS resins.

So far, many materials have been used as the toughening modifiers, including rubber elastomers,4 thermosetting resins,5 inorganic rigid particles,6 engineering thermoplastics (eTP),7 etc. A remarkable toughening effect will be obtained by using rubber elastomers, however this also brings a big deterioration of modulus and glass transition temperature (Tg) of the original resins;8 while the increasing magnitude of toughness is still somewhat limited by utilizing TS resins and inorganic rigid particles,9,10 although the modulus and Tg are usually maintained.

The biggest feature of employing eTP is having a big capability of greatly improving the toughness without deteriorating the modulus and Tg of thermally resistant TS resins.11 Note that the phase separation is a common phenomenon during the preparation of eTP/TS resin12 or at the end of curing13 due to the poor compatibility between eTP and TS. In fact, the phase separation is also responsible for the toughening effect,14 so the repeatability of morphology of eTP/TS system plays an important role on the properties of eTP/TS resin. However, the poor processing feature of eTP, such as the high viscosity and melting temperature, less reactive groups and poor solubility in common solvents with low boiling points, makes an inferior repeatability of the phase-separation morphology of eTP/TS resins, especially for those with obvious phase-separation. Therefore, it is of great significance to design new eTP/TS system with good processing and compatibility.

Phenolphthalein type polyarylether sulfone (cPES) is one type of soluble and amorphous polyarylether sulfone (PES) with reduced crystalline due to the presence of phenolphthalein pendant group. Note that, the Tg of cPES is as high as 263 °C (measured by differential thermal analysis, DTA), ranking the top among the polysulfone series.15 However, cPES is mainly used to prepare functional membranes,16 and seldom for modifying thermally resistant resins.

Among the thermally resistant TS resins, cyanate ester (CE) resin has attracted much attention worldwide owing to its outstanding integrated performances and great potential in many cutting-edge fields including electric information, insulation, aerospace.17–19 So we selected CE resin as the base resin for developing new high performance resins. Herein, a series of cPES/CE resins were prepared through melt-blending without using solvent, and the relatively good compatibility with small content of cPES was obtained, ensuring the good manufacturability. On the basis, the integrated performances and structure were systematically investigated from the view point of structure-property relationship, especially, the flame retardancy and mechanism of the cPES/CE resins were intensively studied. Some interesting phenomena were founded, and the origin behind was discussed.

2. Experimental

2.1 Materials

CE used herein is 2,2′-bis (4-cyanatophenyl) propane, which was purchased from Tianqi Chemical Ltd, of Yangzhou, China. cPES with a molecular weight of 26[thin space (1/6-em)]000 and a reduced viscosity (ηsp/c) of 0.5 was supplied by Xuzhou Engineering Plastics Co., Xuzhou, China, its structure was shown in Fig. 1.
image file: c5ra10670b-f1.tif
Fig. 1 The structure of cPES.

2.2 Preparation of CE resins

Appropriate quantity of CE was heated to 150 °C and maintained with vigorous stirring for 2 h to get a CE prepolymer, which was then poured into a preheated glass mold and degassed under vacuum at 150 °C for 1 h. After that, the mold was put into an oven for curing using the procedure of 150 °C/2 h + 180 °C/2 h + 200 °C/2 h + 220 °C/2 h, and followed by a postcuring at 240 °C for 4 h. The resultant resin was coded as CE resin.

2.3 Preparation of cPES/CE resins

According to compositions shown in Table 1, a certain quantity of CE was heated to 150 °C until a clear liquid was obtained, into which cPES with appropriate quantity were added and maintained at that temperature with stirring for additional 2 h to get a cPES/CE prepolymer. Then the prepolymer was poured into a preheated glass mold and degassed under vacuum at 150 °C for 1 h. After that, the mold was put into an oven for curing and postcuring using the procedures of 150 °C/2 h + 180 °C/2 h + 200 °C/2 h + 220 °C/2 h, and 240 °C/4 h, successively.
Table 1 Compositions of cPES/CE resins
System Weight ratio
CE cPES
5cPES/CE 100 5
10cPES/CE 100 10
15cPES/CE 100 15
20cPES/CE 100 20


2.4 Characterizations

Differential scanning calorimetry (DSC) measurements were conducted with a DSC 2910 (TA Instruments, USA) ranging from room temperature to 350 °C at a heating rate of 10 °C min−1 under a nitrogen atmosphere.

Fourier transform infrared (FTIR) spectra were recorded on a Nicolet-5700 (USA) in the region of 4000–400 cm−1 with a resolution of 2 cm−1 using the transmission mode. The experiments were done on the powered samples of CE and cPES/CE resins, using KBr pellets.

A scanning electron microscope (Hitachi S-4700, Japan) was employed to observe the morphologies of the fractured surfaces of CE and cPES/CE resins.

UV-vis transmittance spectra from 200 to 700 nm were recorded on a Shimadzu RF540 spectrophotometer (Kyoto, Japan).

Positron annihilation lifetime spectroscopy (PALS) was detected using a conventional fast-slow coincidence system (USA) with a time resolution of 300 ps. A 22Na (20 μCi) radioactive source was sandwiched between two same samples. Each spectrum contained approximately 1 × 10⁶ cumulative counts. All PALS measurements were performed at 20 ± 0.5 °C under an air atmosphere. The resulting spectra were consistently modeled with the computer program Lifetime9. The dimensions of each sample were (10 ± 0.02) × (10 ± 0.02) × (1 ± 0.02) mm3.

The unnotched impact strengths were determined according to GB2571-95 using a Charpy impact machine tester (JGL-5, Shenzhen, China). The flexural strengths were measured according to GB2570-95 using an electronic universal testing machine (WDW, Shenzhen, China) at a crosshead speed of 2 mm min−1. For each property of a system, at least five samples were tested, and the average value was taken as the tested value.

The dielectric constant and loss were measured on a broadband dielectrics spectrometer (Novocontrol Concept 80, Hundsangen, Germany) at room temperature over the frequency from 1 to 106 Hz. The dimensions of each sample were (25 ± 0.02) × (25 ± 0.02) × (3 ± 0.02) mm3.

Thermogravimetric (TG) analyses were performed on a TA Instruments (Discovery TGA, USA) from 25 to 800 °C under a nitrogen or air atmosphere with a flow rate of 10 °C min−1. The initial decomposition temperature (Tdi) was defined as the point of intersection at the tangent of the onset temperature and the tangent of the maximum degradation rate temperature.

Dynamic mechanical analysis (DMA) was performed in a single-cantilever blending mode using TA DMA Q800 (USA) apparatus from 30 to 350 °C at a heating rate of 5 °C min−1 and a frequency of 1 Hz. The dimensions of each sample were (35 ± 0.02) × (13 ± 0.02) × (3 ± 0.02) mm3.

Cone calorimeter (CONE) tests were performed on an FTT device (UK) according to ISO 5660 with an incident flux of 35 kW m−2 using a cone shape heater. Each sample was put into an aluminum boat (tray), which was then put into the specimen holder in the horizontal orientation for testing. The dimensions of each sample were (100 ± 0.02) × (100 ± 0.02) × (3 ± 0.02) mm3.

Three-dimensional super depth of field microscope (VW-6000/5000, Keyence, Japan) was used to observe the three-dimensional microstructures of the chars after CONE tests.

A sample (625 ± 5 mg) was put on the central place of the heating platform in a muffle furnace (SX2-6-13, Jiangsu, China) with a preset temperature and maintained at that temperature for 15 min. The heating transfer mechanism was thermal radiation, and the heating was uniform. The dimensions of each sample were (10 ± 0.02) × (10 ± 0.02) × (2 ± 0.02) mm3.

Thermogravimetric analysis-infrared (TG-IR) tests were performed on a thermogravimetric analyzer (TG209, Netzsch, Germany) combined with a FTIR spectrophotometer (Vertex 80, Bruker, Germany) using the transmission mode. The samples were heated from 25 to 800 °C under a nitrogen atmosphere. The flowing rate of nitrogen was 10 mL min−1, and the resolution of FTIR here was 4 cm−1.

3. Results and discussion

3.1 Curing behaviors and chemical structures of cPES/CE resins

It is known that the structure determines the properties of a material,20,21 while the former of a crosslinking network depends on the curing behavior and mechanism, so it is necessary to study the curing behavior of thermosetting resins.

Fig. 2 gives DSC curves of CE and cPES/CE prepolymers. It is shown that CE prepolymer has one exothermic peak, but each trace of cPES/CE prepolymer has a small shoulder peak besides the main peak, indicating that the curing of cPES/CE prepolymer follows a different mechanism from that of CE prepolymer. In addition, both the onset and peak temperatures of cPES/CE prepolymers shift toward lower ones, demonstrating that the curing process of CE can be slightly accelerated by the addition of cPES. It is confirmed that cPES contains a small amount of hydroxyl groups (–OH) (Fig. 3), which is resulted from the condense reaction between phenolphthalein and 4,4′-dichlorodiphenyl sulfone.22 While –OH group is known to have copolymerization with CE,23 and also catalyze the homopolymerization of –OCN groups.24 The crosslinking reactions of homo- or co-polymerization of cPES/CE resins are depicted in Fig. 4.


image file: c5ra10670b-f2.tif
Fig. 2 DSC curves of CE and cPES/CE prepolymers.

image file: c5ra10670b-f3.tif
Fig. 3 FTIR spectra of CE, cPES and 10cPES/CE resins.

image file: c5ra10670b-f4.tif
Fig. 4 The crosslinking reactions of homo- (a) or co-polymerization (b) of cPES/CE resins.

The influence of cPES on the curing of CE can be further proved verified through the FTIR spectra of CE and cPES/CE resins cured through different curing procedures (Fig. 5) as well as the contents of –OCN groups and triazine rings (Fig. 6).


image file: c5ra10670b-f5.tif
Fig. 5 The FTIR spectra of CE and cPES/CE resins at various curing stages: (1) 150 °C/2 h, (2) 150 °C/2 h+180 °C/2 h, (3) 150 °C/2 h+180 °C/2 h +200 °C/2 h, (4) 150 °C/2 h+180 °C/2 h +200 °C/2 h+220 °C/2 h, (5) 150 °C/2 h+180 °C/2 h +200 °C/2 h+220 °C/2 h+240 °C/4 h.

image file: c5ra10670b-f6.tif
Fig. 6 The contents of –OCN group (a) and triazine ring (b) in CE and cPES/CE resins at various curing stages.

Specifically, in any stage of the curing, the content of –OCN group in cPES/CE system is lower than that in CE resin, illustrating that the presence of cPES is beneficial to increase the conversion of –OCN group. With regard to the content of triazine rings, its order between original and modified CE resins is related to the curing stage and the loading of cPES. Specifically, when the curing temperature is not higher than 180 °C, the content of triazine rings in CE resin is lower than that in cPES/CE resins, reflecting that there is obvious catalytic effect on the reaction of triazine ring under this circumstance; however, when the maximum curing temperature reaches 200 °C, cured 5cPES/CE and 10cPES/CE resins have larger content of triazine ring than cured CE resins, while the latter has almost same contents of triazine ring as cured 15cPES/CE and 20cPES/CE resins. These results suggest that the catalytic effect plays a major role in 5cPES/CE and 10cPES/CE resins, but as more cPES are added, the effect of the copolymerization between –OH and –OCN groups gradually becomes more obvious and counteracts the catalytic effect. When the maximum curing temperature is higher (≥220 °C), CE resin has more content of triazine ring than cPES/CE resins, demonstrating that besides the homopolymerization of –OCN groups, there exists the copolymerization between –OCN and –OH group in cPES, which consumes the –OCN group in the resin; consequently, that is the reason that more cPES used leads to the greater effect of copolymerization.

3.2 Aggregation state structure of cPES/CE resins

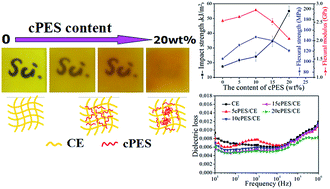
3.2.1 Morphology. Fig. 7 gives the SEM micrographs of cured CE and cPES/CE resins. The fractured surface of CE resin is smooth and uniform, which presents a river-like morphology, showing the homogeneous phase structure with a typical brittle feature.25 However, with the addition and increased content of cPES, more and more protonemata and dimples appear with an increased roughness, suggesting a transition from brittle to tough feature.
image file: c5ra10670b-f7.tif
Fig. 7 Digital photos (left) and SEM micrographs (right) of the fracture surfaces of CE and cPES/CE resins after impact tests.

However, no obvious phase separation is observed in the SEM images. But from the digital photos (the left part of each sample in Fig. 7), it is seen that both CE and cPES/CE resins are uniform, and the transparency of cPES/CE resins is closely related to the content of cPES. It is interesting to note that when the loading of cPES is as high as 10 wt%, the cPES/CE resin is uniform and still transparent, suggesting the good compatibility between cPES and CE. But the resin becomes more and more opaque with increased content of cPES, suggesting that a phase separation appears, especially in 20cPES/CE resin.

This phenomenon is further proved by the quantitative transparency illustrated by the UV-vis transmittance spectra of CE and cPES/CE resins shown in Fig. 8. Specifically, all spectra are similar, and the transmittance reduces under the same visible wavelength as the content of cPES increases. With the addition of 20 wt% cPES, the transmittance dramatically reduces from 65% (for CE resin) to around 50%, indicating the existence of the microphase separation with a large amount of cPES. The influence of cPES on the morphologies of cPES/CE resins can be further evaluated by the positions and shapes of Tg peaks in the loss factor-temperature curves from DMA tests as discussed in the later part of this paper.


image file: c5ra10670b-f8.tif
Fig. 8 UV-vis spectra of CE and cPES/CE resins.
3.2.2 Crosslinking density. Crosslinking density is an important index of characterizing the crosslinking network structure of a cured thermosetting resin,26 which is usually calculated using a classic semi-empirical equation based on the statistical theory of rubber elasticity.27,28 Fig. 9 shows the calculated crosslinking densities of CE and cPES/CE resins. As the content of cPES increases, the crosslinking density decreases, especially for 15cPES/CE and 20cPES/CE resins. This trend is derived from multi-factors, including the long chain segment of cPES and the reduced amount of striazine ring due to the co-reaction between –OCN group and cPES as discussed above.
image file: c5ra10670b-f9.tif
Fig. 9 Crosslinking densities of cured CE and cPES/CE resins.
3.2.3 Free volume. Free volume is an important aspect of aggregate state structure, reflecting the packing of the molecule of a matter.29 The key parameters of free volume include free cavity volume (Vh) and free volume fraction (fapp). The former directly relates to the average size of free volume, and the latter reflects the number of free volume sites.30 Fig. 10 presents Vh and fapp of cured CE and cPES/CE resins. Except 5cPES/CE, other cPES/CE resins have almost same Vh as CE resin; meanwhile, all cPES/CE resins have higher fapp values than CE resin. These results are derived from both positive and negative factors. The positive factor that increasing Vh and fapp values includes the nature of linear cPES and the reduced crosslinking density due to the presence of cPES as discussed above. On the other hand, the negative factor is mainly resulted from the influence of compatibility. When cPES and CE have good compatibility (the loading of cPES is small), the well-dispersed cPES chains can enter the free volume holes of CE matrix, leading to reduced free volume size (Fig. 11). When the concentration of cPES in the modified resin is large, cPES tends to form a separated phase, and thus weakening the negative influence. As a result, when the content of cPES is 5 wt%, the positive factor plays the dominant role, leading to the rise of Vh and fapp values; while the negative factor becomes more and more important as the loading of cPES increases.
image file: c5ra10670b-f10.tif
Fig. 10 Vh and fapp values of cured CE and cPES/CE resins.

image file: c5ra10670b-f11.tif
Fig. 11 Schematic diagrams of cPES/CE resin with small (a) or large (b) content of cPES.

3.3 Mechanical properties of cPES/CE resins

3.3.1 Impact properties. The impact resistance of a material reflects its ability to absorb the energy of a rapidly applied load, and the ability to withstand this sudden impact is related to the toughness of the material.31 Fig. 12 exhibits the impact strengths of cured CE and cPES/CE resins. All cPES/CE resins have obviously higher impact strengths than CE resin, the impact strength continuously increases as the content of cPES increases. Specifically, when the content of cPES reaches 15 wt%, the impact strength increases about 2 times. Note that the toughening effect of cPES is much outstanding than those of reported eTPs. For example, to get 2 times increasing of impact strength, the content of polyphenylene oxide should be as large as 30 wt%.32 With 20 wt% polyether sulfone, the modified epoxy resin shows the maximum impact strength, about 1.3 times of that of original epoxy resin.33 Therefore, cPES has super advantage in toughening CE resin, resulting from its influences on both chemical and aggregation structures. Briefly, the introduced flexible chain segment, reduced crosslinking density, increased free volume and the gradually obvious microphase separation with high loading of cPES are all responsible for the remarkable improved toughness of the cPES/CE resins.
image file: c5ra10670b-f12.tif
Fig. 12 Impact strengths of cured CE and cPES/CE resins.
3.3.2 Flexural properties. Flexural modulus is the ratio of flexural stress to the corresponding deformation, reflecting the ability to resist the flexural deformation in the elastic limit, and the ability is usually used to reflect the stiffness of a material.34 Fig. 13 shows the stress–time curves and the corresponding flexural strengths and moduli of CE and cPES/CE resins. As the content of cPES increases, the flexural modulus initially increases and reaches the maximum at 10 wt%, followed by a decrease. As we've known that the stiffness of a material in the glassy state is determined by the secondary valence forces, hence it is dependent on the packing density and concentration of the chain segments, or, the Vh and fapp values.35 As shown in Fig. 10, the Vh value has very small change, while the fapp value initially increases and then decreases, so this trend is followed by the flexural modulus.
image file: c5ra10670b-f13.tif
Fig. 13 The stress–time curves (a), and the dependence of the content of cPES on the flexural strength and modulus (b) of cured CE and cPES/CE resins.

Flexural strength is usually used to evaluate the integrated mechanical properties of a material because the flexural loading covers multiple loadings such as shearing, tensile and/or compressing loadings.36 Fig. 13b shows that all cPES/CE resins have higher flexural strengths than CE resin, while the flexural strength of the former is greatly dependent on the content of cPES, that is, initially increases and then reaches the maximum (146.9 MPa) at 10 wt% cPES, about 1.4 times of that of CE resin. Note that the enhancement of both toughness and stiffness can be obtained with a small loading of cPES. Generally, the increased flexural strength of materials primarily arises from the combination of the significant improvement in stiffness and toughness. Therefore, those factors that are beneficial to improve the stiffness and the toughness as described above can improve the flexural strength.

3.4 Thermal resistance of cPES/CE resins

Outstanding thermal resistance is the key property required by high performance resins, which includes the thermal decomposition behavior37 and Tg.38
3.4.1 Thermal degradation kinetics of cPES/CE resins. Based on the TG and DTG curves of CE and cPES/CE resins at different heating rates in a N2 atmosphere (Fig. 14), the corresponding thermal degradation kinetic parameters including the degrading activation energy (Ea), reaction order (n) and pre-exponential factor (A) were calculated using the Kissinger equation.39 As summarized in Table 2, the thermal decomposition of either original or modified CE resin contains two distinct stages divided by two DTG peaks. In the initial stage (or the 1st stage) of thermal degradation, all the Ea, n, and A values of cPES/CE resins are larger than those of CE resin; while an opposite trend is obtained in the 2nd degradation stage. These results suggest that the cPES/CE resin is more difficult to degrade than CE resin, but once the degradation starts, the thermal decomposition becomes easier (in the 2nd stage at high temperatures).
image file: c5ra10670b-f14.tif
Fig. 14 TG and DTG curves of CE, cPES and cPES/CE resins at different heating rates in an N2 atmosphere.
Table 2 The typical kinetic parameters of thermal degradation for CE, cPES and cPES/CE resins
Sample The 1st step The 2nd step
Ea1 (kJ mol−1) n1 ln[thin space (1/6-em)]A1 R1 Ea2 (kJ mol−1) n2 ln[thin space (1/6-em)]A2 R2
CE 201.40 2.6 25.38 0.9971 279.65 28.2 62.21 0.9976
5cPES/CE 216.46 3.3 28.14 0.9989 214.09 19.4 46.80 0.9933
10cPES/CE 223.65 3.6 28.95 0.9978 203.17 17.3 42.16 0.9801
15cPES/CE 204.64 3.6 25.97 0.9959 186.67 15.3 35.83 0.9820
20cPES/CE 202.65 3.8 25.47 0.9990 177.52 13.5 31.37 0.9869
cPES 256.61 8.3 42.16 0.9912


On the other hand, the kinetic parameters of thermal degradation are closely related to the content of cPES. As the content of cPES increases, the Ea value in the 1st stage gradually increases and reaches the maximum at 10 wt% cPES. This is attributed to the change in the structure induced by cPES. To be specific, when the content of cPES is small (≤10 wt%), its influence on the curing of CE is the catalytic effect; meanwhile the good compatibility between cPES and CE is beneficial to elaborate the good thermostability of cPES. However, as the content of cPES is large (≥15 wt%), cPES tends to form a separated phase (Fig. 7), and the separated cPES phase with excellent thermal stability does not play big effect on CE resin, resulting in a decreased Ea value.

In actual applications, the initial decomposition temperature (Tdi) is a more direct index for evaluating the thermal stability of a material.40 Fig. 14 shows that cPES/CE resins have almost the same Tdi values as CE resin, that is, the presence of cPES does not deteriorate the thermal stability of original CE resin.

3.4.2 Tg. The peak temperature of the loss factor (tan[thin space (1/6-em)]δ)–temperature plots based on DMA analyses is usually regarded as the Tg values of thermosetting resins.41 Fig. 15 shows the tan[thin space (1/6-em)]δ–temperature plots of CE and cPES/CE resins, the Tg values of CE and cPES/CE resins are summarized in Table S1 in ESI. The plot of either CE, 5cPES/CE or 10cPES/CE resin exhibits only one single peak centered at about 298, 295 or 290 °C, indicating that a small content of cPES has good compatibility with CE resin. However, as the content of cPES increases, the plot of 15cPES/CE exhibits a peak with a shoulder, and that of 20cPES/CE resin has two obvious peaks with some overlapping, suggesting that more cPES is not compatible with CE resin, and thus there is phase separation. This result is in good agreement of the digital photos shown in Fig. 7. Through peak-differentiating, it can be seen that the curve of either 15cPES/CE or 20cPES/CE resin is composed of two peaks, with the peak temperatures of 260–265 °C and 290–297 °C, corresponding to the cPES and CE resin, respectively, this confirms that cPES tends to form a separated phase when its content is large enough.
image file: c5ra10670b-f15.tif
Fig. 15 Overlay plots of loss factor-temperature for CE and cPES/CE resins.

In addition, the peak intensity of the tan[thin space (1/6-em)]δ– temperature curve is also an important parameter, reflecting the motion ability of polymer chain segments.42 A stronger peak means a greater ability of motion. As the peak intensities of all cPES/CE resins are smaller than that of CE resin, so the presence of cPES implements a hindering effect on the motion of polymer chains. This will bring effect on the performances of resins, especially dielectric properties that are sensitive to the motion of polymer chains as described below.

3.5 Dielectric properties of cPES/CE resins

It is well known that the extremely low dielectric constant and loss over a wide frequency range have been the most prominent advantage of CE resin compared with other thermally resistant TS resins,43 it is also the main reason that CE resin has great prospect in microelectronics field.44 Therefore, maintaining excellent dielectric properties is of great importance for toughening CE resin.

Fig. 16 shows the dielectric constant of cured CE and cPES/CE resins over a wide frequency range. It is noted that both CE and cPES/CE resins exhibit good frequency stability of dielectric constant. As cPES has much larger dielectric constant than CE resin, so the dielectric constants of cPES/CE resins are expected to be intervened between the values of CE and cPES. However, this expectation is not true, and cPES/CE resins have much smaller dielectric constant than the calculated values according to the additive law. It is known that the dielectric properties of polymers depend on the orientation and relaxation of dipoles in the applied electric field,45 and the process of dipole polarization accompanies the movement of polymer chain segments. As described in the DMA analyses, the addition of cPES plays a negative role in the movement of molecular chain, tending to decrease the dielectric constant.


image file: c5ra10670b-f16.tif
Fig. 16 Dependence of dielectric constant on frequency of cPES, CE and cPES/CE resins.

The overlay plots reflecting the dependence of the dielectric loss on frequency for cured CE resin and cPES/CE resins are depicted in Fig. 17. cPES has lower dielectric loss (around 0.003 at 100 Hz) than CE resin, and the presence of which hinders the chain movement, as a result, the dielectric loss of cPES/CE resin falls in the values of those of CE and cPES resins, and a larger content of cPES leads to decrease dielectric loss.


image file: c5ra10670b-f17.tif
Fig. 17 Dependence of the dielectric loss on frequency of cPES, CE and cPES/CE resins.

3.6 Flame retardancy and mechanism of cPES/CE resin

3.6.1 Flame retardancy. CONE test is an effective technique to evaluate the flame retardancy and simulate the real fire of a material in a laboratory.46 Table 3 summarizes typical CONE data of CE and cPES/CE resins. cPES/CE resins have much longer time to ignition (TTI) than CE resin, and the TTI value increases as the content of cPES increases, indicating that it becomes less flammable with the addition of cPES. Besides TTI, fire performance index (FPI) and fire growth index (FGI) are two important parameters for evaluating the fire hazard of a material, the former is always used to estimate the potential possibility of combustion,47 while the latter reflects the ability of a material to reduce the heat and fire risk.48 Table 3 shows that as the content of cPES in modified CE resin increases, the FPI (TTI/PHRR) value increases and FGI (PHRR/TPHRR) decreases, meaning that the addition provides the increased ability of increasing the time to flashover or the available time for escaping in a full-scale fire situation, but also the capacity of effectively reducing the risk of catching fire and the combustion intensity of the resin. Based on TTI, FPI and FGI values, it is reasonable to state that the flammability of CE resin is remarkably reduced with the addition of cPES.
Table 3 Typical parameters from CONE tests for CE and cPES/CE resins
  CE 5cPES/CE 10cPES/CE 15cPES/CE 20cPES/CE
TTI (s) 77 84 99 137 123
FPI (s* m2 kW−1) 0.203 0.220 0.241 0385 0.458
FGI (s* m2 kW−1) 2.561 2.496 2.076 1.588 1.599
PHRR (kW m−2) 379.0 381.8 410.9 355.7 268.8
AHRR (kW m−2) 92.3 92.5 125.3 172.9 151.8
THR (mJ m−2) 47.73 47.72 63.17 78.50 71.37
MLR (g s−1) 0.034 0.038 0.049 0.074 0.064
TSR (m2 m−2) 1078.5 1116.2 1048.4 2097.6 1893.0
TSP (m2) 9.5 9.9 9.3 18.5 16.7
SEA (m kg−1) 540.8 506.9 556.2 551.8 553.0
EHC (mJ kg−1) 24.0 21.7 23.3 20.7 20.8
CO yield (kg kg−1) 0.074 0.080 0.079 0.059 0.063
CO2 yield (kg kg−1) 1.644 1.568 1.633 1.460 1.489


The combustion process of a material can be investigated through the overlay plots of heat release rate (HRR) versus time for CE and cPES/CE resins (Fig. 18), which represents the intensity of combustion under the test conditions.49 As shown in Fig. 18, the curves of 5cPES/CE and 10cPES/CE resins have similar shapes as that of the CE resin; while those of 15cPES/CE and 20cPES/CE resins are obviously different, that is, a broad peak consisting of several peaks, the peak of heat release rate (PHRR) is lower. In addition, all resins have different total heat release (THR) values, the modified resin with larger content of cPES has bigger THR, illustrating that the addition of cPES increases the combustion intensity. Taking the TTI, FPI, FGI, PHRR and THR into consideration, we can conclude that the addition of cPES greatly reduces the flammability of CE resin, and the exothermic process becomes moderate from a single strong one, but the exothermic time is extended and the THR values are increased.


image file: c5ra10670b-f18.tif
Fig. 18 Overlay plots of dependence of HRR on time for CE and cPES/CE resins.

For many polymer materials, the origin behind the interesting HRR results may be closely related to the mass loss rate (MLR) during the whole combustion process. As shown in Fig. 19, 5cPES/CE and 10cPES/CE resins have almost equal initial decomposition time after ignition to CE resin, while the time is greatly delayed with the increase of the cPES loading (15, 20 wt%), this is consistent with the TTI values. In addition, it is noticed that the mass losses of 15cPES/CE and 20cPES/CE resins are smaller than those of CE resin in the initial 300 s, but the mass loss becomes larger as time goes on. Consequently, all cPES/CE resins have less residual chars at the end of combustion. The residual char of a polymer can prevent the burning of combustible materials derived from the degradation and the entrance of oxygen,50 hence the char plays an important role in the difference of the combustion behavior.


image file: c5ra10670b-f19.tif
Fig. 19 Dependence of normalized mass loss on time for CE and cPES/CE resins.

It has been widely reported that the flame retarding performance is dependent on the char yield and the compactness of the residual char.51 In order to investigate the impact of char on the flame retardancy, the structures of the chars for different systems were characterized. Fig. 20 shows the SEM images of the external and internal parts of residual chars after CONE tests. There are many loose holes in the external and internal parts of CE resin char, indicating that CE resin has poor ability of forming a stable char layer, and thus leading to the poor flame retardancy. But the chars of cPES/CE resins have smooth and dense surfaces with few holes; this compact and dense structure of 20cPES/CE is further characterized by the three-dimensional images of the super depth of field microscope char shown in Fig. 21. This is the reason why the cPES/CE resins maintain the basic shapes.


image file: c5ra10670b-f20.tif
Fig. 20 The SEM micrographs of the residual chars for CE ((a): external; (b): internal) and 20cPES/CE ((c): external; (d): internal) resins.

image file: c5ra10670b-f21.tif
Fig. 21 The three-dimensional super depth of field micrographs of the residual chars for CE (left) and 20cPES/CE (right) resins.

The release of smoke and poison gas is one important index of evaluating the flame retardancy of a material.52 Fig. 22 shows the overlay curves of smoke produce rate (SPR)–time for CE and cPES/CE resins, of which the dependence on the loading of cPES is similar to that of HRR curve. With small contents of cPES (5 and 10 wt%), cPES/CE resins have almost the same total smoke production (TSP) and total smoke release (TSR) values, while the SPR, TSP and TSR values obviously increase with the increased loadings of cPES (15 and 20 wt%), meaning that the smoke release can not be well controlled in cPES/CE resins. However, cPES/CE resins have lower yield of CO (Table 3), suggesting that the presence of cPES can reduce the release of poison gas.


image file: c5ra10670b-f22.tif
Fig. 22 Overlay plots of dependence of SPR on time for CE and cPES/CE resins.
3.6.2 Flame retarding mechanism. Previous studies have preliminarily confirmed that the ability of char yield is a key factor to the flame retardancy of a polymer. To intensively study the morphology change during heating, the photos of CE and 20cPES/CE resins that had maintained at a preset temperature for 15 min in a muffle furnace were taken. As shown in Fig. 23, CE resin cannot retain its shape, and its volume significantly enlarges at the temperatures higher than 300 °C; as the temperature further increases (≥450 °C), the volume remarkably decreases, so does the weight (Fig. 24); moreover, it becomes a “shell” made up of many holes, suggesting that the carbon produced during the decomposition does not form a compact layer, and thus the resin cannot be well protected; when the temperature is higher than 600 °C, the resin decomposes completely (Fig. 24). 20cPES/CE resin exhibits different phenomenon. Specifically, when the temperature is lower than 450 °C, 20cPES/CE resin almost retains the regular shape with only a slight expansion, and the residual mass is much larger than that of CE resin (Fig. 24); however, the weight and volume obviously decrease as the temperature increases to 500 °C, even lower than those of CE resin, and finally only some white substances are left when the temperature is higher than 550 °C.
image file: c5ra10670b-f23.tif
Fig. 23 Digital photos of CE and 20cPES/CE resins after being maintained at different temperatures for 15 min in a muffle furnace.

image file: c5ra10670b-f24.tif
Fig. 24 Residual weights of the chars of CE and 20cPES/CE resins after being maintained at different temperature for 15 min in a muffle furnace.

Fig. 25 gives the FTIR spectra of CE and 20cPES/CE resins after being maintained at different temperatures for 15 min in a muffle furnace. It is noticed that the absorption peaks attributing to the triazine ring (1563, 1360 cm−1) and the aromatic ether group (1013 cm−1)53 of CE resin begin to weaken at 350 °C, and the intensity is more and more weaker as the temperature further increases. Moreover, all the characteristic peaks almost vanish when the temperature reaches 550 °C, suggesting that CE resin initially degrades since 350 °C, and a complete decomposition takes place at about 550 °C. For 20cPES/CE resin, the absorption peaks of characteristic triazine ring and aromatic ether group begin to weaken at 400 °C, demonstrating the enhanced thermostability with the addition of cPES. It is worth noting that the white substance at high temperature (≥550 °C) is proved to be cPES by the appearance of the vibration peaks assigning to C–S– (684 cm−1) and S[double bond, length as m-dash]O bonds (1162, 1124 cm−1)54 shown in FTIR spectra (Fig. 25).


image file: c5ra10670b-f25.tif
Fig. 25 FTIR spectra of the chars of CE resin and 20cPES/CE resins after maintained at different temperature for 15 min in a muffle furnace.

To obtain more information of the flame retarding mechanism, TG-IR spectra of pyrolysis products of CE and cPES/CE resins in a N2 atmosphere were recorded. Fig. 26 shows the three-dimensional FTIR spectra of gaseous volatiles evolved during the whole combustion processes of CE and cPES/CE resins. As same parameters including the size, shape and weight of samples were used for tests, so the absorption intensity of peaks can be used to evaluate the relative amount of the pyrolysis products. It can be seen that the CE resin releases the maximum amount of products, while cPES has the fewest amount. Additionally, as the content of cPES increases, fewer and fewer amount of pyrolysis products is released. This statement is also confirmed by the TG curve (Fig. 27).


image file: c5ra10670b-f26.tif
Fig. 26 Three-dimensional FTIR spectra of the gaseous volatiles evolved during the combustion processes of CE, cPES and cPES/CE resins in a N2 atmosphere.

image file: c5ra10670b-f27.tif
Fig. 27 TG and DTG curves of CE and cPES/CE resins during the thermal degradation for CE, cPES and cPES/CE resins.

Fig. 28 gives the FTIR spectra of each sample at typical temperatures, including Tdi, the temperature of the maximum degradation rate (Tmax). For CE resin, a slight absorption peaks assigning to carbonyl-containing compounds (1500–1700 cm−1)55 and CO2 (2300–2400 cm−1)56 are observed when the temperature reaches 300 °C. These peaks are greatly enhanced and more peaks attributing to O–H bond (3750, 3653, and 1259 cm−1, relating to H2O generation),57 aromatic compounds (1511, 1607, and 3017 cm−1),56 aliphatic components (2972, 1259, and 748 cm−1)55 and nitrogen compounds (1179 cm−1)58 appear when the temperature increases to 431 °C (Tdi). Specifically, these peaks reach the maximum values at 442 °C (Tmax) and then gradually weaken when the temperature is higher than 500 °C. In addition, the peak attributing to the C–N bond (965 and 927 cm−1)57,59 appears at 500 °C, and weakens as the temperature increases. The C–H peak (2800–3100 cm−1)60 reaches the maximum intensity at 442 °C (Tmax), and then disappears at 550 °C.


image file: c5ra10670b-f28.tif
Fig. 28 FTIR spectra of volatilized products at typical temperatures during the thermal degradation for CE, cPES and cPES/CE resins.

For the FTIR spectra of cPES, the absorption peak assigning to CO2 appears when the temperature is as high as 484 °C (Tdi), and almost disappears at 600 °C. It is worth noting that the C–H peak is still obvious at 600 °C; moreover, the peaks of aromatic compounds (1511, 1607, and 3017 cm−1) and aliphatic components (2972, 1259, and 748 cm−1) are still observed when the temperature is higher than 700 °C, demonstrating that the pyrolysis products still have rich compositions at high temperature, that is, cPES has great thermostability.

Compared with CE resin, cPES/CE resin has similar FTIR spectra of volatilized products, but there are still some differences with different loadings of cPES. Specifically, no peak is observed until the temperature reaches Tdi with small content of cPES (5 and 10 wt%), suggesting that the decomposition of CE resin has been delayed because of the presence of cPES. Meanwhile, the absorption peak assigning to CO2 almost disappears at 600 °C. However, further increasing the content of cPES to 15 or 20 wt%, the absorption peak assigning to CO2 can be observed at 300 °C, and which still exists at higher temperatures. The phenomenon may be ascribed to the influence of cPES content on the structure of the crosslinked network. On one hand, as the content of cPES increases, the influence of cPES on the curing of CE changes from catalyzing the cyclotrimerization of –OCN groups to the coexistence of catalysis and copolymerization between cPES and CE; meanwhile, the morphology changes from homogenously single phase to multi-phase. Note that, no new spectra appear in the FTIR spectra of pyrolysis products of cPES/CE resins compared with that of CE resin, so it is reasonable to state that the flame retarding mechanism mainly comes from the condensed phase.

4. Conclusions

A novel toughened CE resin with simultaneously improved integrated performances was developed through facilely melt-blending with cPES, showing good processing characteristics. Compared with CE resin, the cPES/CE resins with suitable contents of cPES are homogenous single phase, and show improved integrated performances including impact strength, flexural properties, dielectric properties and thermal-stability. The flame retardancy of cPES/CE resins is special, the addition of cPES extends the TTI, moreover, provides the increased ability of increasing the time to flashover or the available time for escaping in a full-scale fire situation, and also the capacity of effectively reducing the risk of catching fire and the combustion intensity of the resin; however, once ignited, cPES/CE resins have stronger intensity of combustion. All these results can be contributed to the influence of the cPES content on the chemical and aggregation structures of the crosslinked structure.

Acknowledgements

We thank National Natural Science Foundation of China (21274104), the Priority Academic Program Development of Jiangsu Higher Education Institutions (PAPD) for financially supporting this project.

References

  1. J. W. Kim, G. Sauti, E. J. Siochi, J. G. Smith, R. A. Wincheski, R. J. Cano, J. W. Connell and K. E. Wise, ACS Appl. Mater. Interfaces, 2014, 6, 18832 CAS.
  2. D. X. Zhuo, A. J. Gu, G. Z. Liang, J. T. Hu, L. Yuan and X. X. Chen, J. Mater. Chem., 2011, 21, 6584 RSC.
  3. Y. N. Tang, L. Yuan, G. Z. Liang and A. J. Gu, RSC Adv., 2014, 4, 16136 RSC.
  4. M. F. Zeng, X. D. Sun, X. D. Yao, Y. Wang, M. Z. Zhang, B. Y. Wang and C. Z. Qi, J. Appl. Polym. Sci., 2010, 115, 338 CrossRef CAS PubMed.
  5. K. Wang, G. M. Zhu, L. Niu, Y. K. Wang and Z. Liu, J. Polym. Res., 2014, 21, 21 Search PubMed.
  6. J. A. Marins, A. Mija, J. M. Pin, F. Giulieri, B. G. Soares, N. Sbirrazzuoli, P. Lançon and G. Bossis, Compos. Sci. Technol., 2015, 112, 34 CrossRef CAS PubMed.
  7. Z. N. Hu, J. Zhang, H. P. Wang, T. Li, Z. Y. Liu and Y. F. Yu, RSC Adv., 2014, 4, 34927 RSC.
  8. Y. Feng, Z. P. Fang and A. J. Gu, Polym. Adv. Technol., 2004, 15, 628 CrossRef CAS PubMed.
  9. A. Ganesan and S. Muthusamy, Polym. Compos., 2009, 30, 782 CrossRef CAS PubMed.
  10. K. H. Ding, G. L. Wang and M. Zhang, Mater. Des., 2011, 32, 3986 CrossRef CAS PubMed.
  11. M. Thunga, M. Akinc and M. R. Kessler, eXPRESS Polym. Lett., 2014, 8, 336 CrossRef CAS.
  12. J. Zhang, T. Li, Z. N. Hu, H. P. Wang and Y. F. Yu, RSC Adv., 2014, 4, 442 RSC.
  13. P. Jyotishkumar, P. Moldenaers, S. M. George and S. Thomas, Soft Matter, 2012, 8, 7452 RSC.
  14. L. Wang, X. Shui, X. X. Zheng, X. Zheng, J. C. You and Y. J. Li, Compos. Sci. Technol., 2014, 93, 46 CrossRef CAS PubMed.
  15. Y. W. Di, A. Damore, G. Marino, L. Nicolals and B. Y. Li, J. Appl. Polym. Sci., 1995, 57, 989 CrossRef CAS PubMed.
  16. L. S. Wu and J. F. Sun, Appl. Surf. Sci., 2014, 322, 101 CrossRef CAS PubMed.
  17. Z. Y. Zhang, L. Yuan, G. Z. Liang, A. J. Gu, Z. X. Qiang, C. W. Yang and X. X. Chen, J. Mater. Chem. A, 2014, 2, 4975 CAS.
  18. M. Ariraman, R. S. kumar and M. Alagar, RSC Adv., 2014, 4, 57759 RSC.
  19. M. M. Zhang, H. X. Yan, X. W. Yang and C. Liu, RSC Adv., 2014, 4, 45930 RSC.
  20. R. Hardis, J. L. P. Jessop, F. E. Peters and M. R. Kessler, Composites, Part A, 2014, 49, 100 CrossRef PubMed.
  21. X. Fermàndez-Francos, X. Ramis and À. Serra, J. Polym. Sci., Part A: Polym. Chem., 2014, 52, 61 CrossRef PubMed.
  22. H. Y. Jiang, T. L. Chen, S. Q. Bo and J. P. Xu, Macromolecules, 1997, 30, 7345 CrossRef CAS.
  23. D. X. Zhuo, A. J. Gu, Y. Z. Wang, G. Z. Liang, J. T. Hu, L. Yuan and W. Yao, Polym. Adv. Technol., 2012, 23, 1121 CrossRef CAS PubMed.
  24. C. Lin, L. Yuan, A. J. Gu, F. Chen and G. Z. Liang, Compos. Sci. Technol., 2013, 85, 148 CrossRef CAS PubMed.
  25. F. Ren, G. M. Zhu, P. G. Ren, Y. K. Wang and X. P. Cui, Appl. Surf. Sci., 2014, 316, 549 CrossRef CAS PubMed.
  26. M. Yoonessi, M. Lebrón-Colón, D. Scheiman and A. M. Michael, ACS Appl. Mater. Interfaces, 2014, 6, 16621 CAS.
  27. K. S. S. Kumar, C. P. R. Nair and K. N. Ninan, Eur. Polym. J., 2009, 45, 494 CrossRef CAS PubMed.
  28. W. K. Goertzen and M. R. Kessler, Composites, Part A, 2008, 39, 761 CrossRef PubMed.
  29. T. Oka, N. Oshima, R. Suzuki, A. Uedono, M. Fujinami and Y. Kobayashi, Appl. Phys. Lett., 2012, 101, 203108 CrossRef PubMed.
  30. C. Hugenschmidt and H. Ceeh, J. Phys. Chem. B, 2014, 118, 9356 CrossRef CAS PubMed.
  31. C. H. Li, S. Yang, J. F. Wang, J. W. Guo, H. Wu and S. Y. Guo, RSC Adv., 2014, 4, 55119 RSC.
  32. R. Gao, A. J. Gu, G. Z. Liang, S. K. Dai and L. Yuan, J. Appl. Polym. Sci., 2011, 121, 1675 CrossRef CAS PubMed.
  33. G. Yang, B. Zheng, J. P. Yang, G. S. Xu and S. Y. Fu, J. Polym. Sci., Part A: Polym. Chem., 2008, 46, 612 CrossRef CAS PubMed.
  34. J. Hoffman, J. Middleton and M. Kumosa, Compos. Sci. Technol., 2015, 106, 141 CrossRef CAS PubMed.
  35. D. X. Zhuo, A. J. Gu, G. Z. Liang, J. T. Hu, L. Yuan and L. F. Ji, Polym. Int., 2011, 60, 1277 CrossRef CAS PubMed.
  36. C. S. Dong and I. J. Davies, Mater. Des., 2014, 54, 955 CrossRef CAS PubMed.
  37. S. Liu, H. Q. Yan, Z. P. Fang and H. Wang, Compos. Sci. Technol., 2014, 90, 40 CrossRef CAS PubMed.
  38. J. Michels, R. Widmann, C. Czaderski, R. Allahvirdizadeh and M. Motavalli, Composites, Part B, 2015, 77, 484 CrossRef CAS PubMed.
  39. L. T. Vlaev, I. G. Markovska and L. A. Lyubchev, Thermochim. Acta, 2003, 406, 1 CrossRef CAS.
  40. I. Blanco, L. Abate, F. A. Bottino and P. Bottino, Polym. Degrad. Stab., 2014, 102, 132 CrossRef CAS PubMed.
  41. H. W. Cui and S. W. Kuo, Appl. Clay Sci., 2014, 91, 1 CrossRef PubMed.
  42. A. Etaati, S. Pather, Z. P. Fang and H. Wang, Composites, Part B, 2014, 62, 19 CrossRef CAS PubMed.
  43. M. Ariraman, R. S. Kumar and M. Alagar, RSC Adv., 2014, 4, 57759 RSC.
  44. A. J. Gu, Compos. Sci. Technol., 2006, 66, 1749 CrossRef CAS PubMed.
  45. X. H. Zhang, G. Z. Liang, J. F. Chang, A. J. Gu, L. Yuan and W. Zhang, Carbon, 2012, 50, 4995 CrossRef CAS PubMed.
  46. Y. Y. Fu, S. Lu, K. Y. Li, C. C. Liu, X. D. Cheng and H. P. Zhang, J. Power Sources, 2015, 273, 216 CrossRef CAS PubMed.
  47. X. X. Chen, L. Yuan, Z. Y. Zhang, G. Z. Liang and A. J. Gu, Composites, Part B, 2015, 71, 96 CrossRef CAS PubMed.
  48. L. Liu, J. Hu, J. L. Zhuo, C. M. Jiao, X. L. Chen and S. X. Li, Polym. Degrad. Stab., 2014, 104, 87 CrossRef CAS PubMed.
  49. G. P. Cai, J. X. Feng, J. Zhu and C. A. Wilkie, Polym. Degrad. Stab., 2014, 99, 204 CrossRef CAS PubMed.
  50. W. Q. Jin, L. Yuan, G. Z. Liang and A. J. Gu, ACS Appl. Mater. Interfaces, 2014, 6, 14931 CAS.
  51. S. Liu, H. Q. Yan, Z. P. Fang, Z. H. Guo and H. Wang, RSC Adv., 2014, 4, 18652 RSC.
  52. H. F. Pan, W. Wang, Y. Pan, L. Song, Y. Hu and M. L. Kim, ACS Appl. Mater. Interfaces, 2015, 7, 101 CAS.
  53. P. Bartolomeo, J. F. Chailan and J. L. Vernet, Eur. Polym. J., 2001, 37, 659 CrossRef CAS.
  54. C. H. Lin, J. C. Chen, C. M. Huang, J. M. Jehng, H. C. Chang, T. Y. Juang and W. C. Su, Polymer, 2013, 54, 6936 CrossRef CAS PubMed.
  55. C. W. Yang, G. Z. Liang, A. J. Gu and L. Yuan, Ind. Eng. Chem. Res., 2013, 52, 15075 CrossRef CAS.
  56. X. L. Chen, L. L. Huo, C. M. Jiao and S. X. Li, J. Anal. Appl. Pyrolysis, 2013, 100, 186 CrossRef CAS PubMed.
  57. Q. L. Tai, R. K. K. Yuen, W. Yang, Z. H. Qiao, L. Song and Y. Hu, Composites, Part A, 2012, 43, 415 CrossRef CAS PubMed.
  58. Q. L. Tai, R. K. K. Yuen, L. Song and H. D. Lu, J. Mater. Chem., 2011, 21, 6621 RSC.
  59. J. Z. Xu, R. Ma, Y. H. Jiao, J. X. Xie, R. Wang and L. Su, J. Macromol. Sci., Part B: Phys., 2011, 50, 897 CrossRef CAS PubMed.
  60. K. Wu, Y. K. Zhang, K. Zhang, M. M. Shen and Y. Hu, J. Anal. Appl. Pyrolysis, 2012, 94, 196 CrossRef CAS PubMed.

Footnote

Electronic supplementary information (ESI) available: The Tg values of CE and cPES/CE resins. See DOI: 10.1039/c5ra10670b

This journal is © The Royal Society of Chemistry 2015
Click here to see how this site uses Cookies. View our privacy policy here.