
 Open Access Article
 This Open Access Article is licensed under a
 Creative Commons Attribution 3.0 Unported Licence
Porphyrin containing lipophilic amide groups as a photosensitizer for dye-sensitized solar cells†
J.
Gasiorowski
a,
N.
Pootrakulchote
b,
C.
Reanprayoon
c,
K.
Jaisabuy
d,
P.
Vanalabhpatana
d,
N. S.
Sariciftci
a and
P.
Thamyongkit
*d
aLinz Institute for Organic Solar Cells (LIOS), Institute of Physical Chemistry, Johannes Kepler University of Linz, Linz 4040, Austria
bDepartment of Chemical Technology, Faculty of Science, Chulalongkorn University, Bangkok 10330, Thailand
cProgram in Petrochemistry and Polymer Science, Faculty of Science, Chulalongkorn University, Bangkok 10330, Thailand
dDepartment of Chemistry, Faculty of Science, Chulalongkorn University, Bangkok 10330, Thailand. E-mail: patchanita.v@chula.ac.th; Fax: +66-2-254-1309; Tel: +66-2-218-7587
First published on 11th August 2015
Abstract
In this study, synthesis and investigation of a novel zinc-porphyrin derivative bearing C24-containing amide groups for potential use in dye-sensitized solar cells (DSSCs) are presented. According to absorption spectra and electrochemical data, the target porphyrin has appropriate highest occupied molecular orbital (HOMO) and lowest unoccupied molecular orbital (LUMO) energy levels. The device studies revealed that the DSSCs based on the target porphyrin exhibited higher light harvesting efficiency in the Q-band region and an increased photocurrent, compared to the DSSCs based on a benchmark derivative bearing no alkyl amide groups on the meso-phenyl substituents. The optimum DSSC based on the target porphyrin gave a short-circuit photocurrent density (Jsc), an open-circuit voltage (Voc) and a fill factor (FF) of 5.6 mA cm−2, 0.7 V and 0.78, respectively, with an overall power conversion efficiency (PCE) of 3.1%.
Introduction
With their large molar absorption coefficients, and amenability to structural modifications for tuning of the electrochemical and photophysical properties, porphyrin derivatives have attracted interest in the field of organic optoelectronics.1 Since the great success in developing a porphyrin-based dye-sensitized solar cell (DSSC) with a power conversion efficiency (PCE) of 12.3% in 2011,2 intensive efforts have been made towards the design and development of novel porphyrins to enhance the cell efficiency. In the operation of DSSCs, one of the critically undesirable pathways is charge recombination between the photo-injected electron at TiO2 and the oxidized dye and/or electrolyte. Ballester and Palomares et al. reported the suppression of the recombination between the photo-injected electron at TiO2 and the electrolyte in the DSSCs by using a porphyrin dye bearing C5 alkyl groups on the meso-phenyl substituents.3 Moreover, the sizable linear alkyl chains were reported to form a hydrophobic layer covering the dye layer, resulting in a higher stability of the DSSCs.4 The alkyl chains also have a self-assembly property that can give a well-organized surface coverage of the dyes on the TiO2 films and efficient electron injection.5 In this work, we aim to synthesize and investigate a novel zinc-porphyrin bearing three C24-containing amide groups, and a carboxyl group at the para positions of the meso-phenyl substituents for its potential use in DSSCs. The C24 alkyl chain was used in this study as a representative of the long linear alkyl chains. An amide group was chosen to be a linker between the porphyrin macrocycle and the C24 alkyl meso-substituents because it is known as a robust functional group that can be readily formed. Furthermore, the amide group was demonstrated to promote self assembly in the dye layers of the organic solar cells by hydrogen bonding.6 The photophysical and electrochemical properties of the target molecule, and the effect of the C24-containing amide groups on the DSSC performance will give useful guidelines for the introduction of long alkyl chains into porphyrinic photosensitizing systems in DSSCs.Experimental section
Materials and methods
All chemicals were analytical grade, purchased from commercial suppliers and used as received without further purification. 1H-Nuclear Magnetic Resonance (NMR) and 13C-NMR spectra were obtained in deuterated chloroform (CDCl3) using an NMR spectrometer operated at 400 megahertz (MHz) for 1H and 100 MHz for 13C nuclei. Chemical shifts (δ) are reported in parts per million (ppm) relative to the residual CHCl3 peak (7.26 ppm for 1H-NMR and 77.0 ppm for 13C-NMR). Coupling constants (J) are reported in Hz. Mass spectra were obtained by matrix-assisted laser desorption ionization mass spectrometry (MALDI-MS) using dithranol as a matrix. Absorption and emission spectra of the solutions were measured in toluene at room temperature and an absorption extinction coefficient (ε) was reported in M−1 cm−1. The absorption of the porphyrin film on TiO2 was recorded at room temperature by using the same TiO2 film as a blank.Non-commercial compound
Porphyrin 4 was prepared following a literature procedure.7Synthesis of tetracosan-1-amine (3)
Following a published method8 with a modified reaction time and work-up procedure, a mixture of lignoceric acid (1, 1.002 g, 2.718 mmol) and thionyl chloride (1.800 g, 15.13 mmol) in tetrahydrofuran (THF, 4 mL) was refluxed for 1 h. The remaining thionyl chloride was removed under reduced pressure to obtain an orange brown oil containing tetracosanoyl chloride, which was treated with a cold aqueous ammonia solution (25% w/w, 20 mL) at room temperature. After 3 h, the mixture was extracted with CH2Cl2 (3 × 50 mL). The organic phase was collected and dried over anhydrous magnesium sulfate. After the removal of solvent under reduced pressure, the resulting yellow crude product was treated with hexane (30 mL). The mixture was then sonicated for 10 min and placed in a refrigerator (4 °C) overnight for precipitation. The resulting precipitate was filtered and washed with cold hexane and dried under vacuum to obtain tetracosanamide (2) as a colorless solid (0.802 g, 80%). 1H-NMR δ 0.87 (t, J = 6.8 Hz, 3H), 1.03–1.45 (m, 30H), 1.51–1.67 (m, 4H), 1.72–1.91 (m, 4H), 2.29 (t, J = 8.0 Hz, 2H), 3.53–3.60 (t, J = 6.4 Hz, 2H), 4.05–4.12 (t, J = 6.4 Hz, 2H); 13C-NMR δ 14.1, 22.7, 25.0, 26.1, 29.15, 29.18, 29.3, 29.4, 29.5, 29.6, 29.65, 29.69, 31.9, 34.3, 44.4, 63.3, 173.9; MALDI-TOF-MS m/z obsd 367.934 [M+], calcd 367.652 (M = C24H49NO).A solution of compound 2 (0.802 g, 2.18 mmol) in diethyl ether (20 mL) was treated with LiAlH4 (0.805 g, 21.2 mmol) at 0 °C and the reaction was continued at room temperature for 17 h. After that, the reaction was quenched by adding water (1.00 mL), 15% NaOH (1.00 mL) and then water (3.00 mL). The mixture was filtered and the resulting filtrate was concentrated under reduced pressure, leading to tetracosan-1-amine (3) as a colorless solid (0.515 g, 67%). 1H-NMR δ 0.82–0.97 (m, 11H), 1.00–1.49 (m, 18H), 1.49–1.63 (m, 8H), 1.63–1.77 (m, 2H), 1.77–1.96 (m, 2H), 2.67 (t, J = 6.8 Hz, 2H), 3.63 (m, 8H); 13C-NMR δ 14.1, 22.7, 25.8, 26.9, 29.35, 29.44, 29.5, 29.6, 29.7, 31.9, 32.8, 33.8, 42.2, 63.0; MALDI-TOF-MS m/z obsd 353.835 [M+], calcd 353.668 (M = C24H51N).
Synthesis of Zn-5
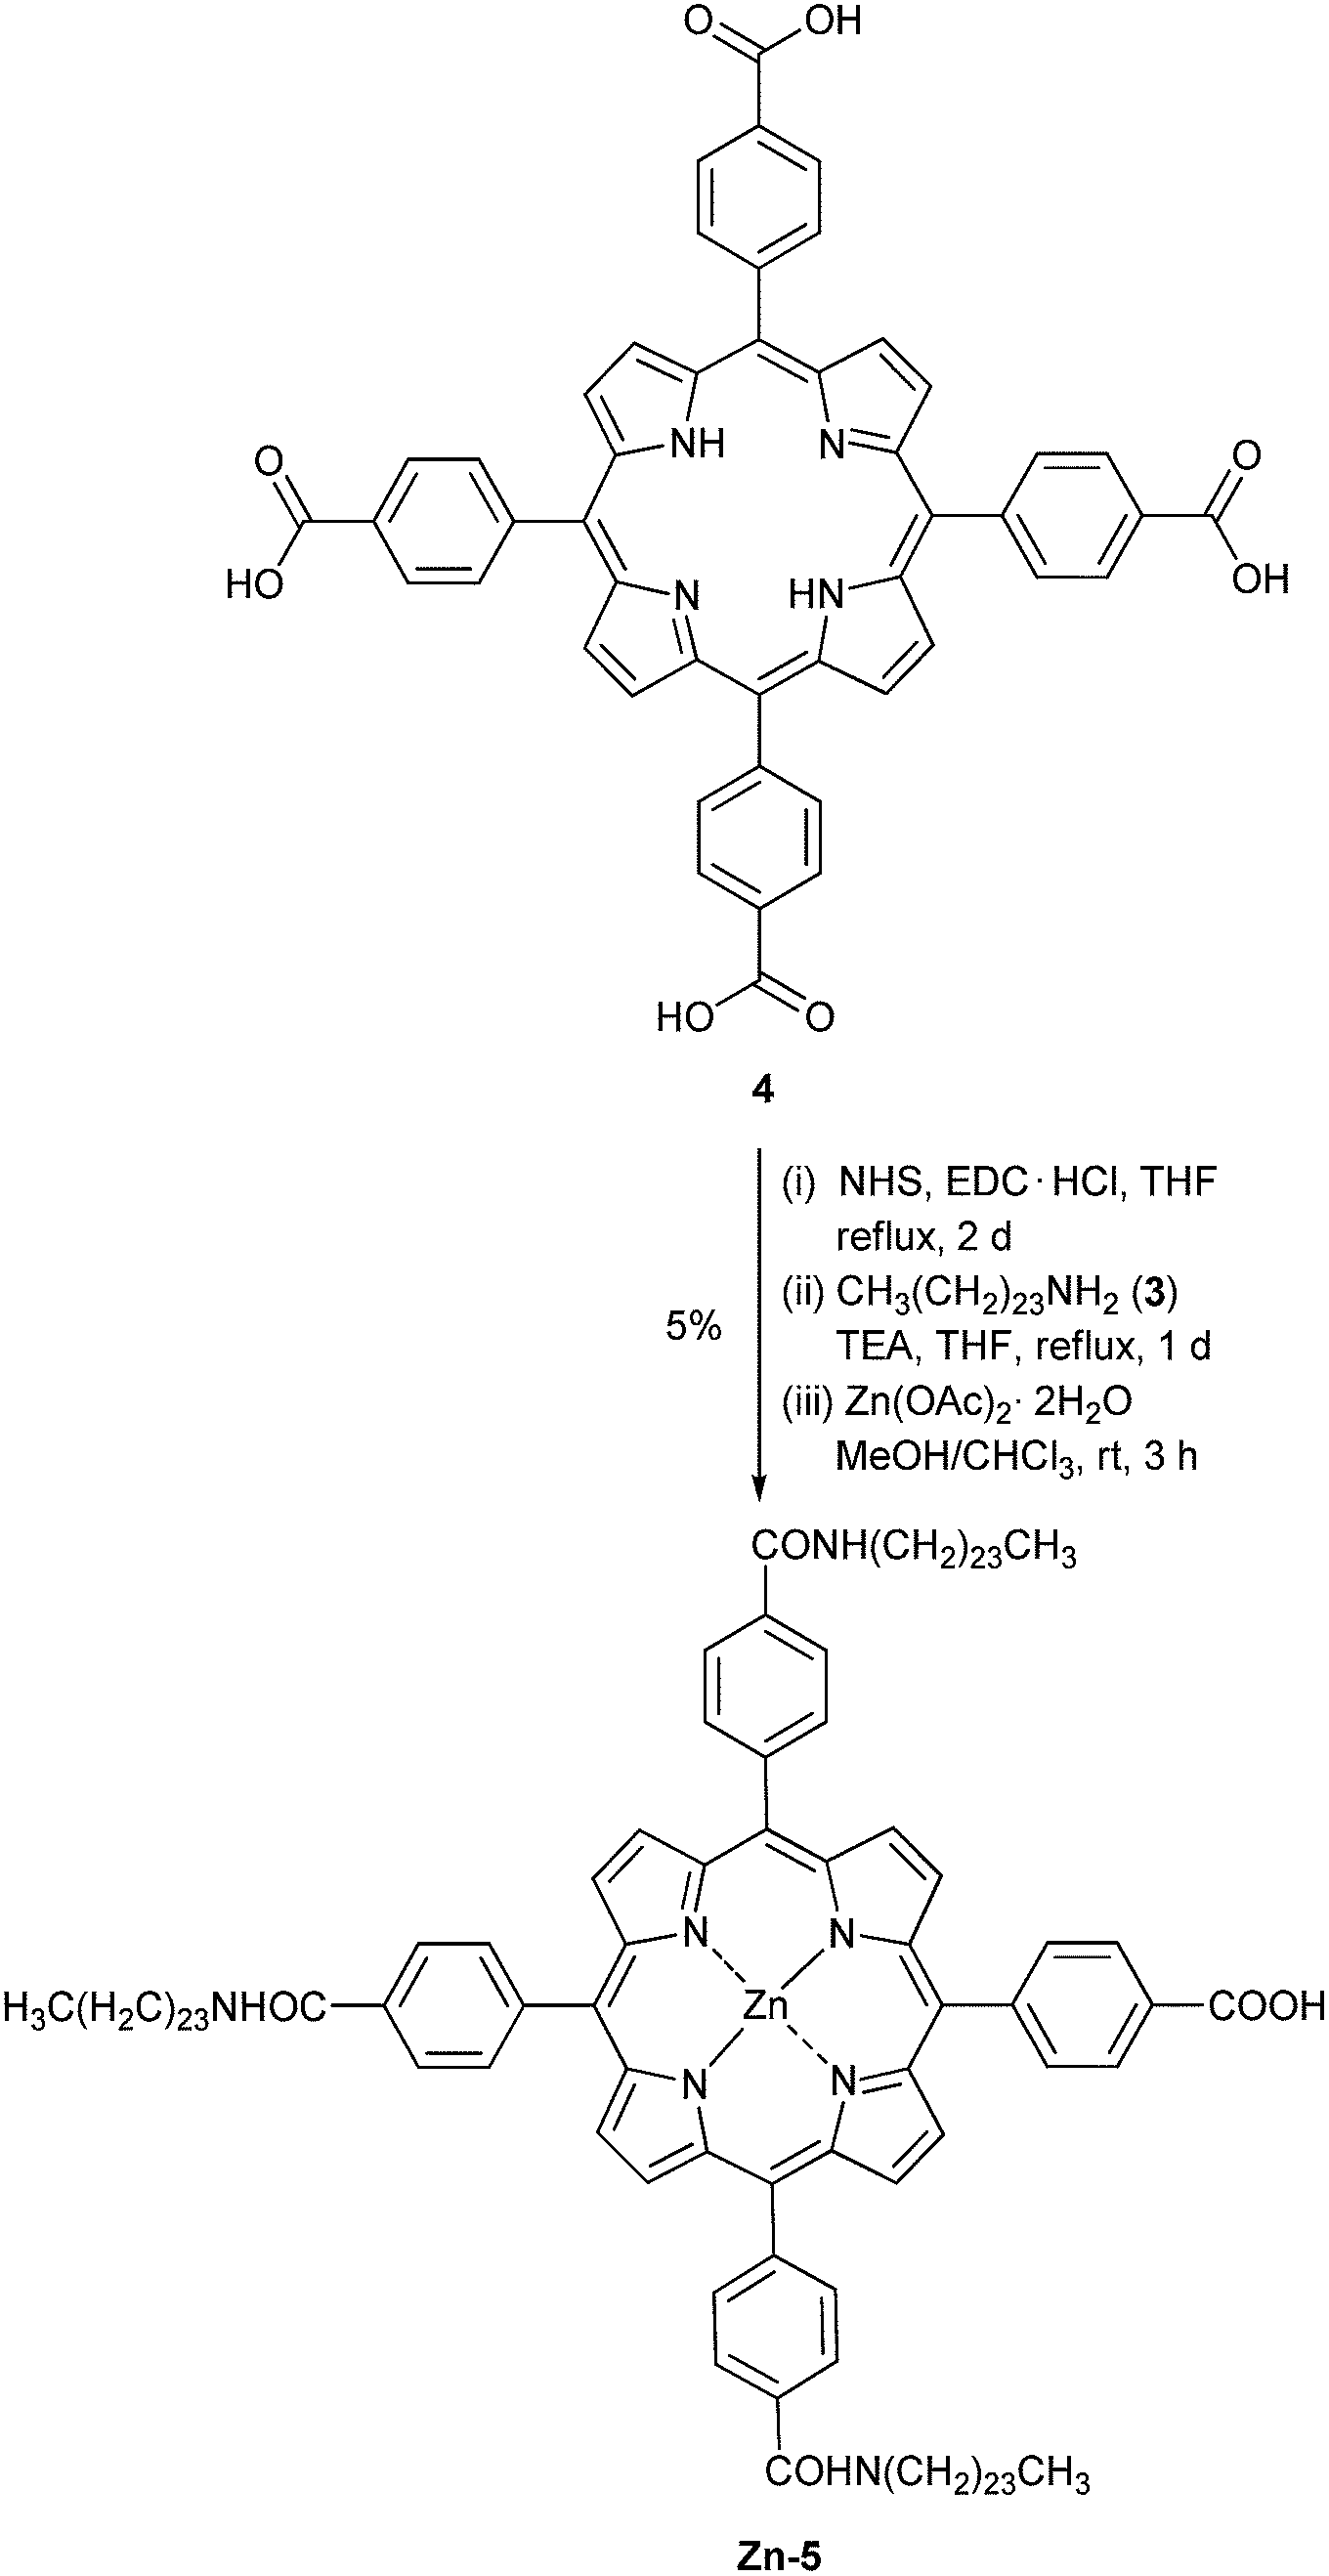
Following a previously reported procedure9 with modified stoichiometry, a solution of porphyrin 47 (0.149 g, 0.188 mmol) in THF (10 mL) was treated with N-hydroxysuccinimide (NHS, 0.217 g, 1.88 mmol, 10 equiv.) and 1-ethyl-3-(3-dimethylaminopropyl)carbodiimide hydrochloride (EDC·HCl, 0.432 g, 2.26 mmol, 12 equiv.). The reaction mixture was stirred at refluxing temperature for 2 d and then the solvent was removed under reduced pressure. The crude mixture was redissolved in THF (10 mL) and the resulting solution was treated with compound 3 (0.815 g, 2.30 mmol, 12 equiv.) and triethylamine (TEA, 5 mL). The reaction mixture was stirred at refluxing temperature for 1 d and then the solvent was removed under reduce pressure. Column chromatography [silica, CH2Cl2![[thin space (1/6-em)]](https://www.rsc.org/images/entities/char_2009.gif) :EtOH:TEA (96:3:1)] afforded a crude product containing compound 5: MALDI-TOF-MS m/z obsd 1800.122 [M+], calcd 1797.733 (M = C120H177N7O5). Following a previously published procedure,10 a solution of compound 5 in chloroform (3 mL) was reacted with a solution of zinc acetate dihydrate (0.045 g, 0.206 mmol) in methanol (1 mL) at room temperature for 3 h. After that, the resulting mixture was extracted by CH2Cl2 and H2O. The organic phase was dried over anhydrous magnesium sulfate and concentrated under reduced pressure. The resulting solid was washed with hexane and then methanol to afford compound Zn-5 as a purple solid (0.016 g, 5% from compound 4). Mp > 230 °C (from methanol); 1H-NMR δ 0.81–0.92 (m, 12H), 1.15–1.59 (m, 81H), 1.68–1.83 (m, 6H), 1.85–2.60 (m, 30H), 3.36–3.78 (m, 18H), 6.43–6.51 (m, 3H), 8.09–8.18 (m, 6H), 8.20–8.30 (m, 8H), 8.40–8.52 (m, 2H), 8.74–8.87 (m, 8H); 13C-NMR δ 8.0, 8.1, 8.6, 11.1, 12.0, 14.0, 19.1, 22.6, 23.8, 25.5, 27.1, 27.7, 28.3, 28.6, 28.8, 29.0, 29.2, 29.4, 29.6, 29.8, 31.8, 39.6, 40.3, 42.2, 45.8, 52.9, 58.05, 58.09, 63.2, 65.2, 67.5, 67.9, 70.5, 119.2, 119.3, 120.2, 125.4, 127.9, 131.3, 134.2, 134.4, 134.5, 141.2, 144.6, 144.8, 144.9, 167.4, 170.9; MALDI-TOF-MS m/z obsd 1862.492 [M+], calcd 1861.127 (M = ZnC120H175N7O5); λabs (ε) 426 (3.2 × 10⁵), 556, 597; λem (λex = 426 nm) 605, 651 nm.
:EtOH:TEA (96:3:1)] afforded a crude product containing compound 5: MALDI-TOF-MS m/z obsd 1800.122 [M+], calcd 1797.733 (M = C120H177N7O5). Following a previously published procedure,10 a solution of compound 5 in chloroform (3 mL) was reacted with a solution of zinc acetate dihydrate (0.045 g, 0.206 mmol) in methanol (1 mL) at room temperature for 3 h. After that, the resulting mixture was extracted by CH2Cl2 and H2O. The organic phase was dried over anhydrous magnesium sulfate and concentrated under reduced pressure. The resulting solid was washed with hexane and then methanol to afford compound Zn-5 as a purple solid (0.016 g, 5% from compound 4). Mp > 230 °C (from methanol); 1H-NMR δ 0.81–0.92 (m, 12H), 1.15–1.59 (m, 81H), 1.68–1.83 (m, 6H), 1.85–2.60 (m, 30H), 3.36–3.78 (m, 18H), 6.43–6.51 (m, 3H), 8.09–8.18 (m, 6H), 8.20–8.30 (m, 8H), 8.40–8.52 (m, 2H), 8.74–8.87 (m, 8H); 13C-NMR δ 8.0, 8.1, 8.6, 11.1, 12.0, 14.0, 19.1, 22.6, 23.8, 25.5, 27.1, 27.7, 28.3, 28.6, 28.8, 29.0, 29.2, 29.4, 29.6, 29.8, 31.8, 39.6, 40.3, 42.2, 45.8, 52.9, 58.05, 58.09, 63.2, 65.2, 67.5, 67.9, 70.5, 119.2, 119.3, 120.2, 125.4, 127.9, 131.3, 134.2, 134.4, 134.5, 141.2, 144.6, 144.8, 144.9, 167.4, 170.9; MALDI-TOF-MS m/z obsd 1862.492 [M+], calcd 1861.127 (M = ZnC120H175N7O5); λabs (ε) 426 (3.2 × 10⁵), 556, 597; λem (λex = 426 nm) 605, 651 nm.
Electrochemical studies
Cyclic voltammetric measurements were carried out with an Autolab PGSTAT101 potentiostat/galvanostat (Eco Chemie, the Netherlands) using a conventional three-electrode configuration. A water-jacketed glass cell was employed to control the reaction temperature. A glassy carbon electrode with a disk diameter of 3.0 mm was used as a working electrode. Before use, the electrode was polished with an aqueous suspension of alumina powder and rinsed thoroughly with deionized water. A platinum wire was applied as an auxiliary electrode. All potentials are quoted with respect to a silver/silver ion (Ag/Ag+) reference electrode in an acetonitrile solution; this electrode was externally calibrated with a ferrocene/ferrocenium ion (Fc/Fc+) redox couple and has a potential of 0.548 V vs. a normal hydrogen electrode (NHE).11 Cyclic voltammograms were recorded at scan rates of 100–500 mV s−1 in freshly distilled and deoxygenated CH2Cl2 containing 0.10 M tetrabutylammonium perchlorate (TBAP). A deaeration procedure was carried out with the aid of ultra-high purity (UHP) argon.Device fabrication and characterization
A mesoscopic TiO2 film was composed of an 8 μm thick transparent layer of 20 nm sized TiO2 anatase nanoparticles onto which a second 5 μm thick scattering layer of 400 nm sized TiO2 was superimposed. The detailed methods for TiO2 film preparation, device fabrication, and photocurrent–voltage measurements can be found in an earlier report.12 The double layer films were heated to 500 °C and sintered for 30 min. After cooling down to 80 °C, the films were immersed into the dye solution (300 μM) in a mixture of THF and ethyl alcohol (v/v, 1/4) for 16 h. The stained photoanode was fabricated with the platinized counter electrode using a 25 μm thick Surlyn film (Dupont, USA) and sealed by a hot-press machine. In this study, an acetonitrile-based electrolyte containing 1.0 M 1,3-dimethylimidazolium iodide (DMII), 0.1 M LiI, 30 mM I2, 0.5 M tert-butylpyridine (t-BP), and 0.1 M guanidiniumthiocyanate (GNCS) in a mixed solvent of acetonitrile and valeronitrile (v/v, 85/15) was used to fill the internal gap between the two glasses.To characterize the solar cells, a 450 W xenon light source (Oriel, USA) was used. The current–voltage characteristics were obtained by applying external potential bias to the cell and measuring the generated photocurrent with a Keithley model 2400 digital source meter (Keithley, USA). The devices were masked to attain an illuminated active area of 0.159 cm2. Loss of light reflection from the photoanode glass was reduced by applying a self-adhesive fluorinated polymer anti-reflecting film (ARKTOP, Asahi glass). Up to four devices were fabricated for each experimental variable change to give accurate statistics. A modulated light intensity data acquisition system was used to control the incident photon-to-current conversion efficiency (IPCE) measurement. The modulation frequency was about 1 Hz. Light from a 300 W xenon lamp (ILC Technology, USA) was focused through a computer controlled Gemini-180 double monochromator (Jobin Yvon Ltd, UK) onto the photovoltaic cell. White light bias was used to bring the total light intensity on the device closer to the operating conditions.
Photovoltage transients were detected by using a pump pulse generated by four red light emitting diodes controlled by a fast solid-state switch with a white light bias. The pulse of the red light with a width of 50 ms was incident on the photoanode side of the cell, and its intensity was controlled to keep a suitably low level for the generation of the exponential voltage decay where the charge recombination rate constants were obtained directly from the exponential decay rate.13 The white bias light, also incident on the same side of the device, was supplied by white diodes. The photo-induced charge density as function of the white light bias intensity was obtained by charge extraction measurement where the stored charges under open circuit conditions were extracted by placing the cell under short circuit conditions.
Results and discussion
Synthesis
The synthesis started with a reaction between lignoceric acid (1) and thionyl chloride to obtain the corresponding acid chloride, which was reacted further with a 25% NH4OH solution, leading to compound 2 in 80% yield (Scheme 1). After that, compound 2 was reduced by LiAlH4 to afford compound 3 in 67% yield.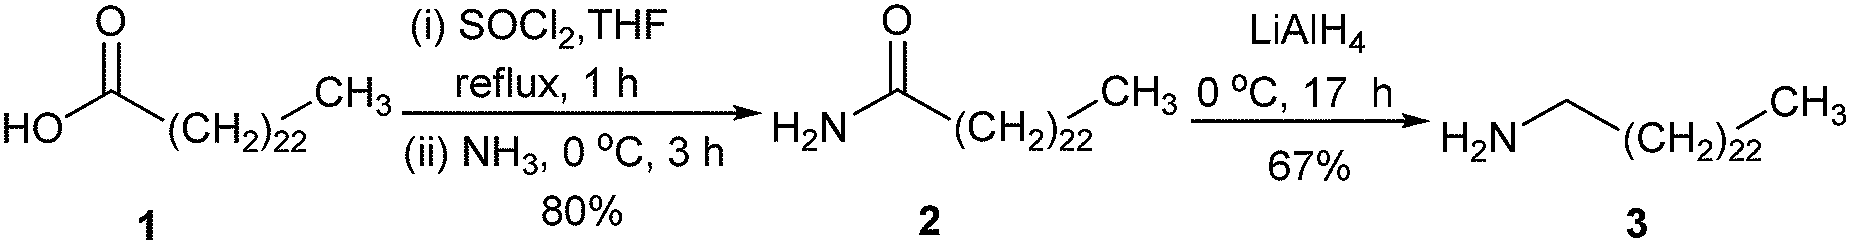 | ||
| Scheme 1 Synthesis of amine precursor 3. | ||
The preparation of the target compound relies on a three-step procedure recently published by our group.9 Compound 47 was subjected to a reaction with NHS and EDC·HCl, followed by a condensation of the resulting air-sensitive succinimidyl ester with an excess amount of amine 3 to give freebase porphyrin 5 (Scheme 2). The yields from these two steps were low mainly due to the incompletion of the reaction at three reaction sites as desired, despite the use of a large excess of NHS, EDC·HCl and amine 3, and a long reaction time. Moreover, attempts to separate compound 5 from other possible condensed by-products and impurities failed give pure compound 5. Therefore, the resulting crude product containing 5 was directly metallated by Zn(OAc)·2H2O. After the lengthy chromatographic separation, Zn-5 was obtained in 5% overall yield. In the mass spectrum, the molecular ion peak of Zn-5 was observed at m/z 1862.492, confirming the formation of Zn-5. The solubility of Zn-5 in common organic solvents, e.g. CH2Cl2, CHCl3, and THF, was found to be approximately 10 mg mL−1, which is sufficient for a routine wet process in the DSSC fabrication.
 | ||
| Scheme 2 Synthesis of the target compound. | ||
Photophysical and electrochemical properties
As shown in Fig. 1, an absorption spectrum of the Zn-5 solution in toluene exhibited a characteristic pattern of a Zn-porphyrin having an intense B-band at 426 nm, and Q-bands at 556 and 597 nm (black solid line). The absorption pattern of a Zn-5 film on TiO2 was very similar with slightly broader bands than those of the Zn-5 solution, most likely due to the aggregation of the porphyrin macrocycle (red dashed line). This observation indicated that the C24-containing amide groups on the meso-phenyl substituents of the porphyrin ring did not significantly affect the photophysical properties of Zn-5 in terms of absorption as a function of the wavelength of incident light.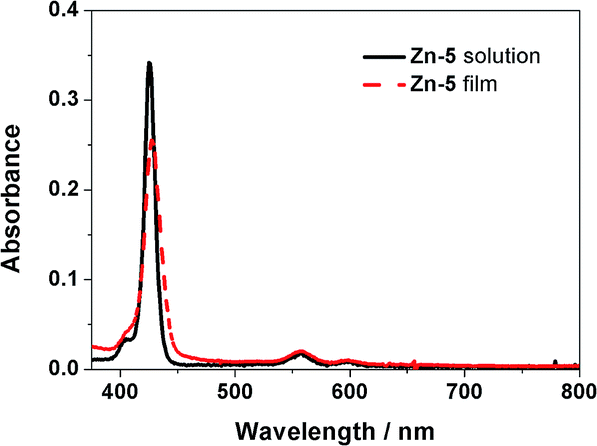 | ||
| Fig. 1 Absorption spectra of the Zn-5 solution in toluene (black solid line) and the Zn-5 film on TiO2 (red dashed line). | ||
Shown in Fig. 2 are cyclic voltammograms obtained with a glassy carbon electrode at the scan rate of 100 mV s−1 in the potential range of −2.20 to 1.40 V for CH2Cl2 containing 0.10 M TBAP in the presence and absence of 1.00 mM Zn-5. Curves B and D, recorded as background cyclic voltammograms, exhibit no significant peaks of the TBAP–CH2Cl2 electrolyte solution. In the positive potential region, a cyclic voltammogram for the oxidation of Zn-5 (curve A) reveals some electrochemical features of Zn-5. As can be seen in the inset of Fig. 2 presenting the magnified voltammograms from 0.30 to 1.30 V, three successive quasireversible redox couples exist. The anodic peak potentials are approximately at 0.54, 0.79 and 1.01 V, while the corresponding cathodic peak potentials are at 0.46, 0.71 and 0.92 V, respectively. When the potential was negatively scanned from 0 V to −2.20 V (curve C), the electro-reduction of Zn-5 gave relatively small and poorly defined irreversible cathodic peaks at approximately −0.81, −1.13, −1.33, −1.61, −1.91 and −2.08 V, implying multi-step ligand-centered reduction of the porphyrinic units and the conjugated system of the compound.14
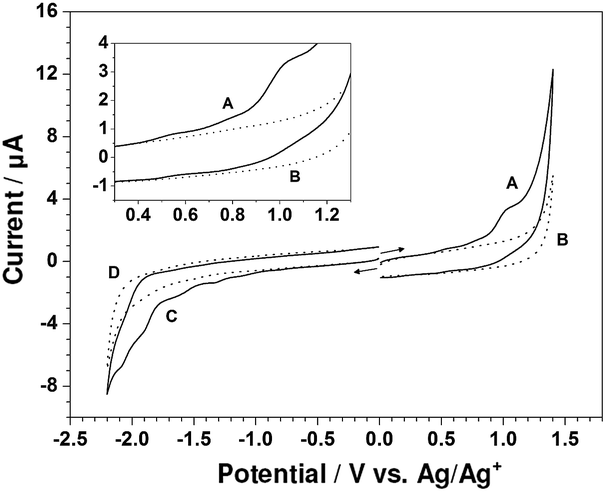 | ||
| Fig. 2 Cyclic voltammograms recorded with the glassy carbon electrode (area = 0.071 cm2) at 100 mV s−1 in CH2Cl2 containing 0.10 M TBAP in the presence of 1.00 mM Zn-5 (curves A and C) and CH2Cl2 containing only 0.10 M TBAP (curves B and D). Curves A and B were initially scanned in the positive direction; while curves (C and D) were initially scanned in the negative direction. Inset is an expansion of the region between 0.30 and 1.30 V. | ||
To enhance the current size and thoroughly observe the electrochemical behavior of Zn-5, its cyclic voltammograms were further collected at the scan rates of 250 and 500 mV s−1. Fig. 3a and b display cyclic voltammograms of 1.00 mM Zn-5 solution initially scanned in anodic and cathodic directions, respectively, at 100, 250 and 500 mV s−1. All peaks appearing in the cyclic voltammograms recorded at 100 mV s−1 also exist in those collected at the higher scan rates with larger magnitudes and slight shifts in position. Table 1 summarizes the peak potentials (Ep) for the oxidation and reduction of Zn-5 at these three scan rates. Due to the unresolved nature of some peaks especially those of the reduction processes, each cyclic voltammetric peak was treated as a parabolic curve of which the vertex represents the peak potential. Using scientific graphing and data analysis software, two tangent lines from both sides were drawn to achieve the intercept which is connected with the vertex via a straight line perpendicular to the parabola base.15 To achieve accurate peak potential values, at least three measurements were made at all positions and the relative standard deviations of the obtained potentials are less than 0.35%.
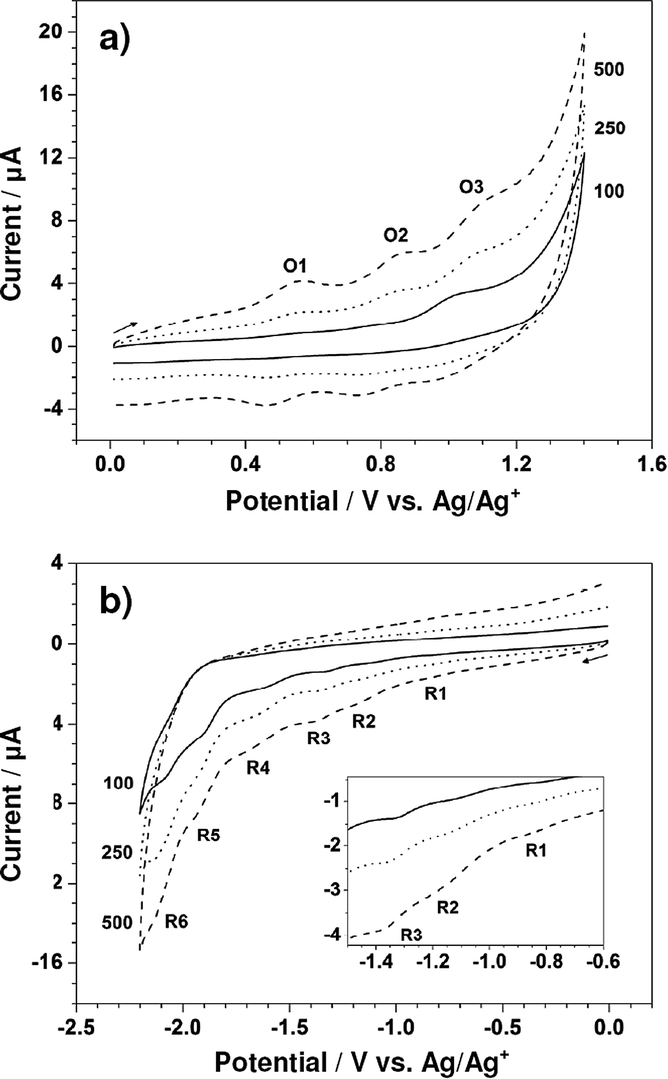 | ||
| Fig. 3 Cyclic voltammograms recorded with the glassy carbon electrode (area = 0.071 cm2) from (a) 0 to 1.40 to 0 V and (b) 0 to −2.20 to 0 V in CH2Cl2 containing 0.10 M TBAP and 1.00 mM Zn-5 at 100 (solid line), 250 (dotted line), and 500 (dashed line) mV s−1. Inset is an expansion of the region between −0.60 and −1.50 V. | ||
| Scan rate/mV s−1 | Oxidation (from 0 to 1.40 to 0 V) | Reduction (from 0 to −2.20 to 0 V) | ||||||||||
|---|---|---|---|---|---|---|---|---|---|---|---|---|
| E pa in the forward scan/V | E pc in the backward scan/V | E pc in the forward scan/V | ||||||||||
| O1 | O2 | O3 | O1 | O2 | O3 | R1 | R2 | R3 | R4 | R5 | R6 | |
| a E pa = anodic peak potential; and Epc = cathodic peak potential. Each entry represents the average peak potential value achieved from at least three measurements. The potential is quoted with respect to the Ag/Ag+ reference electrode and externally calibrated with the Fc/Fc+ redox couple having a potential of 0.548 V vs. NHE.11 | ||||||||||||
| 100 | 0.54 | 0.79 | 1.01 | 0.46 | 0.71 | 0.92 | −0.81 | −1.13 | −1.33 | −1.61 | −1.91 | −2.08 |
| 250 | 0.55 | 0.84 | 1.07 | 0.46 | 0.74 | 0.97 | −0.82 | −1.17 | −1.36 | −1.67 | −1.92 | −2.09 |
| 500 | 0.55 | 0.84 | 1.07 | 0.46 | 0.74 | 0.97 | −0.84 | −1.17 | −1.37 | −1.67 | −1.92 | −2.12 |
For the oxidation of Zn-5, the differences between the anodic and cathodic peak potentials (ΔEp) of the three redox couples are approximately 80–110 mV. Since an electron transfer in high-resistance organic media always gives a ΔEp value larger than the theoretical value of 59/n mV16 and the ΔEp for the one-electron, reversible Fc/Fc+ couple in the 0.10 M TBAP–CH2Cl2 solution has a value of nearly 120 mV (data not shown), each oxidation of Zn-5 in CH2Cl2 possibly involves one electron. In addition, it is worthwhile to consider the effect of the scan rate on peak current even though not all of the peak currents could be determined due to size limitations. For the third oxidation (O3), the anodic peak currents at 100, 250 and 500 mV s−1 are 1.41, 2.05 and 3.01 μA, respectively. A plot of these anodic peak currents vs. the square root of scan rates demonstrates linear behavior (not shown), elucidating the diffusion-controlled oxidation process of Zn-5.
Using the data in Table 1, a half-peak potential (E1/2) for the oxidation of Zn-5 in CH2Cl2 containing 0.10 M TBAP can be calculated. Table 2 displays E1/2 values of all three oxidations. Following the previous studies,17 the data from cyclic voltammetry and absorption spectroscopy can be used to estimate the highest occupied molecular orbital (HOMO) and lowest unoccupied molecular orbital (LUMO) energy levels of the dyes. The E1/2 value of the first oxidation (E1/2(ox1)) can represent the HOMO energy level of a dye, while the LUMO energy level can be calculated from an excited state oxidation potential (E*0–0) by the following equation:
| E*0–0 = E1/2(ox1) − E0–0, |
| Scan rate/mV s−1 | Half-peak potential (E1/2)/V | ||
|---|---|---|---|
| O1 | O2 | O3 | |
| a E 1/2 = (Epa + Epc)/2, when Epa = anodic peak potential and Epc = cathodic peak potential.16 The potential is quoted with respect to the Ag/Ag+ reference electrode and externally calibrated with the Fc/Fc+ redox couple having a potential of 0.548 V vs. NHE.11 | |||
| 100 | 0.50 | 0.75 | 0.97 |
| 250 | 0.51 | 0.79 | 1.02 |
| 500 | 0.51 | 0.79 | 1.02 |
Photovoltaic characteristics
The photovoltaic performance of Zn-5-based DSSCs, i.e. the photocurrent density–voltage (J–V) curve, and IPCE were investigated in the test devices using a standard double layer TiO2 film (8 + 5 μm) and a volatile acetonitrile-based electrolyte. The detailed composition is described in the Device fabrication section. The IPCE of the Zn-5-based device in Fig. 4 shows the peak values of 49.1%, 35.2% and 30.7% at 440, 560 nm and 610 nm, respectively. These IPCE peaks are in accordance with the respective B-band and Q-bands in the absorption spectrum of Zn-5 in the solution shown in Fig. 1. It can be implied from the IPCE spectrum that the ratios of the peaks of the low-energy photon absorption to the peak of the high-energy photon absorption appeared to be 0.72 and 0.63 at the respective wavelengths of 570 and 610 nm. These values are almost two times higher than those obtained from the IPCE data of ZnTPP-COOH (approximately 0.3 and 0.2).18 This suggested a substantial enhancement in the light harvesting efficiency in the visible region of Zn-5 absorbed on the TiO2 surface as a result of the C24-containing amide groups on the meso-phenyl substituents of the porphyrin macrocycle.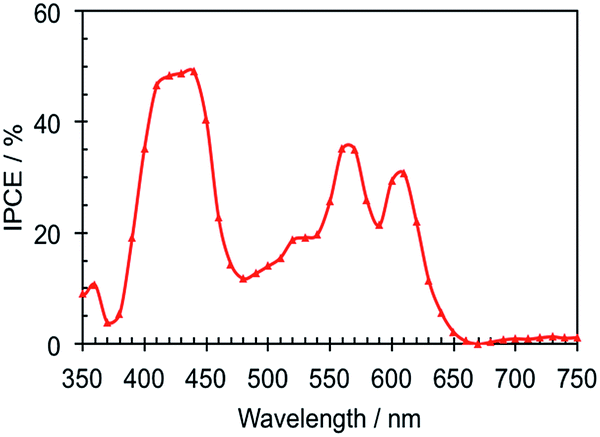 | ||
| Fig. 4 IPCE spectrum of the Zn-5-based DSSCs. | ||
The J–V curves of the devices with the volatile electrolyte under standard light illumination (AM 1.5G 100 mW cm−2) are shown in Fig. 5. The best Zn-5-based DSSC exhibited photovoltaic parameters; i.e. short-circuit photocurrent density (Jsc), an open-circuit voltage (Voc) and a fill factor (FF) of 5.6 mA cm−2, 0.7 V and 0.78, respectively, which yielded a photoconversion efficiency (PCE) of 3.1%. To our surprise, the Jsc of the device increased up to 180% of the original value by simply exposing the device under the simulated full sunlight for 40 minutes before the J–V measurement, leading to the incremental increase of the PCE value from 1.6% to 3.1%. We assume that the steric effect of the porphyrin bearing the C24-containing amide groups can be subdued by the light exposure, allowing more photoelectrons to be generated and raising a passage of electrons throughout the redox mediator. On the other hand, by comparing with the results observed from ZnTPP-COOH that were reported earlier,18 it was found that the presence of the C24-containing amide groups at para positions of the meso-phenyl substituents of Zn-5 caused a remarkable increase in the photocurrent (4.2 vs. 5.6 mA cm−2). This phenomenon can be attributed to the long alkyl moieties enfolding in the circumference of the porphyrin macrocycles which decelerate the rate of the charge recombination between the photo-injected electron and I3− ions in the electrolyte at the TiO2/electrolyte interface, corresponding to the previous studies.3 Nevertheless, the measured PCEs of the Zn-5-based devices are relatively low. This might be from the low amount of surface coverage of the dye molecules on TiO2 film due to the bulkiness of the long alkyl groups and the porphyrin aggregation on the TiO2 surface that was also found in the preceding reports.3,5,18
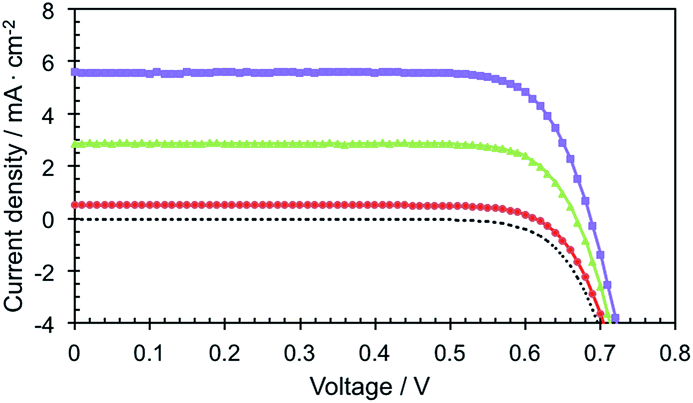 | ||
| Fig. 5 Photocurrent density–voltage curves of the Zn-5-based DSSCs. | ||
In order to elucidate the rate of electron recombination between Zn-5, TiO2 nanoparticles and the oxidized electrolyte, the transient photovoltage decay measurement was performed. Fig. 6a shows the electron recombination lifetime, which is the inverse of the recombination rate of the injected electrons, as a function of Voc in the device. This data represents the difference between the redox level of the electrolyte and the quasi-Fermi level in the TiO2.19 It appears in this plot that the electron lifetime decays exponentially with the stronger light intensity, suggesting that the recombination processes of the photoelectrons occur faster via the I3− ions in the electrolyte, compared with the recombination processes via the TiO2 phase, when the photoelectrons are filled in the higher energy states of TiO2. In addition, Fig. 6b shows the chemical capacitance–voltage characteristics of the device. The chemical capacitance is a representation of the electron density of state that increases with a bias potential at open circuit conditions as the density of state occupancy progresses. It is implied from Fig. 6b that the chemical capacitance dependence on Voc exhibits an approximate exponential form.
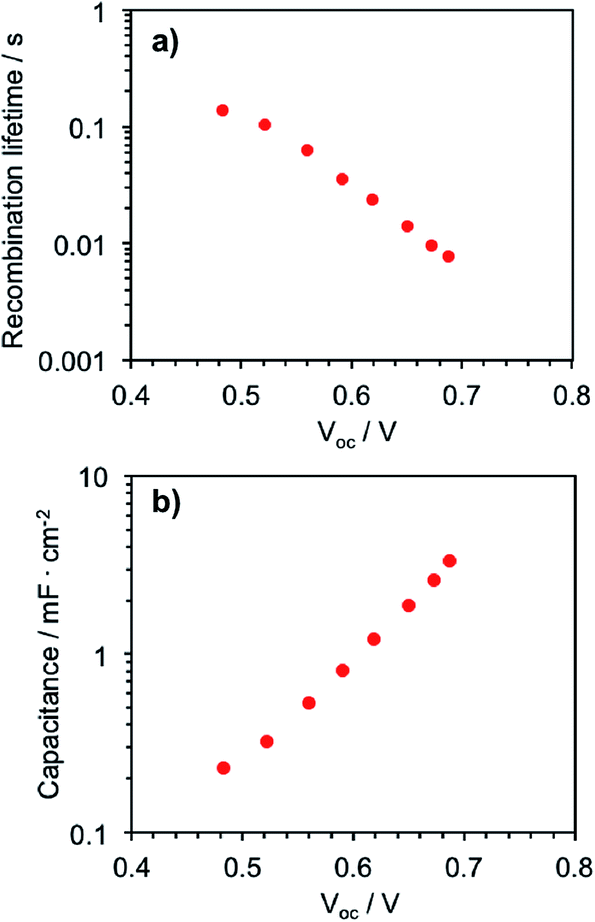 | ||
| Fig. 6 (a) Electron recombination lifetime and (b) chemical capacitance plotted as a function of open circuit voltage in the Zn-5-based DSSCs, derived from photovoltage transients at the various white light bias intensities. | ||
Conclusions
This study has shown that the synthesis of the target porphyrin bearing three C24-containing amide groups and a carboxyl group on meso-phenyl substituents was achieved. The presence of the C24-containing amide groups did not significantly affect the photophysical properties of the porphyrin dye. Cyclic voltammetry measurements gave a good understanding of the electrochemical behaviour of the dye and also indicated that the HOMO–LUMO energy levels of the dye were suitable for DSSC application. The device studies indicated that the presence of the C24-containing amide groups led to significant improvement of the DSSCs in terms of more efficient light harvesting in the Q-bands region and a higher photocurrent, compared to the previously reported ZnTPP-COOH-based DSSCs.Acknowledgements
This research was supported by the National Research University Project of Thailand, Office of the Higher Education Commission (Project No. WCU-035-EN-57), and Graduate School of Chulalongkorn University (The 90th Anniversary of Chulalongkorn University Fund, Ratchadaphiseksomphot Endowment Fund). The device fabrications and the photovoltaic measurements were performed at École Polytechnique Fédérale de Lausanne (EPFL), Switzerland.References
- Selected publications: (a) K. Kalyanasundaram, N. Vlachopoulos, V. Krishnan, A. Monnier and M. Grätzel, J. Phys. Chem., 1987, 91, 2342 CrossRef CAS; (b) A. Kay and M. Grätzel, J. Phys. Chem., 1993, 97, 6272 CrossRef CAS; (c) D. Wohrle, B. Tennigkeit, J. Elbe, L. Kreienhoop and G. Schurpfeil, Mol. Cryst. Liq. Cryst., 1993, 230, 221 CrossRef; (d) S. Cherian and C. C. Wamser, J. Phys. Chem. B, 2000, 104, 3624 CrossRef CAS; (e) F. Odobel, E. Blart, M. Lagree, M. Villieras, H. Boujtita, N. El Murr, S. Caramori and C. A. Bignozzi, J. Mater. Chem., 2003, 13, 502 RSC; (f) W. M. Campbell, A. K. Burrell, D. L. Officer and K. W. Jolly, Coord. Chem. Rev., 2004, 248, 1363 CrossRef CAS; (g) H. Imahori, J. Phys. Chem. B, 2004, 108, 6130 CrossRef CAS PubMed; (h) T. Hasobe, S. Fukuzumi and P. V. Kamat, J. Phys. Chem. B, 2006, 110, 25477 CrossRef CAS PubMed; (i) M. A. Baldo, D. F. O’Brien, Y. You, A. Shoustikov, S. Sibley, M. E. Thompson and S. R. Forrest, Nature, 1998, 395, 151 CrossRef CAS; (j) R. C. Kwong, S. Sibley, T. Dubovoy, M. Baldo, S. R. Forrest and M. E. Thompson, Chem. Mater., 1999, 11, 3709 CrossRef CAS; (k) T. F. Guo, S. C. Chang, Y. Yang, R. C. Kwong and W. E. Thompson, Org. Electrochem., 2000, 1, 15 CrossRef CAS; (l) E. M. Gross, N. R. Armstrong and R. M. Wightman, J. Electrochem. Soc., 2002, 149, E137 CrossRef CAS; (m) V. A. Montes, C. Perez-Bolivar, N. Agarwal, J. Shinar and P. Anzenbacher, J. Am. Chem. Soc., 2006, 128, 12436 CrossRef CAS PubMed; (n) X. Wang, H. Wang, Y. Yang, Y. He, L. Zhang, Y. Li and X. Li, Macromolecules, 2010, 43, 709 CrossRef CAS; (o) Y. Y. Noh, K. Yase and S. Nagamatsu, Appl. Phys. Lett., 2003, 83, 1243 CrossRef CAS; (p) P. Checcoli, G. Conte, S. Salvatori, R. Paolesse, A. Bolognesi, A. Berliocchi, F. Brunetti, A. D’Amico, A. Di Carlo and P. Lugli, Synth. Met., 2003, 138, 261 CrossRef CAS; (q) P. B. Shea, J. Kanicki and N. Ono, J. Appl. Phys., 2005, 98, 014503 CrossRef; (r) C.-M. Che, H.-F. Xiang, S. S.-Y. Chui, Z.-X. Xu, V. A. L. Roy, J. J. Yan, W.-F. Fu, P. T. Lai and I. D. Williams, Chem.–Asian J., 2008, 3, 1092 CrossRef CAS PubMed.
- (a) A. Yella, H.-W. Lee, H. N. Tsao, C. Yi, A. K. Chandiran, M. K. Nazeeruddin, E. W.-G. Diau, S. M. Zakeeruddin and M. Grätzel, Science, 2011, 334, 629 CrossRef CAS PubMed; (b) S. Mathew, A. Yella, P. Gao, R. Humphry-Baker, B. F. E. Curchod, N. Ashari-Astani, I. Tavernelli, U. Rothlisberger, M. K. Nazeeruddin and M. Grätzel, Nat. Chem., 2014, 6, 242 CrossRef CAS PubMed.
- (a) A. Forneli, M. Planells, M. A. Sarmentero, E. Martinez-Ferrero, B. C. O’Regan, P. Ballester and E. Palomares, J. Mater. Chem., 2008, 18, 1652 RSC; (b) M. Planells, A. Forneli, E. Martinez-Ferrero, A. Sánchez-Díaz, M. A. Sarmentero, P. Ballester, E. Palomares and B. C. O’Regan, Appl. Phys. Lett., 2008, 92, 153506 CrossRef.
- J. E. Kroeze, N. Hirata, S. Koops, M. K. Nazeeruddin, L. Schmidt-Mende, M. Grätzel and J. R. Durrant, J. Am. Chem. Soc., 2006, 128, 16376 CrossRef CAS PubMed.
- A. Islam, S. P. Singh, M. Yanagida, M. R. Karim and L. Han, Int. J. Photoenergy, 2011, 2011, 757421 Search PubMed.
- (a) Z. Xiao, K. Sun, J. Subbiah, S. Ji, D. J. Jones and W. W. H. Wong, Sci. Rep., 2014, 4, 5701 CrossRef CAS PubMed; (b) T. Aytun, L. Barreda, A. Ruiz-Carretero, J. A. Lehrman and S. I. Stupp, Chem. Mater., 2015, 7, 1201 CrossRef.
- A. D. Adler, F. R. Longo, J. D. Finarelli, J. Goldmacher, J. Assour and L. Korsakoff, J. Org. Chem., 1967, 32, 476 CrossRef CAS.
- N. M. Howarth, W. E. Lindsell, E. Murray and P. N. Preston, Tetrahedron, 2005, 61, 8875 CrossRef CAS.
- C. Reanprayoon, J. Gasiorowski, M. Sukwattanasinitt, N. S. Sariciftci and P. Thamyongkit, RSC Adv., 2014, 4, 3045 RSC.
- J. Jiao, P. Thamyongkit, I. Schmidt, J. S. Lindsey and D. F. Bocian, J. Phys. Chem. C, 2007, 111, 12693 CrossRef CAS.
- V. V. Pavlishchuk and A. W. Addison, Inorg. Chim. Acta, 2000, 298, 97 CrossRef CAS.
- P. Wang, M. Zakeeruddin, P. Comte, R. Charvet, R. Humphry-Baker and M. J. Graetzel, J. Phys. Chem. B, 2003, 107, 14336 CrossRef CAS.
- B. C. O’Regan and F. Lenzmann, J. Phys. Chem. B, 2004, 108, 4342 CrossRef.
- M. E. El-Khouly, J. B. Ryu, K.-Y. Kay, O. Ito and S. Fukuzumi, J. Phys. Chem. C, 2009, 113, 15444 CrossRef CAS.
- Selected publications: (a) J. L. Coolidge, Am. Math. Mon., 1951, 58, 449 CrossRef; (b) P. R. Wolfson, Am. Math. Mon., 2001, 108, 206 CrossRef; (c) J. Stewart, Single Variable Calculus, Brooks/Cole Cengage Learning, USA, 7th edn, 2008 Search PubMed.
- A. J. Bard and L. R. Faulkner, Electrochemical Methods: Fundamentals and Applications, Wiley, New York, 2nd edn, 2000 Search PubMed.
- (a) S.-L. Wu, H.-P. Lu, H.-T. Yu, S.-H. Chuang, C.-L. Chiu, C.-W. Lee, E. W.-G. Diau and C.-Y. Yeh, Energy Environ. Sci., 2010, 3, 949 RSC; (b) A. Luechai, N. Pootrakulchote, T. Kengthanomma, P. Vanalabhpatana and P. Thamyongkit, J. Organomet. Chem., 2014, 753, 27 CrossRef CAS.
- H. He, A. Gurung and L. Si, Chem. Commun., 2012, 48, 5910 RSC.
- J. Bisquert and V. S. Vikhrenko, J. Phys. Chem. B, 2004, 108, 2313 CrossRef CAS.
Footnote |
| † Electronic supplementary information (ESI) available: Spectral data, including 1H-NMR spectrum, 13C-NMR spectrum and mass spectra for new compounds. See DOI: 10.1039/c5ra10538b |
| This journal is © The Royal Society of Chemistry 2015 |