
 Open Access Article
 This Open Access Article is licensed under a Creative Commons Attribution-Non Commercial 3.0 Unported Licence
Synergistic strategies for the preparation of highly efficient dye-sensitized solar cells on plastic substrates: combination of chemical and physical sintering†
Yuelong
Li‡
ab,
Kicheon
Yoo‡
ac,
Doh-Kwon
Lee
ad,
Jin Young
Kim
ae,
Hae Jung
Son
a,
Jong Hak
Kim
c,
Chul-Ho
Lee
e,
Hernán
Míguez
*b and
Min Jae
Ko
*adf
aPhoto-Electronic Hybrids Research Center, Korea Institute of Science and Technology, Seoul 02792, Republic of Korea. E-mail: mjko@kist.re.kr; Fax: +82-2-958-6649; Tel: +82-2-958-5518
bInstituto de Ciencia de Materiales de Sevilla, Consejo Superior de Investigaciones Científicas, Avda. Américo Vespucio 49, 41092 Sevilla, Spain. E-mail: h.miguez@csic.es; Fax: +34-954-460-665; Tel: +34-954-489-581
cDepartment of Chemical and Biomolecular Engineering, Yonsei University, 120-746, Republic of Korea
dGreen School, Korea University, 145, Anam-ro, Seongbuk-gu, Seoul 02841, Republic of Korea
eDepartment of Materials Science and Engineering, Seoul National University, Seoul 08826, Republic of Korea
fKU-KIST Graduate School of Converging Science and Technology, Korea University, Seoul 02841, Republic of Korea
First published on 3rd September 2015
Abstract
Preparation of well-interconnected TiO2 electrodes at low temperature is critical for the fabrication of highly efficient dye-sensitized solar cells (DSCs) on plastic substrates. Herein we explore a synergistic approach using a combination of chemical and physical sintering. We formulate a binder-free TiO2 paste based on “nanoglue” as the chemical sintering agent, and use it to construct a photoelectrode on plastic by low-temperature physical compression to further improve the connectivity of TiO2 films. We systematically investigated the factors affecting the photovoltaic performance and found the conditions to achieve electron diffusion lengths as long as 25 μm and charge collection efficiencies as high as 95%, as electrochemical impedance spectroscopy measurements indicate. We apply this approach to obtain a DSC deposited on plastic displaying 6.4% power conversion efficiency based on commercial P25 titania particles.
Introduction
Flexible dye-sensitized solar cells (DSCs) have attracted great interest from scientific researchers1–15 around the world, as flexible DSCs could be used as portable and mobile ubiquitous power suppliers and satisfy the requirements for continuous roll-to-roll, high volume manufacturing processes needed for future commercialization. For the fabrication of the high performance flexible DSCs on a plastic substrate, considerable efforts have been made to enhance the tight interconnection of TiO2 nanoparticles at low temperature (≦150 °C) because the plastic substrates cannot withstand the conventional sintering temperature of approximately 500 °C. Up to now, many low temperature fabrication processes have been reported, and most of them can be categorized into chemical and physical sintering methods. As for the latter, the compression16 method has been considered as a quick and simple technique to fabricate well interconnected TiO2 film for highly efficient DSCs on plastic substrates.17 Recently, we developed novel chemical sintering method using the concept of an inorganic interparticle agent,5,6 coined “nanoglue”, for inducing the chemical bonding of neighboring TiO2 nanoparticles during thermal treatment; this allowed to build cells that reached 5.4% efficiency at the low temperature of 130 °C so to preserve the thermal stability of the plastics involved. Although there have been several studies on the individual effects of chemical and physical sintering effect on the performance of plastic DSCs, there is few report on the plastic DSCs prepared from both physical and chemical sintering methods. It would be of great interest to combine the compression, or physical sintering with the nanoglue based chemical sintering, for the preparation of highly efficient DSCs on plastic substrates.In this manuscript, we analyze the effect of combining chemical sintering with physical sintering and demonstrate plastic supported solar cells that reach a power conversion efficiency of 6.4% based on commercial available P25 titania particles, which is quite state-of-the-art value compared with that of previously published based on the home-made titania particles. This synergic strategy relies on the use of a binder-free paste containing nanoglue and then compression simultaneously with being sintered at 130 °C. Systematic investigation of the factors affecting the performance of DSCs prepared by this combined method was carried out; the optimum pressure applied on the glued nanocrystalline pastes to maximize electron diffusion length and collection was found.
Experimental
20 wt% TiO2 particles (P25, 21 nm, Degussa) in ethanol solution were dispersed by Ultra Apex Mill (Model UAM-015, Kotobuki). An interparticle binding agent, or nanoglue, was synthesized by a sol–gel process following a published procedure.5 The nanoglue containing anatase TiO2 particles of 5 nm size were added to induce good interparticle connection at low temperature. Large TiO2 particles (T030, 320 nm, K. K. Titan, Japan) were used to cause multiple scattering within the electrode and hence enhance light harvesting.The viscous binder-free paste was prepared according to the following procedure: dispersed P25 particles, small particles from nanoglue gel and large T030 particles were mixed and dispersed by tip sonication (Q500 Sonicator, Qsonica) followed by vigorous shaking with a vortex mixer for at least 10 min each. The weight ratio of particles of P25![[thin space (1/6-em)]](https://www.rsc.org/images/entities/char_2009.gif) :T030:nanoglue is optimized to 55:30:15. The solid content of the particle mixture in the final pastes was fixed at 15 wt%.
:T030:nanoglue is optimized to 55:30:15. The solid content of the particle mixture in the final pastes was fixed at 15 wt%.
The TiO2 films were spread using a doctor blade onto a transparent conducting plastic substrate (ITO/PEN, 200 μm-thick, 15 Ω sq−1, transmittance of 80% at 550 nm, Peccell Tech. Inc.); 3M tape is used as a spacer. After drying at ambient temperature, TiO2 films were compressed at with temperature of 130 °C for 5 min with a lamination apparatus (Creative & Innovation System, Korea). A thin Teflon film was inserted between the TiO2 film and the piston to avoid contamination and film removal during compression. Compressed films were immersed into 0.5 mM N719 (cis-bis(isothiocyanato)-bis(2,2′-bipyridyl-4,4′-dicarboxylato)-ruthenium(II) bis-tetrabutylammonium), anhydrous ethanol solution for dye loading at 40 °C for 3 h with continuous shaking. Pt counter electrode was prepared by spreading a drop of 7 mM of H2PtCl6·6H2O in 2-propanol on a glass substrate (FTO/glass, 8 Ω sq−1, 2.3 mm-thick, Pilkington TEC8), drying at ambient temperature and annealing at 400 °C for 20 min. The two electrodes were assembled using 60 μm-thick hot melt Surlyn (Dupont 1702). The standard electrolyte solution was composed of 0.7 M 1-propyl-3-methylimidazolium iodide (PMII), 0.03 M iodine (I2), 0.05 M guanidinium thiocyanate (GuSCN) and 0.5 M 4-tert-butylpyridine (tBP) in a mixture of acetonitrile and valeronitrile (v/v = 85:15); it was introduced through the drilled holes on the counter electrode. The active area of the dye-adsorbed TiO2 films was about 0.45 cm2 as measured by an image analysis program equipped with a digital microscope camera (Moticam 1000). The thickness of the TiO2 films was measured by an Alpha-step IQ surface profiler (KLA Tencor).
The amounts of dye adsorbed on the TiO2 films were quantitatively estimated by desorbing the dye in basic solution, as follows: the sensitized films with known areas and thicknesses were rinsed by anhydrous ethanol and then dried in a dry nitrogen flow. The films were immersed in a measured volume of 0.1 M NaOH solution in water/ethanol (50:50 v/v) for 24 h to remove the dye molecules from the TiO2 films. The UV-Vis absorption spectrum of the resultant solution was recorded using a Perkin-Elmer Lambda 35 UV-Vis spectrometer, as shown in Fig. S1 in the ESI.†
High-resolution transmission electron images (HR-TEM) were obtained using a Field-Emission-Gun-equipped TEM instrument (FEI Tecnai F20, Philips Electron Optics, Holland). Photocurrent–voltage measurements were performed using a Keithley 2400 source measure unit. A solar simulator (Yamashida Denso) equipped with a 1000 W Xe lamp was used as a light source. Light intensity was adjusted employing an NREL-calibrated Si solar cell. A black mask was placed on top of the cells to prevent diffusion of light during measurement. The incident photon-to-current conversion efficiency (IPCE) was measured using a system specifically designed for DSCs (PV measurements, Inc.). The electrochemical impedance spectra (EIS) were attained in the frequency range of 10−1 to 106 Hz using a potentiostat (Solartron 1287) equipped with a frequency response analyzer (Solartron 1260); the magnitude of the alternate signal was 10 mV. Impedance parameters were determined by fitting the impedance spectrum using Z-view software. The impedance measurements were carried out in the dark by sweeping the applied potential.
Results and discussion
The structural and morphological properties of films composed of ternary particles were examined by transmission electron microscopy (TEM). The films were scratched off the substrates and deposited on a microscope grid. In Fig. 1(a), it can be seen that smaller particles, composing the actual nanoglue, fill the voids between the larger P25 and T030 scattering particles, and continuously connect larger particles together to yield a more compact structure which potentially reduce pore size and porosity of resulted films. From the enlarged image in Fig. 1(b), the crystallinity and size of small nanoglue particles can be clearly seen, which is pure anatase phase for crystallinity and about 5 nm for the size. After compression, the morphology and structure of both the surface (left column, Fig. 2) and the cross section (right column, Fig. 2) of the films were characterized by scanning electron microscopy (SEM). It was observed that the ternary particle composition films compressed at 0 MPa, corresponding to film without compression, display a smooth surface without any cracks (Fig. 2(a)), which is a basic requirement to achieve a reasonable cell performance; cracks within a film have a dramatic effect on the electron transport between neighboring particles and hence deteriorate the photovoltaic performance.10,18 Additionally, a mesoporous structure was observed from the cross-view of SEM in Fig. 2(b). More SEM images were obtained of the films pressed at 40 MPa, 100 MPa and 160 MPa in order to examine the effect of applying different and increasing pressures on film morphology. Fig. 2(c) exhibit a film pressed at 40 MPa, it shows that the surface becomes more flat with compression; the effect is more significant for films compressed at 100 MPa and 160 MPa, as shown in Fig. 2(e) and (g). The surface roughness of the films was evaluated from the three-dimensional images of atomic force microscopy (AFM) (Fig. S2†). The root mean square roughness (Rq) significantly decreases from 47.66 nm for uncompressed film to 15.95 nm for compressed films at 40 MPa, and continues gradually decreasing to 11.71 nm and 5.27 nm for compressed films at 100 MPa and 160 MPa, respectively. The reduced Rq indicates flattened surface by compression. We quantitatively investigated the structural properties related to pore in the film using Barrett–Joyner–Halenda (BJH) pore size and volume analysis. As summarized in Table S1,† compressed films hold both smaller pores and less porosity with increasing applied pressure. The reduction of porosity with increasing pressure may be due to the reduction of the interparticle space with the closer packing of the nanoparticles; the packing could partially shift from a relatively loose cubic pileup to the denser tetrahedral pileup as schematized in Fig. S3.† According to BJH analysis, the porosity (P) of compressed films are 41.8%, 34.0%, 25.6%, and 22.8% for applied pressures of 0 MPa, 40 MPa, 100 MPa, and 160 MPa, respectively, which presents similar tendency with a previous report,8 The average nanoparticle coordination number (N) for ternary composition films subjected to different pressures was estimated according to the approximate expression:19–21| N = (3.08/P) − 1.13 | (1) |
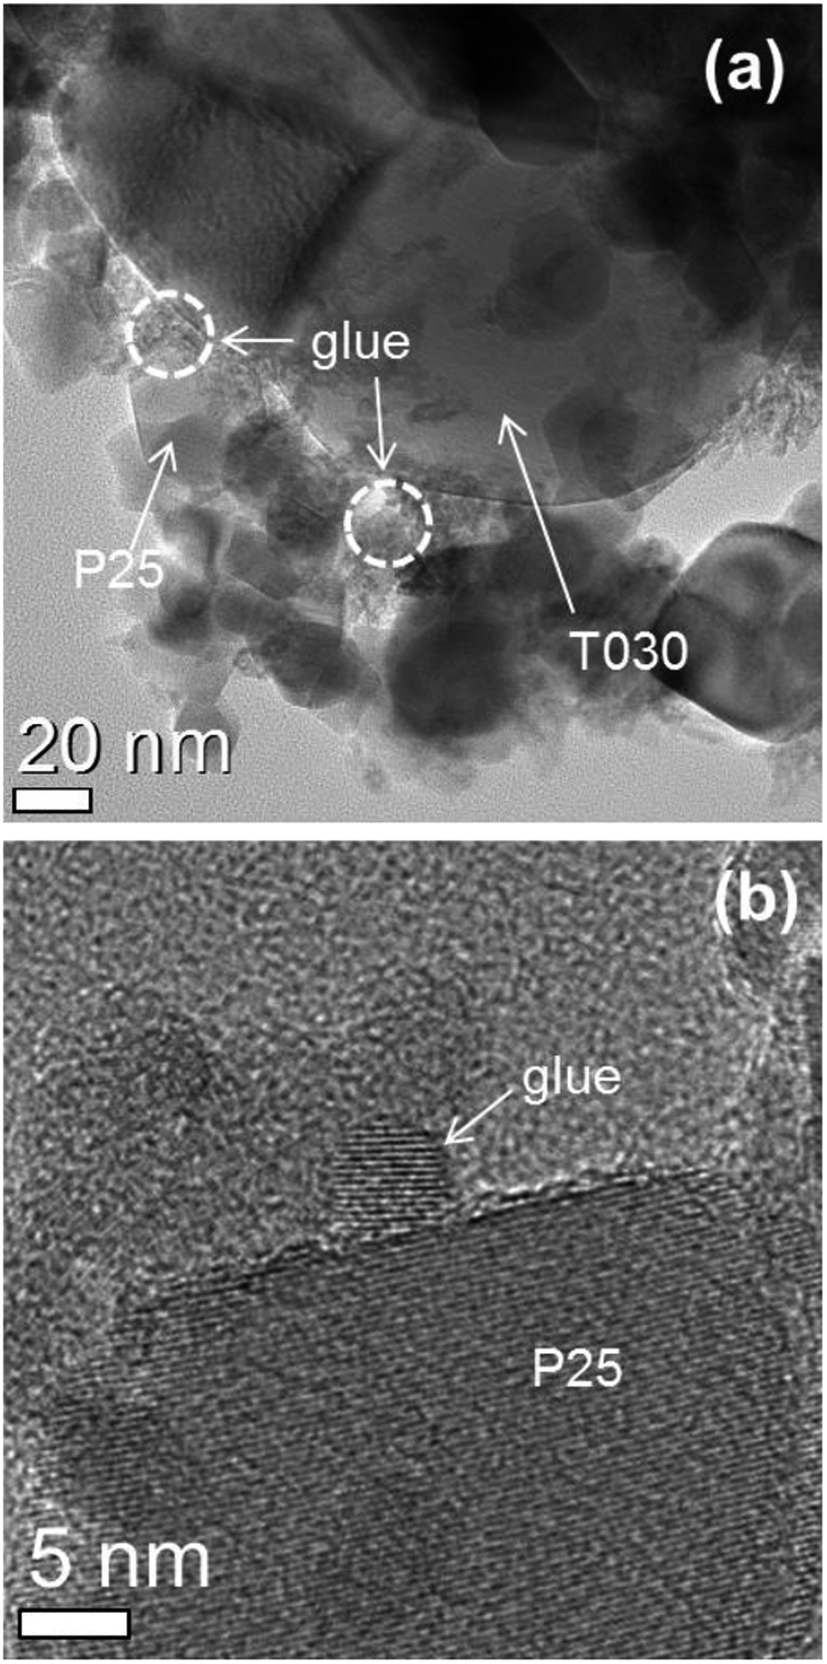 | ||
| Fig. 1 TEM images of TiO2 films that were partially removed from the substrate prior to compression (a) and enlarged image (b). | ||
 | ||
| Fig. 2 SEM images of films pressed with various compression forces showing film morphologies and structures. For comparison, films prepared with a compression pressure of 0 MPa (a and b), 40 MPa (c and d), 100 MPa (e and f), and 160 MPa (g and h) are observed. The images in the left column are of surface morphologies and those in the right column are of cross-section morphologies. | ||
Values of N = 6.2, N = 7.9, N = 10.9 and N = 12.4 are obtained for the films compressed at 0 MPa, 40 MPa, 100 MPa, and 160 MPa, respectively. For a particle network to be mechanically stable, the average N has to be at least 3.20 Hence, our results are in good agreement with the observation of crack-free films in all cases by SEM.20,21 Furthermore, better electron transport between nanoparticles is expected for structures with higher values of N.
The average photovoltaic properties of cells based on compressed films with thickness of about 6.5 μm were summarized in Table 1; graphical representation together with photocurrent–voltage, IPCE curves of these data can also be found in Fig. S4.† As clearly seen in Table 1, the cell which was just dried at room temperature in air without compression has the lowest efficiency; we use the photovoltaic parameters values of this cell as our reference. After compression at 40 MPa, the short-circuit current (JSC) of the cells is remarkably enhanced from 5.42 mA cm−2 to 8.46 mA cm−2. The JSC continuously increases with increasing compression and reaches a maximum of 9.64 mA cm−2 at a pressure of 100 MPa; a 78% improvement with respect to the reference is observed. Such significant enhancement in JSC can be attributed to the enhanced interparticle connectivity caused by compression. Interestingly, JSC began to decrease with further increase of compression pressure, as will be discussed later. On the other hand, the open circuit voltage (VOC) increases from 778 mV in the reference cell to approximately 795 mV in the cell in which the electrode is compressed at 40 MPa; no significant variations are observed after further compression. The fill factor (FF) shows similar tendencies to the VOC. The power conversion efficiency (η) follows the same trend as the JSC and a significantly increase from 2.86% to 5.31% is observed after compression at 100 MPa. Unlike the significant increase of cell performance from 2.86% for uncompressed cell to 4.66% for compressed cell at 40 MPa, the increment of performance was not so noticeable when higher compression force were applied. This is probably due to the trade-off relationship between interconnectivity of nanoparticles and mass transport (ionic diffusion) of electrolyte in the pores. Higher compression could induce tighter interparticle connection, which is favorable for the electron transport, but at the same time, it could reduce the porosity of films and pores size, which would retard the electrolyte diffusion in the pores. Consequently, the degree of compression affects the cell performance. Under our experimental conditions, compressed cells with 100 MPa always presented the best cell performance and highest average performance, which is in good agreement with previous observations for compressed cells.2,10
:15). The data is averaged from at least three points
| Sample | J SC (mA cm−2) | V OC (V) | FF | η (%) |
|---|---|---|---|---|
| 0 MPa | 5.42 ± 0.26 | 0.778 ± 0.005 | 0.68 ± 0.01 | 2.86 ± 0.16 |
| 40 MPa | 8.46 ± 0.29 | 0.788 ± 0.007 | 0.70 ± 0.01 | 4.66 ± 0.21 |
| 60 MPa | 8.68 ± 0.24 | 0.793 ± 0.004 | 0.69 ± 0.02 | 4.78 ± 0.13 |
| 80 MPa | 8.75 ± 0.13 | 0.786 ± 0.007 | 0.70 ± 0.01 | 4.82 ± 0.10 |
| 100 MPa | 9.64 ± 0.04 | 0.797 ± 0.003 | 0.69 ± 0.01 | 5.31 ± 0.10 |
| 120 MPa | 9.29 ± 0.28 | 0.796 ± 0.008 | 0.70 ± 0.01 | 5.18 ± 0.17 |
| 140 MPa | 8.59 ± 0.68 | 0.794 ± 0.014 | 0.68 ± 0.01 | 4.67 ± 0.38 |
| 160 MPa | 8.03 ± 1.07 | 0.798 ± 0.021 | 0.71 ± 0.02 | 4.54 ± 0.48 |
It is also worth mentioning that the most efficient reference cell reached an efficiency of 3.02%, which is comparable or even higher than many published results for films produced with physical compression or sintering treatment;22,23 this demonstrates the beneficial effect of using nanoglue in the binder-free paste. The synergic effect of physical compression and chemical sintering was confirmed by evaluating the effect of heating a ternary particle based electrode to 130 °C without applying any pressure; a cell displaying a 4.50% power conversion efficiency was obtained. η is well below 5.38% which was attained for a cell with electrodes that had been simultaneously compressed and chemically sintered at 130 °C; comparative data is provided in Table S2.†
A series of studies were conducted to determine the origin of the enhancement of the photovoltaic properties by simultaneous chemical sintering and compression. Due to its dominant role in determining cell efficiency, parameters affecting the JSC were first considered. JSC is the product of light harvesting by the dye, electron injection (from the excited state of the dye to the conduction band of TiO2), and charge collection efficiencies.24 The dye load of each compressed electrode was examined according to the procedures described in the experimental section. Fig. 3 is a plot of the dye load and JSC as a function of the compression pressure; it can be seen that even when the dye load was slightly reduced, the JSC gradually increased with compression pressure as the structure densified. As long as the amount of absorber is basically preserved, the observed increase in JSC should be attributed to either improved charge injection or electron diffusion; improved charge injection is not expected to be affected by compression, while electron diffusion depends on the phenomena of electron transport and recombination. The reason for the increase in JSC was investigated using electrochemical impedance spectroscopy (EIS) under one-sun illumination with open circuit and in the dark with applied forward potential. The frequency resolved information at the individual interfaces can be quantitatively investigated by fitting Nyquist plots to proper equivalent models.25–27 It is generally known that the semicircles occurring in the range of 101 to 102 Hz and 102 to 103 Hz are related to the charge transfer process at the TiO2/electrolyte interface and the injection of electrons into the TiO2 films, respectively. The higher frequency semicircles (in the kHz range) are associated with charge transfer at the Pt counter electrode and/or electrical contact between the ITO/TiO2 films. Semicircles at lower frequencies (less than 10 Hz) represent redox ionic diffusion within the electrolyte.28 The impedance spectra were first recorded at one sun illumination with open circuit condition and typical Nyquist plots were obtained (Fig. 4). As seen in Fig. 4(a), the impedance arc of films produced without compression was a little distorted in the range used for the estimation of electron transport resistance in TiO2 films.29 The distortion is usually originates from poor connection between TiO2 nanoparticles and indicates that the electron transport resistance is much greater than charge transfer resistance at the TiO2/electrolyte interface.12 Contrarily, all compressed films display the typical three-semicircles, which can be clearly decoupled, implying enhanced interconnection within the TiO2 photoelectrodes after compression. Spectra were fitted using the equivalent circuit model and the results are summarized in Table S3.† The resistance (R1), estimated from the semicircle at high frequency, generally includes information on the charge transfer at the counter electrode and the electrical contact between TiO2 and ITO substrates. As the same platinized counter electrodes are used for all cells, differences in R1 may be mainly ascribed to variations of the electrical contact resistance between the TiO2 films and ITO substrates. R1 was significantly reduced from 5.82 to 1.89 Ω after simultaneous chemical sintering and compression, highlighting the good adhesion between the TiO2 films and ITO substrates in the compressed films. The resistance R2, extracted from the analysis of the second semicircle, carries information on the charge transfer process at the interface between the TiO2 and the electrolyte. The relatively higher values of R2 attained from cells based on compressed films indicate less recombination in the cells with compressed films, which led to a relatively higher observed VOC for cells containing compressed films. Finally, the effect of compression on the diffusion of electrolyte within the TiO2 films was determined by evaluating the Warburg impedance (W1). Larger W1 was found from the films under analysis; this indicates that the reduced porosity resulting from compression hinders ionic diffusion of redox ionic species. The diffusion coefficients (DR) were also calculated based on the fitted data of low frequency semicircles as follows:28
| DR = (1/2.5)δ2ωmax | (2) |
 | ||
| Fig. 3 The dye loading amount for films compressed with various compression forces. For comparison, the averaged JSC from three cells made of same condition was also plotted. | ||
 | ||
| Fig. 4 Nyquist plots of impedance spectra from cells prepared with compression forces of 0 MPa, 40 MPa, 100 MPa, and 160 MPa; spectra were recorded at one-sun illumination with open circuit condition. | ||
Cells were also evaluated by EIS in the dark with a variation of bias voltage using the transmission line model. By interpreting these measurements, in contrast to those realized under illumination with open circuit voltage, electron transport within the TiO2 network and charge transfer at the interface of TiO2/electrolyte could be more clearly evaluated. While decreasing the forward bias potential from 0.75 to 0.55 V, electron transport in the mesoscopic TiO2 film is characterized by a Warburg-like diffusion behavior in the high-frequency region (a straight line) and mid-frequency region (a large semicircle)corresponding to an interfacial charge recombination processes.26,28,30 The reaction of photogenerated electrons with the I3− ions at the TiO2/electrolyte interface typically depends on the transport of both the electrons within the interconnected TiO2 nanoparticles chains and the redox species throughout the pore network of the mesostructure. If L is the thickness of the TiO2 film, then the electron transport resistance in the TiO2 film is Rt = rtL, where rt is the inter-particle resistance. The overall recombination resistance is Rct = rct/L where rct is the charge-transfer resistance opposing the recombination process between electrons in the mesoscopic TiO2 film and I3− in the electrolyte. The chemical capacitance is Cμ = cμL where cμ is the inter-particle chemical capacitance. Therefore, the electron transport and recombination behavior may be quantitatively examined by fitting the Nyquist plot with ideal characteristics of the diffusion-recombination model with Rct ≫ Rt and calculated according to the equation.26,28
From the fitted data, we could calculate the evolution of parameters such as electron diffusion coefficient (Dn), electron diffusion length (Ln) and charge collection efficiency (ηcc) according to the following equations:30,31
| Dn = L2/(RtCμ) | (3) |
 | (4) |
| ηcc = 1 − Rt/(Rt + Rct) | (5) |
For an efficient cell, it is essential to have the longer Ln, higher ηcc and Dn at any bias voltage between short circuit and open circuit. A simple illustrative electron transport and recombination scheme is shown in Fig. 5(a) based on the fitted Rt and Rct with the calculated Dn, Ln, and ηcc. As forward bias increases, more electrons are injected from the ITO substrate into the TiO2 conduction bands and the film is further charged by the accumulated electrons through the mesoscopic TiO2 nanoparticle networks. The degree of electron accumulation can be reflected by an upshift of quasi-Fermi level (EFn) of the TiO2 films. Therefore, the connectivity of TiO2 nanoparticles would also affect the shift of EFn. According to trap-detrap model accounting for electron transport mechanism in DSCs, the potential difference between EFn and the conduction band influences electron transport.32 Hence, if the connectivity of TiO2 network is good enough, a relatively smaller forward bias is required to achieve similar Rt as well as EFn. As shown in Fig. 5(b), less forward bias is required for DSCs prepared with compression until 100 MPa, which constitutes additional evidence of the improved connectivity of TiO2 nanoparticles. However, it is also observed that higher forward bias is required for cells with electrodes prepared using compression of 160 MPa than those prepared with 40 MPa compression which indicates an increased electron transport resistance under excessive compression. The main reason for slowing electron transport behavior with compression of 160 MPa is probably due to the reduced porosity (22.3%) and pore size (2.36 nm), which retards diffusion of the electrolyte cation through the mesoscopic structure of TiO2 to neutralize the charged sites on the surface of TiO2 nanoparticles (Table S3†); this which gives rise to higher Rt.33 On the other hand, no significant difference of Rct is observed between the DSCs with compressed films, implying that almost similar recombination events occur for those cells, as shown in Fig. 5(c). Nevertheless, the smallest Rct was obtained from cells made of uncompressed electrodes, which is in good agreement with the VOC trends reported in Table 1. The competition between charge collection and charge recombination in the DSCs can be expressed in terms of Dn, Ln and ηcc as displayed in Fig. 5(d)–(f). It can be concluded that cells made of compressed films present better diffusion and cells prepared with an electrode pressed at 100 MPa exhibit the best performance. Additionally, a longer Ln was achieved from the compressed films than has been previously published for electrodes sintered at low temperature;6,34–36 an Ln of approximately 25 μm was achieved for the best performing cells of compressed films. This result confirms the benefit of the combined effect of chemical and physical sintering. The ηcc is evaluated by eqn (5); generally, higher ηcc is desirable for an efficient solar cell.31 As shown in Fig. 5(f), a great improvement of ηcc was demonstrated from compressed cells; ηcc of 95% was obtained for the cells compressed at 100 MPa. It is concluded that the synergetic approach combining physical sintering and chemical sintering effectively reinforced the connectivity of nanoparticles, resulting in an efficient electron transport through the TiO2 network. In order to further enhance the efficiency, the thickness of TiO2 film was tailored from 6.5 μm up to 8.7 μm. By doing so, the JSC increased from 9.67 mA cm−2 to 11.02 mA cm−2 and led to a 6.38% power conversion efficiency (Fig. 6(a) and (b)). The schematic of typical anode made of binder-free titania film is depicted in the Fig. 6(a) together with photovoltaic properties summarized in the inserted table. It is reasonable to expect further improvement of cell performance by replacing commercial P25 nanoparticles with better home-synthesized TiO2 nanoparticles.
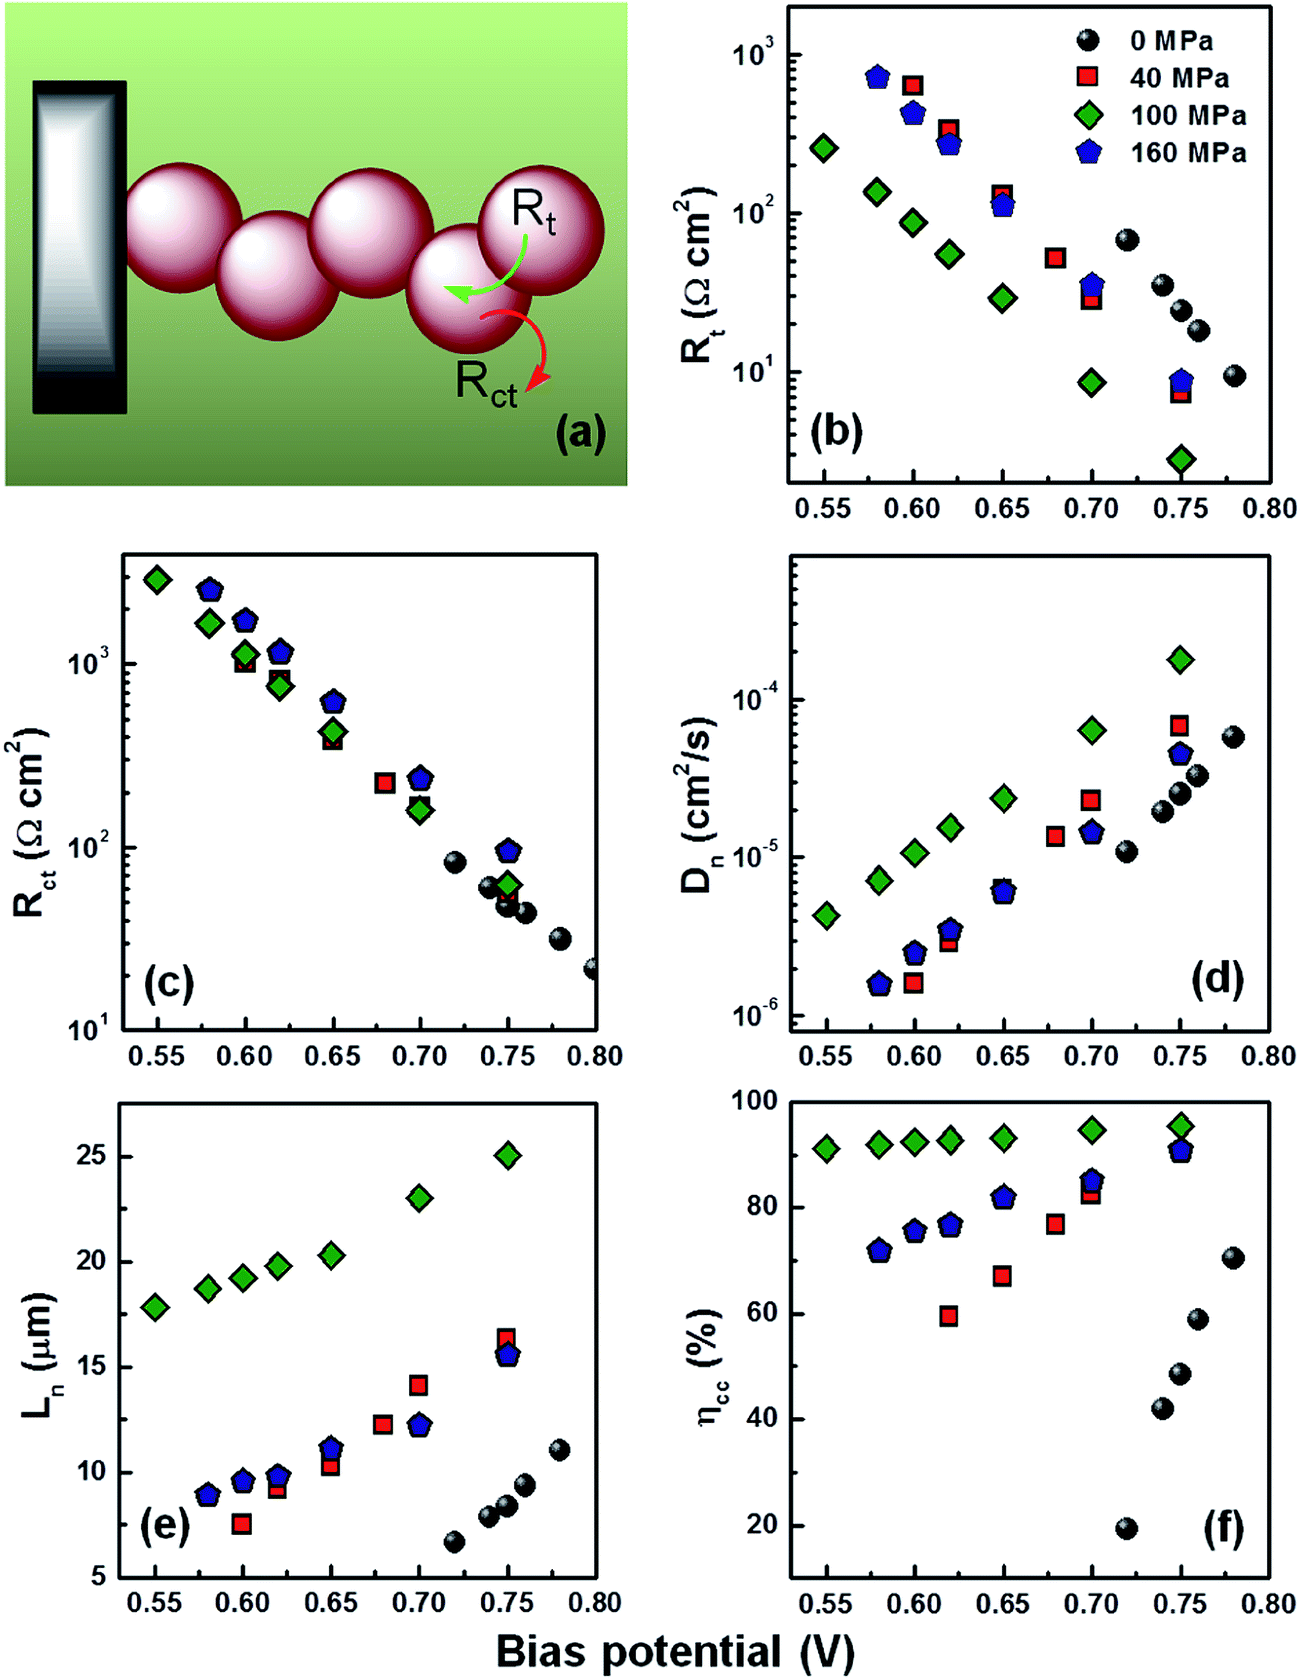 | ||
| Fig. 5 Schematic of electron transport and recombination (a). The fitted Rt (b), Rct (c) and calculated Dn (d), Ln (e), ηcc (f) of compressed films at various compression forces as measured in the dark by electrochemical impedance spectroscopy. | ||
 | ||
| Fig. 6 The current–voltage curve (a) and IPCE (b) of the optimized cell with TiO2 film thickness of 8.72 μm. The schematic of the films' structure and composition is presented in inset along with the summarized photovoltaic properties. | ||
Conclusion
We have shown that combining physical sintering with chemical sintering using nanoglue particles enhances nanocrystalline particle interconnectivity within TiO2 electrodes of dye solar cells. This approach has been applied for the preparation of photoanodes on a conductive ITO/PEN substrate for the generation of highly efficient plastic DSCs. The effect of compression on the structural and photovoltaic properties of the plastic DSCs was thoroughly investigated and rationalized. The electron transport resistance in compressed TiO2 films gradually decreased as the applied pressure increased from 0 MPa to 100 MPa, revealing the enhanced interconnectivity of TiO2 nanoparticles. Furthermore, the improved electron diffusion coefficient, electron diffusion length, and charge-collection efficiency were also studied for TiO2 films prepared under different conditions. State-of-the-art cells on plastic substrates displaying power conversion efficiencies of 6.4% were realized employing widely-used and commercial-available P25 particles to prove the feasibility of the proposed method. Future work should focus on the optimization of the optical design of the cell to maximize light harvesting, as well as on the preparation of a fully flexible solar cell based on this synergic concept.Acknowledgements
MJK acknowledge funding support from the Global Frontier R&D Program on Center for Multiscale Energy System (2012M3A6A7054856) and 2015 University-Institute cooperation program funded by the National Research Foundation under the Ministry of Science, ICT & Future Planning, Korea; this work was also supported by the KIST institutional programs and by Global Competitive Technology Development Program “Development of high drapability of textile type dye-sensitized solar cell materials and outdoor applications. (No. 10052064)” funded by the Ministry of Trade Industry & Energy (MOTIE). YL acknowledges the financial support from the People Programme (Marie Curie Actions) of the European Union's Seventh Framework Programme FP7/2007-2013/ under REA grant agreement no. 622533. HM acknowledges funding from the European Research Council under the European Union's Seventh Framework Programme (FP7/2007-2013)/ERC grant agreement no. 307081 (POLIGHT) and the Spanish Ministry of Economy and Competitiveness under grant MAT2011-23593.References
- T. Miyasaka, M. Ikegami and Y. Kijitori, J. Electrochem. Soc., 2007, 154, A455–A461 CrossRef CAS.
- T. Yamaguchi, N. Tobe, D. Matsumoto and H. Arakawa, Chem. Commun., 2007, 4767–4769 RSC.
- X. Li, H. Lin, J. Li, N. Wang, C. Lin and L. Zhang, J. Photochem. Photobiol., A, 2008, 195, 247–253 CrossRef CAS.
- N. G. Park, K. M. Kim, M. G. Kang, K. S. Ryu, S. H. Chang and Y. J. Shin, Adv. Mater., 2005, 17, 2349 CrossRef CAS.
- Y. Li, W. Lee, D. K. Lee, K. Kim, N. G. Park and M. J. Ko, Appl. Phys. Lett., 2011, 98, 103301 CrossRef.
- Y. Li, K. Yoo, D.-K. Lee, J. Y. Kim, H. Kim, B. Kim and M. J. Ko, Nanoscale, 2013, 5, 4711–4719 RSC.
- H. C. Weerasinghe, P. M. Sirimanne, G. V. Franks, G. P. Simon and Y. B. Cheng, J. Photochem. Photobiol., A, 2010, 213, 30–36 CrossRef CAS.
- H. Lindstrom, E. Magnusson, A. Holmberg, S. Sodergren, S. E. Lindquist and A. Hagfeldt, Sol. Energy Mater. Sol. Cells, 2002, 73, 91–101 CrossRef.
- J. Halme, J. Saarinen and P. Lund, Sol. Energy Mater. Sol. Cells, 2006, 90, 887–899 CrossRef CAS.
- X. Zhao, H. Lin, X. Li and J. Li, Electrochim. Acta, 2011, 56, 6401–6405 CrossRef CAS.
- Z. Dongshe, T. Yoshida, T. Oekermann, K. Furuta and H. Minoura, Adv. Funct. Mater., 2006, 16, 1228–1234 CrossRef.
- H.-Y. Jin, J.-Y. Kim, J. A. Lee, K. Lee, K. Yoo, D.-K. Lee, B. Kim, J. Y. Kim, H. Kim, H. J. Son, J. Kim, J. A. Lim and M. J. Ko, Appl. Phys. Lett., 2014, 104, 43902 CrossRef.
- H. C. Weerasinghe, F. Huang and Y.-B. Cheng, Nano Energy, 2013, 2, 174–189 CrossRef CAS.
- H.-P. Jen, M.-H. Lin, L.-L. Li, H.-P. Wu, W.-K. Huang, P.-J. Cheng and E. W.-G. Diau, ACS Appl. Mater. Interfaces, 2013, 5, 10098–10104 CAS.
- M. J. Yun, S. I. Cha, S. H. Seo and D. Y. Lee, Sci. Rep., 2014, 4, 5322 CAS.
- T. Yamaguchi, N. Tobe, D. Matsumoto, T. Nagai and H. Arakawa, Sol. Energy Mater. Sol. Cells, 2010, 94, 812–816 CrossRef CAS.
- H. Arakawa, T. Yamaguchi, T. Sutou, Y. Koishi, N. Tobe, D. Matsumoto and T. Nagai, Curr. Appl. Phys., 2010, 10, S157–S160 CrossRef.
- H.-W. Chen, C.-Y. Hsu, J.-G. Chen, K.-M. Lee, C.-C. Wang, K.-C. Huang and K.-C. Ho, J. Power Sources, 2010, 195, 6225–6231 CrossRef CAS.
- K. D. Benkstein, N. Kopidakis, J. van de Lagemaat and A. J. Frank, J. Phys. Chem. B, 2003, 107, 7759–7767 CrossRef CAS.
- J. van de Lagemaat, K. D. Benkstein and A. J. Frank, J. Phys. Chem. B, 2001, 105, 12433–12436 CrossRef CAS.
- D. Bouvard and F. F. Lange, Phys. Rev. A: At., Mol., Opt. Phys., 1992, 45, 5690–5693 CrossRef.
- K. Fan, C. Gong, T. Peng, J. Chen and J. Xia, Nanoscale, 2011, 3, 3900–3906 RSC.
- X. Li, H. Lin, J. Li, X. Li, B. Cui and L. Zhang, J. Phys. Chem. C, 2008, 112, 13744–13753 CAS.
- A. G. Agrios and A. Hagfeldt, J. Phys. Chem. C, 2008, 112, 10021–10026 CAS.
- J. Bisquert, J. Phys. Chem. B, 2002, 106, 325–333 CrossRef CAS.
- F. Fabregat-Santiago, J. Bisquert, G. Garcia-Belmonte, G. Boschloo and A. Hagfeldt, Sol. Energy Mater. Sol. Cells, 2005, 87, 117–131 CrossRef CAS.
- T. Hoshikawa, M. Yamada, R. Kikuchi and K. Eguchi, J. Electrochem. Soc., 2005, 152, E68–E73 CrossRef CAS.
- M. Adachi, M. Sakamoto, J. Jiu, Y. Ogata and S. Isoda, J. Phys. Chem. B, 2006, 110, 13872–13880 CrossRef CAS PubMed.
- J. Bisquert, G. Garcia-Belmonte, F. Fabregat-Santiago, N. S. Ferriols, P. Bogdanoff and E. C. Pereira, J. Phys. Chem. B, 2000, 104, 2287–2298 CrossRef CAS.
- Q. Wang, S. Ito, M. Graetzel, F. Fabregat-Santiago, I. Mora-Sero, J. Bisquert, T. Bessho and H. Imai, J. Phys. Chem. B, 2006, 110, 25210–25221 CrossRef CAS PubMed.
- Q. Wang, Z. Zhang, S. M. Zakeeruddin and M. Graetzel, J. Phys. Chem. C, 2008, 112, 7084–7092 CAS.
- J. Bisquert, F. Fabregat-Santiago, I. Mora-Sero, G. Garcia-Belmonte and S. Gimenez, J. Phys. Chem. C, 2009, 113, 17278–17290 CAS.
- F. Fabregat-Santiago, J. Bisquert, L. Cevey, P. Chen, M. Wang, S. M. Zakeeruddin and M. Graetzel, J. Am. Chem. Soc., 2009, 131, 558–562 CrossRef CAS PubMed.
- S. Nakade, M. Matsuda, S. Kambe, Y. Saito, T. Kitamura, T. Sakata, Y. Wada, H. Mori and S. Yanagida, J. Phys. Chem. B, 2002, 106, 10004–10010 CrossRef CAS.
- H.-W. Chen, Y.-T. Liao, J.-G. Chen, K. C. W. Wu and K.-C. Ho, J. Mater. Chem., 2011, 21, 17511–17518 RSC.
- A. R. Pascoe, F. Huang, N. W. Duffy and Y.-B. Cheng, J. Phys. Chem. C, 2014, 118, 15154–15161 CAS.
Footnotes |
| † Electronic supplementary information (ESI) available. See DOI: 10.1039/c5ra10290a |
| ‡ These authors contribute equally to this work. |
| This journal is © The Royal Society of Chemistry 2015 |