Photo-catalytic deactivation of sulfate reducing bacteria – a comparative study with different catalysts and the preeminence of Pd-loaded WO3 nanoparticles

Mohammed A. Gondal*a, Mohamed A. Dastageera, Amjad B. Khalilb, Siddique G. Rashida and Umair Baigac
aLaser Research Group, Physics Department & Center of Excellence in Nanotechnology King Fahd University of Petroleum and Minerals, Dhahran 31261, Saudi Arabia. E-mail: magondal@kfupm.edu.sa; Fax: +966-3-8604281; Tel: +966-3-8602351 Tel: +966-3-8603274
bBiology Department, King Fahd University of Petroleum and Minerals, Dhahran 31261, Saudi Arabia
cCenter of Excellence for Scientific Research Collaboration with MIT, King Fahd University of Petroleum and Minerals, Dhahran 31261, Saudi Arabia

Received 28th May 2015 , Accepted 3rd June 2015

First published on 3rd June 2015


Abstract

Sulfate reducing bacteria (SRB), predominantly present in the produced water in oil fields is known for being an agent for degrading the quality of crude oil by introducing an elevated level of sulfur content, initiating oil souring and corroding the oil pipelines. In addition, this bacterium poses an immense health threat to the oil field workers due to the generation of radioactive barium sulfide. Photo-catalytic deactivation of the sulfate reducing bacteria in water with four different pure and palladium loaded photo-catalysts was carried out and their relative efficiencies are compared. It was found that n-Pd/WO3 at an optimum concentration, in conjunction with 355 nm pulsed laser radiation showed a substantial increase in the photo-catalytic deactivation of SRB in contaminated water. A 110 fold increase in the SRB deactivation rate, compared to UV radiation (in the absence of catalyst) and a 30 fold increase in the same, compared to pure WO3, and the bench mark catalyst (TiO2) under the same experimental conditions was observed. All the nano-structured photo-catalysts were synthesized, optically and morphologically characterized to optimize the function of each catalyst effective in the deactivation of harmful sulfate-reducing bacteria in water.

1. Introduction

Sulfate-reducing bacteria (SRB) are anaerobic microorganism that plays an important role in biogeochemical processes1–3 and they use sulfate instead of oxygen for respiration and hence they can survive and multiply in low oxygen environments. SRB can convert sulfate or sulfite present in water to hydrogen sulfide (H2S), which combines with iron to form stubborn iron sulfide scale. SRB accumulation increases the corrosiveness of the water in the oil field, and leads to hydrogen blistering or sulfide stress cracking in the pipeline. The corrosion of iron by SRB is rapid, and unlike ordinary rust, is not self-limiting. Besides being a well-known agent for scale formation in the oil field installations, the presence of SRB can also lead to the degradation of oil quality with high sulfur content and souring. Deactivation of SRB from the waters in the oil fields can reduce the rust formation, production of deadly hydrogen sulfide, radioactivity and the degradation of oil quality. In order to control the growth of SRB, many methods like usage of bactericides, removal of sulfate from water, applying caustic washing to eliminate H2S, and also oxidizing H2S to elemental sulfur have been tried. Most of the organic bactericides like formaldehyde, phenolic and quaternary amine compounds, glutaraldehyde, chlorine, acrolein are hazardous to the environment and also human health. Also, in time SRB becomes resistant to these lethal bactericides, in spite of its high dosage and repeated use. The microbiological process of deactivating SRB has also been proposed, where another breed of bacteria, like denitrifying bacteria and sulfide-oxidizing bacteria are introduced to compete with SRB for organic nutrients and thereby inhibiting their growth. All these methods of controlling SRB have not produced the desired effect due to the complexity of the methods.4,5

Photo-catalytic reactions with an efficient new generation heterogeneous photo-catalysts have been applied to oxidize the bacterial cell membrane by photo-induced redox reactions. In photo-catalytic process, catalytic semiconductor particles generate electron–hole pairs (e/h+) upon the exposure of radiations with an energy more than the band gap energy (Eg) of the semiconductor. A good photo-catalytic material prevents the electron–hole recombination, and makes them available for the photo-catalytic activity and also the major factors that affects the photo-catalytic activity is the band gap energy, position of the lowest level of the conduction band, highest level of the valence band of the semiconductor material used. Although the band energy decides the photon energy of the radiation to be used, the highest point of the valence band is the main determinant of the oxidative decomposition power of the photo-catalyst. The electron–hole pairs, generated by photo excitation can move to the surface of semiconductor particle to form a highly oxidizing radicals like ˙OH (hydroxyl radical) and ˙O2 (super-oxide radical) and these radicals effectively oxidize the cell membrane and damage the microbial organism.6 Moreover the extent of microbial damage depends on how effectively the cell walls and cell membrane succumb to the oxidative process.6

The effectiveness of disinfecting SRB only with UV radiation (in the absence of catalyst)7,8 and filtration methods9–11 have been tried and the results have been quite encouraging in the case of photo reactions. In this work also, we initially estimated the disinfection process of SRB with 355 nm UV radiation (without catalyst) and in spite of increased laser pulse energy the SRB deactivation was slow and needed long exposure time and higher intensity of radiation. Various reports on photo-catalytic deactivation/disinfection of bacteria such as Escherichia coli, Lactobacillus acidophilus, Saccharomyces cerevisiae etc. using pure and modified TiO2 and WO3 photo-catalysts have already been published.12–16 However pure and noble metal loaded TiO2 and WO3 photo-catalysts have not been used for photo-catalytic deactivation/disinfection of SRB according to the literature updates. Thus, in this work nanostructured palladium loaded tungsten oxide (n-Pd/WO3) was synthesized, optically and morphologically characterized to optimize this semiconductor material to function as an effective photo-catalyst in the process of deactivation of SRB. The synthesis of the photo-catalysts, their optical morphological studies, the culture and the quantification of SRB were all carried out in our lab. The SRB deactivation was quantified with three factors: the decay rate constant (k), the total depletion time (td) and the threshold time for the onset of decay process. It was found that n-Pd/WO3 at an optimum concentration in the contaminated water showed a remarkable 110 fold increase in the SRB deactivation compared to UV radiation in the absence of catalyst and also 30 fold increase in the SRB deactivation compared to conventional pure WO3, and TiO2 semiconductor catalyst in the presence of UV radiation. In addition to the UV region, n-Pd/WO3 is highly effective in the visible region of the solar spectrum and hence can be effectively used for energy harvesting with various useful photochemical and photo biological processes.

2. Materials and methods

2.1. Synthesis of nano catalysts

The pure n-WO3 nanostructures were prepared by precipitation method as reported by Supothina et al.17 Briefly, pre-determined amount of ammonium tungstate pentahydrate ((NH4)10W12O41·5H2O) was dissolved in deionized water by heating at 85 °C and this was followed by dropwise addition of warm and concentrated nitric acid (HNO3, Merk) with vigorous stirring. The obtained precipitates, after settling down for 24 hours, were thoroughly washed with deionized water. Finally, the precipitates were filtered, by centrifugation, dried and calcined at 500 °C for 6 h at ramp rate of 1 °C. Also n-TiO2 nanoparticles were synthesized by using decomposition-precipitation technique; titanium(III)sulfate solution (Sigma-Aldrich) was added into hot sulfuric acid. The resultant solution was precipitated by adding excess amount of urea followed by heating at 90 °C. The precipitates were thoroughly washed and calcined at 400 °C for 3 h with ramp rate of 1 °C min−1. In the loading process, the prepared n-WO3 nanoparticles were loaded with Palladium by wet incipient technique. Highly concentrated solution of required palladium nitrate dihydrate (Pd(NO3)2·2H2O) in deionized water was poured dropwise with micropipette on WO3 nanostructure, and the resultant paste mixed, dried and calcinated at 400 °C. Finally, the obtained product was heated in programmable furnace for 3 h under continuous flow of highly pure hydrogen (99.99%) at 350 °C. Similar procedure was carried out for loading of Pd on TiO2.

2.2. Material characterization

The crystal structure of synthesized catalysts was analyzed with wide angle X-ray diffractometer (Philips X'Pert PRO 3040/60) equipped with Cu-Kα radiation source in 2θ = 20° to 2θ = 90° range. The transmission electron microscopy (TEM) images were recorded with Titan G2 80-300 (FEI Company, Hillsboro, USA), operated at a primary beam energy of 300 keV, while point-to-point analysis was performed at the same beam energy with a step of 0.235 nm. Elemental analysis was performed to confirm the palladium loading using energy dispersive analyzer unit (EDAX) coupled with FE-SEM (TESCAN FERA3). A charge-coupled device (CCD) camera (US4000, Gatan, Inc., Pleasanton, CA) was used to record digital images. A JASCO, V-670, UV-vis-NIR spectrophotometer was used for recording the solid-state absorption and diffused reflectance spectra (DRS) of the synthesized catalysts using BaSO4 pellet as a reference. The photoluminescence spectra were recorded using Shimadzu spectrofluorometer with 1200 grooves per mm.

2.3. Photo-catalytic reaction studies

The reaction cell has two 2 inch diameter quartz windows that let the laser beam in and out of the sample and at the same time withstand high energy laser pulse. The emerging laser beam is blocked with a laser beam block. The different catalyst concentration was maintained by adding different quantities of catalyst in the infected water and the reaction cell is kept on the magnetic stirrer which keeps the catalyst homogeneous inside the infected water. A 355 nm wavelength high power laser beam generated from the third harmonic of the Spectra Physics Nd:YAG laser (Model GCR 250), with a pulse width of ∼8 ns, was employed as a radiation source. The destructive effects of focused laser beam were minimized by expanding the diameter of the beam to 2 cm by using set of lenses and mirrors and this will ensure maximum interaction between photon and semiconductor material. The samples were collected at regular interval.

2.4. Culturing and counting of bacteria

ATCC 1249 medium, modified Baar's medium for sulfate reducers component was prepared and used for the growth of SRB. The medium was autoclaved and the nitrogen gas was bubbled through the medium for about 30 minutes to remove the dissolved oxygen in the liquid. The medium was transferred to an aerobic chamber with a clean nitrogen environment where inoculation took place. After distributing the medium in the flasks to the desired volume (100 ml) each flask was inoculated with SRB broth from a one-week old culture. The inoculum to medium volume ratio was 1%. SRB flask incubated at 30 °C for 7 days, this flask containing SRB is used for the experiment. 80 ml of SRB solution is irradiated with exposed the laser radiation of 355 nm wavelength and 40 mJ per pulse energy and 1 ml of aliquot was transferred to new sterile tube in a regular interval. The tube of each time point was serially diluted, and then samples of 100 μl from each tube were directly plated out on SRB agar plates (in duplicates) and incubated for 7 days at 30 °C. After the incubation time, the plates were observed under a colony counter and the number of colonies were visually recorded.18,19

3. Results and discussions

3.1. Morphological characterization of photo-catalysts

The XRD patterns for synthesized n-WO3 and n-Pd/WO3 are presented in Fig. 1a. All the main indexed peaks were fitted to the hexagonal WO3 system (JCPDS card 35-1001). Higher diffraction coming from (001) compared with other planes suggest that [001] is the major growth direction. After Pd loading on n-WO3, no change in XRD pattern was noticed, indicating the material is single phase and is impurity free. The Pd diffraction not appearing in the XRD pattern could be due to high dispersion of Pd nanoparticles over the n-WO3 matrix and small loading, around 1 wt%. However, crystallinity of n-Pd/WO3 was reduced and this could be due to the dispersed palladium covering WO3. Also the XRD patterns for n-TiO2 and n-Pd/TiO2 are presented in Fig. 1b. All the peaks can be indexed to anatase phase of TiO2, and the (101) is the major growth zone. After Pd loading, no extra peak was noticed that could be due to small loading of Pd, around 1 wt%, and high dispersion of Pd over the surface of TiO2. TEM analysis of n-Pd/WO3 revealed that WO3 nanoparticle were in the range of 60 to 100 nm size having plate and cylindrical like morphologies, as in our earlier report,20 while the palladium nanoparticles of 4 to 17 nm size were anchored on the WO3 particles as shown in Fig. 2a. The TiO2 nanoparticles having quasi-spherical were found in the range of 20 to 30 nm, and the palladium nanoparticles with spheroid morphologies were dispersed over the TiO2 matrix as shown in Fig. 2b. The EDX spectrum and quantitative results of n-Pd/WO3 [Fig. 2c and d] shows that the n-Pd/WO3 contains Pd in addition to W and O, which further provides the strong evidence that WO3 surface successfully loaded by Pd.
image file: c5ra10094a-f1.tif
Fig. 1 XRD Patterns of (a) n-WO3 and n-Pd/WO3 nanoparticles (b) n-TiO2 and n-Pd/TiO2 nanoparticles.

image file: c5ra10094a-f2.tif
Fig. 2 TEM images of (a) n-Pd/WO3, (b) n-Pd/TiO2, (c) EDX spectra of n-Pd/WO3 and (d) quantitative results of n-Pd/WO3.

3.2. Optical characterization of photo-catalysts

The optical properties of n-WO3 and n-Pd/WO3; n-TiO2 and n-Pd/TiO2 were estimated by applying Kubelka–Munk transformation on the reflectance data acquired by diffuse reflectance spectroscopy. The optical absorbance in term of Kubelka–Munk function is estimated using the following equation:
 
image file: c5ra10094a-t1.tif(1)
where R is the diffuse reflectance. We can observe two opposing changes in the absorption curves brought about by Pd loading as depicted in Fig. 3a and b: (i) enhanced visible light absorption and (ii) a slight blue shift in the absorption edge both in the case of n-TiO2 and n-WO3. The enhancement of the visible light absorption is attributed to the surface plasmon absorption of larger palladium nanoparticles and clusters, while the blue shift in absorption edge could be the result of smaller Pd particles, ∼6 nm, which absorb only in UV region.21 Photoluminescence spectra of both n-WO3 and n-Pd/WO3 are shown if Fig. 4, where there is substantial reduction of PL intensity upon loading, indicating the reduction of electron–hole pair recombination brought about by the Pd loading in WO3.

image file: c5ra10094a-f3.tif
Fig. 3 Optical absorptivity in terms of Kubelka–Munk function (a) n-WO3 and n-Pd/WO3 (b) n-TiO2 and Pd/TiO2.

image file: c5ra10094a-f4.tif
Fig. 4 Photoluminescence spectrum of n-WO3 and n-Pd/WO3 photocatalysts excited at 350 nm.

3.3. Photocatalytic deactivation of SRB using n-WO3, n-pd/WO3, n-TiO2 and n-pd/TiO2 catalyst

Fig. 5 is a typical exponential decay of SRB, representing the fastest SRB deactivation process, observed while using the optimum concentration of n-Pd/WO3 (1.5 mg ml−1 in SRB contaminated water) and with the laser radiation of 355 nm wavelength and 40 mJ pulse energy. The extent of deactivation of SRB is conveniently quantified in terms of the decay constant k (the slope of the linear ln[thin space (1/6-em)]N/N0 versus time plot) in the units of minute−1 and the total depletion time td (time required for the complete depletion) in the units of minutes. It is quite clear from Fig. 6 that the extent of SRB deactivation strongly depends on the n-Pd/WO3 concentrations, where the decay initially increases with the concentration, reaches to a maximum at an optimum n-Pd/WO3 concentration (1.5 mg ml−1 in SRB contaminated water). For all the decay curves in this work, the laser radiation of 355 nm wavelength with a pulse energy of 40 mJ was used. The initial SRB count was fixed to be 4 × 10⁷ counts per ml and also any SRB count below 150 counts per ml (corresponds to a value equal to −11.5 on the ordinate axes) is taken as complete depletion. When we compare the SRB depletion curve for no catalyst (Fig. 6a), pure n-WO3 (Fig. 6b) and n-Pd/WO3 (Fig. 6g), the decay rate constant increases from nearly zero in the case of no catalyst to 0.18 minute−1 with 1.5 mg ml−1 of pure n-WO3 and finally in the case of n-Pd/WO3 with the concentration of 1.5 mg ml−1, the decay rate constant substantially increased to a maximum of 5.4 minute−1. In all the decay curves with n-Pd/WO3 the rate constant is more than that for the pure n-WO3 and this increase of rate constant can be attributed to increased optical absorption resulted due to Pd loading explained in the previous section. Also we can observe in Fig. 6 that, although the decay rate constant initially increases with the catalyst concentration, beyond certain value (1.5 mg ml−1 in SRB contaminated water), the decay rate constant starts to decline. It is quite natural and it is clear from Fig. 6 that as the decay rate constant increases, the time required for the total depletion decreases. In the case of SRB decay curve corresponds to a catalytic concentration of 1.5 mg ml−1 of pure n-WO3 (Fig. 6b), it takes 64 minutes for the total depletion of SRB from the contaminated water, where as it takes just 2 minutes for the same with n-Pd/WO3 (Fig. 6b), indicating a remarkable enhancement of photo-catalytic deactivation. Fig. 7 shows the trends of both SRB decay constant (k) and the total depletion time (td) with the concentration of n-Pd/WO3 in the SRB contaminated water.
image file: c5ra10094a-f5.tif
Fig. 5 Typical exponential decay of SRB with 1.5 mg ml−1 of n-Pd/WO3 in contaminated water in the presence of with 40 mJ of 355 nm laser radiation.

image file: c5ra10094a-f6.tif
Fig. 6 Photocatalytic disinfection of SRB in water with n-Pd/WO3 in conjunction with 40 mJ of 355 nm laser radiation (a) no catalyst only laser (b) 1.5 mg ml−1 of pure n-WO3 (c) 0.5 mg ml−1 of n-Pd/WO3 (d) 3.0 mg ml−1 of n-Pd/WO3 (e) 2.0 mg ml−1 of n-Pd/WO3 (f) 1.0 mg ml−1 of n-Pd/WO3 (g) 1.5 mg ml−1 of n-Pd/WO3 in contaminated water.

image file: c5ra10094a-f7.tif
Fig. 7 The dependence of the SRB decay constants and total depletion time on the concentrations of photocatalysts in the contaminated water.

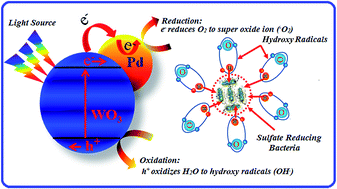
With the increased photo absorption of the catalytic material, more and more electron–hole pair is generated and this electron–hole pairs, move to the surface of semiconductor particle and form a highly oxidizing radicals like OH˙ (hydroxyl radical) and ˙O2 (super-oxide radical) and these radicals effectively oxidize the cell membrane and damage the microbial organism.22 Scheme 1 depicts the graphical illustration of the photo-catalytic deactivation of SRB. The hydroxyl radical generate oxygen while H+ ions form hydrogen by capturing conduction band electrons. The super-oxide radical (O2) and (OH˙) generated through laser induced photo-catalysis process kill the bacteria in contaminated water. This deactivation process of bacteria is effective as long as the cell membrane is exposed to the super-oxide (O2) and hydroxide (OH˙) radicals. When the concentration of the photo-catalyst increases beyond a certain level, the particles mask the bacterial surface, preventing the radical to effectively oxidize the bacterial cell membrane. Also in any photo-catalytic process, the electron–hole pair generated is prone to recombination and any technique that could inhibit the recombination can make use of more number of electron–hole pair available for the photo-catalytic reaction. The reduction of the photo luminescence signal in the case of n-Pd/WO3 compared to pure n-WO3 indicates a substantial reduction of electron–hole recombination process, which made more number of electron–hole pair available for the deactivation process of SRB in the case of n-Pd/WO3 used as the photo-catalyst.


image file: c5ra10094a-s1.tif
Scheme 1 Graphical illustration of the photocatalytic deactivation of SRB.

As TiO2 is a pioneer photo-catalyst, the study of the merit of any photo-catalyst will not be complete without benchmarking the new catalyst with ubiquitous TiO2 and its different loading variants. Fig. 8 shows the SRB decay curves with 1.5 mg ml−1 of pure n-TiO2 (Fig. 8d) n-Pd/TiO2 (Fig. 8b) along with the decay curves with no catalyst and pure n-WO3. Comparing the SRB decay curves for of pure n-TiO2 and n-Pd/TiO2, one can observe that the Pd loading in TiO2 brings about a reduction of the bacterial decay rate constant from 0.2 minute−1 to 0.12 minute−1. So it is quite clear from the decay curves of pure and Pd-loaded TiO2, the loading of Pd in TiO2 does not improve the photo-catalytic activity like in the case of WO3. This indicates that the increased SRB deactivation is not due to the mere presence of Pd in the photo catalyst; rather, the Pd loading brings about the change in the structure of the band gap that enables the increased light absorption and decreased electron–hole recombination. It is clear from Fig. 8 that although the TiO2 is a better photo-catalyst than n-WO3 in their pure form for SRB deactivation, the Pd loading in the former impedes the photo-catalytic deactivation, while Pd loading in the latter substantially enhances the photo-catalytic deactivation of SRB. The SRB decay rate constants k and the depletion time td for different catalysts and different concentrations of catalyst are shown in Table 1. Table 1 also shows the threshold time, which is the defined as the time taken after excitation for the onset of photo-deactivation of SRB. For all the deactivation with n-Pd/WO3, the threshold times are instant, while using no catalyst, pure n-WO3, n-Pd/TiO2 and n-TiO2, the threshold times are 20 minutes, 6 minutes, 8 minutes and 2 minutes respectively.


image file: c5ra10094a-f8.tif
Fig. 8 Photocatalytic disinfection of SRB in contaminated water with (a) no catalyst only laser (b) 1.5 mg ml−1 of n-Pd/TiO2 (c) 1.5 mg ml−1 of pure n-WO3 (d) 1.5 mg ml−1 of pure n-TiO2 with 40 mJ of 355 nm laser radiation.
Table 1 Catalytic performance indicators for the disinfection of SRB in contaminated water
Catalyst Catalyst concentration (mg ml−1) Decay rate constant (k) (min−1) Total depletion time (minutes) Threshold time (minutes)
No catalyst N/A 0.05 220 20
Pure n-WO3 1.5 0.18 64 6
n-Pd/WO3 0.5 0.21 55 Instant
n-Pd/WO3 1 1.14 10 Instant
n-Pd/WO3 1.5 5.40 2 Instant
n-Pd/WO3 2 0.58 20 Instant
n-Pd/WO3 3 0.27 43 Instant
Pure n-TiO2 1.5 0.20 58 2
n-Pd/TiO2 1.5 0.12 92 8


As explained in the optical characterization section, the observed blue shift due to the dopants of smaller size and the enhancement of the absorption through surface plasmon resonance due to the bigger particles favored the creation of more number of electron–hole pair and the impedance of their recombination in the case of n-WO3 but not in the case of n-TiO2. This is clear from the photoluminescence spectra of n-Pd/WO3 and n-WO3 depicted in Fig. 4, where it can be observed that the photo luminescence signal significantly reduced after Pd loading, indicating the reduced electron–hole pair recombination and on the other hand loading has made no change in the PL intensity of TiO2 except some minor statistical variations. As we know the surface plasmon resonance is a process due to the crucial interplay of concerted oscillations of free electrons trapped in the media and the electromagnetic waves and also very sensitive to the size, shape, composition and arrangement of metallic nanostructure.23–28 The blue shift in the absorption spectra through loading is too marginal both in n-TiO2 and n-WO3 to account for the substantial enhancement of the photo-catalytic deactivation of SRB with n-Pd/WO3. The surface plasmon resonance enhanced the absorption in the higher wavelength region both in the case of n-Pd/WO3 and n-Pd/TiO2 but the reduction of electron–hole recombination is achieved only in n-Pd/WO3 not in n-Pd/TiO2, which made the former a successful photo-catalyst for the deactivation of SRB.

4. Conclusion

Nanostructured palladium loaded tungsten oxide n-Pd/WO3 was synthesized, optically and morphologically characterized to optimize the semiconductor material to function as an effective photo-catalyst for various applications such as disinfectant, removal of toxic organic pollutants for clean water, desulfurization of crude oil and solar energy harvesting As an application related to the water in the oil fields, n-Pd/WO3 was used as a photo-catalyst in conjunction with 355 nm laser radiation/or sun to deactivate harmful sulfate-reducing bacteria in water. It was found that n-type Pd/WO3 at an optimum concentration in the contaminated water showed a remarkable 110 fold increase in the SRB deactivation compared to pure UV radiation in the absence of catalyst and also 30 fold increase in the SRB deactivation compared to conventional pure WO3, and TiO2 semiconductor benchmark catalyst in the presence of UV radiation. In addition to the UV region, n-Pd/WO3 is highly effective in the visible region of the solar spectrum and hence can be effectively used for energy harvesting with various useful photochemical and photo biological processes as for disinfection of many other pathogens like fungi, Candida and even some highly precarious and life threatening viruses and even cleaning of water from other organic contaminants.

Acknowledgements

The support of this work by KFUPM through the project numbers MIT-13103 and MIT-13104 under the Center of Excellence for Scientific Collaboration with MIT is gratefully acknowledged. The support of Physics Department of KFUPM is acknowledged.

References

  1. L. L. Barton and G. D. Fauque, Adv. Appl. Microbiol., 2009, 68, 41–98 CAS.
  2. N. Pfennig, F. WIddel and H. G. Truper, The dissimilatory sulfate reducing bacteria, in The Procaryotes. A handbook on habitats, isolation and identification of bacteria, Springer Verlag, New York, 1981 Search PubMed.
  3. A. C. Johnson and M. Wood, The ecology and significance of sulfate-reducing bacteria in sandy aquifer sediments of the London basin, W: Proceedings of International Symposium on Subsurface Microbiology, Bath, September 19–24, 1993 Search PubMed.
  4. M. Nemati, G. E. Jenneman and G. Voordouw, Biotechnol. Prog., 2001, 17, 852–859 CrossRef CAS PubMed.
  5. G. Voordouw, M. Nemati and G. E. Jenneman, Corrosion, 2002, 34, 1–6 Search PubMed.
  6. T. Matsunga, R. Tomoda, T. Nakajima and T. Komine, Appl. Environ. Microbiol., 1988, 54, 1330–1333 Search PubMed.
  7. H. Fleming and W. Huebner, Choosing the right disinfection technology for a municipal drinking water plant-Part 2, Water Eng. Manage., 2001, 148, 1 Search PubMed.
  8. B. Srikanth and D. Witham, Water and air treatment, Water Quality Products, 2001, vol. 6, p. 11 Search PubMed.
  9. T. Schaefer, Ultraviolet for disinfection, Water Quality Products, 2002, vol. 7, p. 4 Search PubMed.
  10. T. Matsunaga, R. Tomoda, T. Nakajima and H. Wake, FEMS Microbiol. Lett., 1985, 29, 211–214 CrossRef CAS PubMed.
  11. M. Lahlou, Membrane filtration as an alternative: Part-I, Water Eng. Manage., 2000, 147, 12–16 Search PubMed.
  12. X. Yang, J. Qin, Y. Jiang, R. Li, Y. Li and H. Tang, RSC Adv., 2014, 4, 18627–18636 RSC.
  13. N. M. Makwana, R. Hazael, P. F. McMillan and J. A. Darr, Photochem. Photobiol. Sci., 2015, 14, 1190 CAS.
  14. R. Sadowski, M. Strus, M. Buchalska, P. B. Heczko and W. Macyk, Photochem. Photobiol. Sci., 2015, 14, 514–519 CAS.
  15. D. M. A. Alrousan, P. S. M. Dunlop, T. A. McMurray and J. A. Byrne, Water Res., 2009, 43, 47–54 CrossRef CAS PubMed.
  16. M. Bodzek and M. Dudziak, Pol. J. Environ. Stud., 2006, 15, 35–40 CAS.
  17. S. Supothina, P. Seeharaj, S. Yoriya and M. Sriyudthsak, Ceram. Int., 2007, 33, 931–936 CrossRef CAS PubMed.
  18. J. Wen, D. Xu, T. Gu and I. Raad, World J. Microbiol. Biotechnol., 2012, 28, 431–435 CrossRef CAS PubMed.
  19. E. A. Ghazy, M. G. Mahmoud, M. S. Asker, M. N. Mahmoud, M. M. Abo Elsoud and M. E. Abdel Sami, Water, Am. J. Sci., 2011, 7, 604–608 Search PubMed.
  20. A. Abu Baker, N. Noor, N. Tahya, R. Rasol, M. Fahmy, S. N. Fariza and A. S. Alrashed, J. Biol. Sci., 2014, 14, 349–354 CrossRef.
  21. K. Hayat, M. A. Gondal, M. M. Khaled, Z. H. Yamani and S. Ahmed, J. Hazard. Mater., 2011, 186, 1226–1233 CrossRef CAS PubMed.
  22. Y. Xiong, J. Chen, B. Wiley, Y. Xia, Y. Yin and Z. Y. Li, Nano Lett., 2005, 5, 1237–1242 CrossRef CAS.
  23. T. Y. Leung, C. Y. Chan, C. Hu, J. C. Yu and P. K. Wong, Water Res., 2008, 42, 4827–4837 CrossRef CAS PubMed.
  24. S. Balci, C. Kocabas, S. Ates, E. Karademir, O. Salihoglu and A. Aydinli, Phys. Rev. B: Condens. Matter Mater. Phys., 2012, 86, 235402 CrossRef.
  25. Y. J. Bao, B. Zhang, Z. Wu, J. W. Si, M. Wang, R. W. Peng, X. Lu, J. Shao, Z. F. Li, X. P. Hao and N. B. Ming, Appl. Phys. Lett., 2007, 90, 251914–251917 CrossRef PubMed.
  26. H. J. Chen, X. S. Kou, Z. Yang, W. H. Ni and J. F. Wang, Langmuir, 2008, 24, 5233–5237 CrossRef CAS PubMed.
  27. G. Park, C. Lee, D. Seo and H. Song, Langmuir, 2012, 28, 9003–9009 CrossRef CAS PubMed.
  28. M. S. Yavuz, G. C. Jensen, D. P. Penaloza, T. A. P. Seery, S. A. Pendergraph, J. F. Rusling and G. A. Sotzing, Langmuir, 2009, 25, 13120–13124 CrossRef CAS PubMed.

This journal is © The Royal Society of Chemistry 2015