DOI:
10.1039/C5RA09875K
(Paper)
RSC Adv., 2015,
5, 81943-81956
Structure, stability, mechanical and electronic properties of Fe–P binary compounds by first-principles calculations
Received
26th May 2015
, Accepted 26th August 2015
First published on 3rd September 2015
Abstract
The equilibrium crystal structures, stability, elastic properties, hardness and electronic structures of Fe–P binary compounds (Fe3P, Fe2P, o-FeP-1, o-FeP-2, FeP2, m-FeP4-1, o-FeP4, m-FeP4-2) are investigated systematically by first principles calculations. The calculated formation enthalpy is used to estimate the stability of the Fe–P binary compounds. Fe3P has the largest formation enthalpy at −44.950 kJ mol−1 and o-FeP-2 has the smallest at −78.590 kJ mol−1. The elastic constants are calculated by the stress–strain method and the Voigt–Reuss–Hill approximation is used to estimate the elastic moduli. The mechanical anisotropy of FexPy compounds are studied using the anisotropic indexes and by plotting the 3D surface contour of Young’s modulus. The electronic structures and chemical bonding characteristics of the Fe–P binary compounds are interpreted by the band structures and density of states. Finally, the sound velocity and Debye temperatures of the Fe–P binary compounds are discussed.
1. Introduction
The iron–steel industry has been developing fast since the last century, which is representative of modern industry. A common non-metal element such as phosphorus would form enrichment regions during the casting process or some heat treatment conditions, (for example, grain-boundary segregation). Phosphorus would combine with iron to form Fe–P binary compounds including Fe3P, Fe2P, FeP, FeP2, and FeP4 according to the Fe–P equilibrium phase diagram.1 Moreover, phosphorus is usually considered hazardous to the properties of steel. But phosphorus existing in steel is inevitable. In order to control the effect of phosphorus in iron and steel, first of all, we should know the structure, stability and properties of the iron phosphides.
As a traditional industry, most research about the properties of steel has depended on experimental discovery. Therefore, it is difficult to explore the performance of these compounds at the electron-atomic level. The development of first-principles calculations based on density functional theory2,3 has made it possible to study the fundamental properties at the electron-atomic level of materials under difficult experimental conditions. Nevertheless, there are only a few reports on iron phosphides. Li et al.4 calculated the elastic constants and formation enthalpy of Fe2P by the first principles pseudo-potential plane wave method. They found that both of the hexagonal and orthorhombic Fe2P intermetallic compounds were ductile. The hexagonal structure was more stable than the orthorhombic structure for Fe2P. Chen et al.5 investigated the magnetic properties of Fe2P. They deduced the magnetic properties of the compound even under considerably high pressures above 5.0 GPa. Tobola et al.6 investigated the magnetism and band structure of Fe2P by neutron diffraction experiments and the KKR-CPA calculation method. However, most physical and chemical properties of Fe–P binary compounds are rarely reported systematically, so far. In this paper, the stability, mechanical properties and electronic structures of all the Fe–P binary compounds are investigated, and discussed for the first time, with a first-principles calculation method.
2. Calculation methods and models
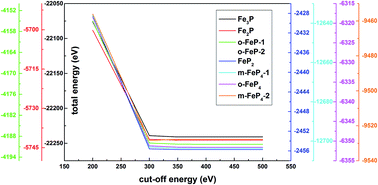
The first-principles calculations of Fe–P compounds have been performed by density functional theory (DFT) which was implemented in Cambridge sequential energy package (CASTEP) code.7 A generalized gradient approximation (GGA) approach in the form of Perdew–Burke–Ernzerhof (PBE) was used to calculate the exchange and correlation functional.8 The interactions between the ionic cores and the valence electrons were indicated by ultra-soft pseudo potentials. For Fe and P, the valence electrons considered were 3p64s23d6 and 3s23p3, respectively. A plane wave expansion method was applied for the optimization of the crystal structure. A special k-point sampling in the first irreducible Brillouin zone was confirmed by the Monkhorst–Pack scheme, and the k point mesh was selected as 3 × 3 × 9, 9 × 9 × 12, 6 × 6 × 12, 6 × 12 × 6, 9 × 6 × 15, 6 × 3 × 3, 6 × 3 × 6 and 9 × 3 × 6 for Fe3P, Fe2P, o-FeP-1, o-FeP-2 (CoAs-structure and MnP-structure, simplified as o-FeP-1 and o-FeP-2), FeP2, m-FeP4-1, o-FeP4 and m-FeP4-2, respectively. A kinetic energy cut-off value of 400.0 eV was used for the plane wave expansion in reciprocal space. The selected k point was three times as much as the default values, and the cut-off energy was tested. The result is shown in Fig. 1, the total energy will stay constant when the cut-off energy is larger than 380 eV for these compounds. So the selected values are suitable for the chosen system. The Broyden–Fletcher–Goldfarb–Shannon (BFGS) method was applied to relax the whole structure based on total energy minimization. The total energy changes during the optimization processes were finally converged to 1 × 10⁻⁶ eV and the forces per atom were reduced to 0.05 eV Å−1.
 |
| Fig. 1 Cut-off energy testing. | |
By using the stress–strain method according to the generalized Hooke’s law, the elastic constants of the FexPy compounds were calculated. Several different strain modes were imposed on the crystal structure, and then the Cauchy stress tensor for each strain mode was estimated. Finally, the related elastic constants were identified as the coefficients in the strain–stress relations as shown in eqn (1):9
|  | (1) |
here,
cij is the elastic constant, and
τi and
σj are the shear stress and normal stress, respectively. The total number of independent elastic constants is determined by the symmetry of the crystal. For high symmetry point groups, the required different strain patterns for the
cij calculations can be greatly reduced.
9
The cohesive energy and formation enthalpy were calculated to estimate the chemical stability of the FexPy compounds. These two energy parameters are defined in eqn (2) and (3):10
|  | (2) |
|  | (3) |
where
Ecoh(Fe
xP
y) and Δ
rH(Fe
xP
y) are the cohesive energy and formation enthalpy of Fe
xP
y per atom, respectively.
Etot(Fe
xP
y) is the total energy of the Fe
xP
y phase,
Eiso is the total energy of a single Fe or P atom and
Ebin refers to the cohesive energy of the Fe or P crystal.
10
3. Results and discussion
3.1 Stability
Fig. 2 shows the Fe–P equilibrium phase diagram1 and the five FexPy binary phases are Fe3P, Fe2P, FeP, FeP2, and FeP4. With the increase of phosphorus content, the melting points of the Fe–P compounds increased. FeP4 has the highest melting point, at 1700 °C, among the Fe–P compounds. The melting point of Fe3P is the lowest which may be ascribed to the weak covalent bonding between the Fe and P atoms. In fact, one example of this is Fe3P as a common phase in the grain-boundary segregation in some types of steel materials.
 |
| Fig. 2 The Fe–P equilibrium phase diagram. | |
Fig. 3 shows the crystal structures of the Fe–P compounds. The FexPy binary compounds contain four different types of crystal system, including tetragonal (Fe3P), hexagonal (Fe2P), orthorhombic (o-FeP-1, o-FeP-2, FeP2, o-FeP4), and monoclinic (m-FeP4-1, m-FeP4-2). The calculated lattice parameters of Fe, P and the Fe–P compounds have been optimized, and are listed in Table 1. By comparing these results, it can be seen that the calculated lattice parameters of the o-FeP-2 compound are in good agreement with other calculated results and experimental values.11–20 The average deviation of our results to the experimental data for lattice parameters is less than 5.6%, which can be attributed to the approximation method in the work and thermodynamic effects on the crystal structures.
 |
| Fig. 3 The crystal structure of the Fe–P compounds. The blue balls represent Fe atoms and the purple balls refer to P atoms. | |
Table 1 The space group, calculated lattice parameters, Vcell, cohesive energy (kJ mol−1), formation enthalpy ΔrH (kJ mol−1) and the calculated spin-polarized formation enthalpy ΔrH* (kJ mol−1) data for the Fe–P binary compounds
Substances |
Space group |
Composition at % P |
a (Å) |
b (Å) |
c (Å) |
V
cell (Å3) |
E
coh
|
ΔrH |
ΔrH* |
Cal. in ref. 11.
Exp. in ref. 12.
Exp. in ref. 13.
Cal. in ref. 4.
Exp. in ref. 14.
Exp. in ref. 15.
Exp. in ref. 16.
Exp. in ref. 17.
Exp. in ref. 18.
Exp. in ref. 19.
Cal. in ref. 20.
|
Fe |
Im m |
0 |
3.402, 3.430a |
3.402, 3.430a |
3.402, 3.430a |
39.369, 40.350a |
−898.415 |
0 |
0 |
Fe3P |
I![[4 with combining macron]](https://www.rsc.org/images/entities/char_0034_0304.gif) |
25.000 |
8.598, 9.107b |
8.598, 9.107b |
4.277, 4.460b |
316.109, 369.900b |
−848.235 |
−67.068 |
−44.950 |
Fe2P |
P 2m |
33.333 |
5.531, 5.690c, 5.704d |
3.399, 3.458c, 3.431d |
90.062, 96.960c |
−834.725 |
−81.957 |
−61.510 |
o-FeP-1 |
Pna21 |
50.000 |
5.055, 5.193e |
5.680, 5.792e |
2.931, 3.099e |
84.146, 93.210e |
−791.300 |
−95.236 |
−78.580 |
o-FeP-2 |
Pnma
|
50.000 |
5.053, 5.191f |
2.932, 3.099f |
5.680, 5.792f |
84.152, 93.180f |
−791.300 |
−95.255 |
−78.590 |
FeP2 |
Pnnm
|
66.700 |
4.883, 4.973g |
5.536, 5.657g |
2.647, 2.723g |
71.560, 76.600g |
−720.855 |
−80.674 |
−69.200 |
m-FeP4-1 |
C12/c1 |
80.000 |
4.968, 5.054h |
10.261, 10.407h |
10.939, 11.069h |
557.632, 582.120h |
−651.375 |
−56.443 |
−49.553 |
o-FeP4 |
C2221 |
80.000 |
4.923, 5.005i |
10.077, 10.213i |
5.434, 5.530i |
269.551, 282.670i |
−649.445 |
−55.275 |
−48.395 |
m-FeP4-2 |
P121/c1 |
80.000 |
4.540, 4.619j |
13.444, 13.670j |
6.914, 7.002j |
413.839, 433.270j |
−650.410 |
−56.260 |
−49.370 |
P |
Cmca
|
100.000 |
3.289, 3.241k |
10.832, 10.192k |
4.390, 4.239k |
156.408, 140.000k |
−526.890 |
0 |
0 |
The cohesive energy and formation enthalpy are used to evaluate the stability of the Fe–P binary compounds. As defined in eqn (2) and (3), the lower the values for these two thermodynamic parameters, the more stable the compound. The cohesive energy mainly reflects the stability of the combination of two atoms, while the formation enthalpy mainly reflects the stability of the formation of compounds. As shown in Table 1, the calculated cohesive energy and formation enthalpy values of the studied Fe–P binary compounds are negative, which shows that the Fe–P compounds are thermodynamically stable. The formation enthalpy values without spin-polarization of the Fe–P compounds are −67.068, −81.957, −78.580, −78.590, −69.200, −49.553, −48.395 and −49.370 kJ mol−1, and the calculated spin-polarized formation enthalpy values of the Fe–P compounds are −44.950, −61.510, −78.580, −78.590, −69.200, −49.553, −48.395 and −49.370 kJ mol−1 for the Fe3P, Fe2P, o-FeP-1, o-FeP-2, FeP2, m-FeP4-1, o-FeP4, and m-FeP4-2 phases, respectively. Fig. 4 shows the formation enthalpy (ΔH) and the calculated spin-polarized formation enthalpy (ΔH*) curves as a function of the P atom content for the Fe–P binary compounds. Obviously, with the increase of phosphorus content, the formation enthalpy of the FexPy compounds decreases at first and then increases. Which may be due to the proportion of anti-bonding states decreasing at first and then increasing. For the ΔH, among all the Fe–P binary compounds, o-FeP4 has the largest formation enthalpy value at −55.275 kJ mol−1, and o-FeP-2 has the smallest formation enthalpy value at −95.255 kJ mol−1. The stability sequence of the eight Fe–P phases forms the following order: o-FeP-2 > o-FeP-1 > Fe2P > FeP2 > Fe3P > m-FeP4-1 > m-FeP4-2 > o-FeP4. For the ΔH*, Fe3P has the largest formation enthalpy value at −44.950 kJ mol−1, and o-FeP-2 has the smallest formation enthalpy value at −78.590 kJ mol−1. The stability sequence of these Fe–P phases forms the following order: o-FeP-2 > o-FeP-1 > FeP2 > Fe2P > m-FeP4-1 > m-FeP4-2 > o-FeP4 > Fe3P. The spin-polarization increased the formation enthalpy of the FexPy compounds, but the effect on the formation enthalpy was weakened with an increased phosphorus content. The stability sequence of the compounds changes with and without the spin-polarization. From the results of the stability sequence it can be seen that the stability of Fe3P and Fe2P is reduced with the spin-polarization, which may be due to the magnetic characters of Fe3P and Fe2P. According to the density of states, we know that Fe3P and Fe2P have magnetic characters. In general, o-FeP-2 is the most stable compound among the Fe–P compounds.
 |
| Fig. 4 The formation enthalpy (ΔH) and the spin-polarized formation enthalpy (ΔH*) of the Fe–P binary compounds. | |
3.2 Elastic constants and polycrystalline moduli
The calculated elastic constants of the α-Fe, phosphorus and Fe–P compounds are listed in Table 2. The elastic stability conditions in various crystal systems can be expressed by the following equations (eqn (4–6)):21,22
(1) Orthorhombic (for o-FeP-1, o-FeP-2, FeP2 and o-FeP4):
| c11 > 0, c11c22 > c122, c11c22c33 + 2c12c13c23 − c11c232 − c22c132 − c33c122 > 0, c44 > 0, c55 > 0, c66 > 0. | (4) |
(2) Tetragonal (for Fe3P) and hexagonal (for Fe2P):
| c11 > |c12|, 2c132 < c33(c11 + c12), c44 > 0, 2c162 < c66(c11 − c12). | (5) |
(3) Monoclinic (for m-FeP4-1 and m-FeP4-2):
| c11 + c22 + c33 + 2(c12 + c13 + c23) > 0, c33c55 − c352 > 0, c44c66 − c462 > 0, c22 + c33 − 2c23 > 0, c22(c33c55 − c352) + 2c23c25c35 − c232c55 − c252c33 > 0, 2[c15c25(c33c12 − c13c23) + c15c35(c22c13 − c12c23) + c25c35(c11c23 − c12c13)] − [c152(c22c33 − c232) + c252(c11c33 − c132) + c352(c11c22 − c122)] + c55g > 0 (g = c11c22c33 − c11c232 − c22c132 − c33c122 + 2c12c13c23) > 0, cii > 0(i = 1–6). | (6) |
Table 2 Single crystalline elastic constants (cij, in GPa) of the Fe–P binary compounds
Substances |
Fe |
Fe3P |
Fe2P |
o-FeP-1 |
o-FeP-2 |
FeP2 |
m-FeP4-1 |
o-FeP4 |
m-FeP4-2 |
P |
Cal. in ref. 7.
Cal. in ref. 23.
Cal. in ref. 4.
|
c
11
|
266.4a, 279.2b |
418.2 |
460.3 |
502.5 |
506.4 |
570.0 |
335.9 |
367.5 |
279.9 |
188.4 |
c
22
|
|
418.2 |
460.3 |
476.4 |
280.1 |
685.5 |
325.2 |
310.8 |
285.6 |
42.9 |
c
33
|
|
513.5 |
474.7 |
277.4 |
529.9 |
382.4 |
344.2 |
374.3 |
285.5 |
39.3 |
c
44
|
96.3a, 93.0b |
98.1 |
183.9 |
176.5 |
171.3 |
105.9 |
91.6 |
76.7 |
147.5 |
19.9 |
c
55
|
|
98.1 |
183.9 |
177.1 |
170.0 |
228.4 |
109.3 |
121.1 |
136.8 |
55.0 |
c
66
|
|
136.6 |
88.9 |
165.6 |
176.6 |
227.1 |
188.3 |
189.2 |
160.0 |
31.9 |
c
12
|
146.5a, 148.8b |
348.4 |
282.4 |
136.9 |
147.6 |
239.0 |
99.5 |
104.0 |
90.4 |
−1.2 |
c
13
|
|
230.6 |
195.7, 172.0c |
144.5 |
166.7 |
180.5 |
41.1 |
44.0 |
73.2 |
36.0 |
c
15
|
|
|
|
|
|
|
−7.3 |
|
16.6 |
|
c
23
|
|
230.6 |
195.7 |
183.8 |
210.0 |
97.2 |
44.1 |
20.9 |
75.7 |
2.5 |
c
25
|
|
|
|
|
|
|
18.5 |
|
21.8 |
|
c
35
|
|
|
|
|
|
|
−15.9 |
|
−26.5 |
|
c
46
|
|
|
|
|
|
|
17.7 |
|
26.1 |
|
As shown in Table 2, the calculated elastic constants of each Fe–P compound satisfy the above criteria, which indicates that all of the Fe–P compounds are mechanically stable. The calculated c11 and c22 values of FeP2 are larger than the other elastic constants which indicates that FeP2 is highly incompressible under uniaxial stress along the crystallographic a (ε11) and b (ε22) axes. o-FeP-2 has the largest c33 value, which shows that o-FeP-2 is very incompressible under uniaxial stress along the crystallographic c (ε33) axis. The largest elastic constant value is c22 for FeP2 with 685.5 GPa. For the two FeP polymorphs, the c22 value of o-FeP-1 is close to the c33 value of o-FeP-2 and the c33 value of o-FeP-1 is close to the c22 value of o-FeP-2, which indicates that in terms of the incompressible performance the b (ε22) axis of o-FeP-1 is similar to the c (ε33) axis of o-FeP-2, and the c (ε33) axis of o-FeP-1 is similar to the b (ε22) axis of o-FeP-1. c44, c55 and c66 represent the shear modulus on the (100), (010) and (001) crystal planes. From Table 2, one can see that Fe2P has the largest c44 value and o-FeP4 has the smallest c44 value for all the Fe–P binary compounds. For the three FeP4 polymorphs, m-FeP4-2 has the largest c44 value at 147.5 GPa.
The bulk modulus (B), shear modulus (G), Young’s modulus (E) and Poisson’s ratio (σ) of polycrystalline crystals are estimated with independent single crystal elastic constants according to the Viogt–Reuss–Hill (VGH) approximation.24 The Voigt method is based on the assumption of uniform strain throughout a polycrystal, which is given by:
| 9BV = (c11 + c22 + c33) + 2(c12 + c13 + c23) | (7) |
| 15GV = (c11 + c22 + c33) − (c12 + c13 + c23) + 3(c44 + c55 + c66) | (8) |
The Reuss method assumes a uniform stress and gives
B and
G as functions of the elastic compliance constants
sij, which are given by the inverse matrix of
cij.
| 1/BR = (S11 + S22 + S33) + 2(S12 + S13 + S23) | (9) |
| 1/GR = 4[(S11 + S22 + S33) − (S12 + S13 + S23)]/15 + (s44 + s55 + s66)/5 | (10) |
The Voigt–Ruess–Hill (VRH) approximation is considered as a good estimation method for the elastic modulus of polycrystalline materials.
The Young’s modulus (
E) and Poisson’s ratio (
σ) can be calculated as follows:
25,26 | σ = (3B − 2G)/(6B + 2G) | (14) |
The calculated bulk modulus (B), shear modulus (G), Young’s modulus (E) and Poisson’s ratio (σ) of these Fe–P binary compounds are shown in Table 3. The bulk modulus reveals the compressibility of the solid under hydrostatic pressure and the values are 315.8, 304.1, 235.5, 250.7, 284.2, 152.5, 153.6 and 147.7 GPa for Fe3P, Fe2P, o-FeP-1, o-FeP-2, FeP2, m-FeP4-1, o-FeP4 and m-FeP4-2, respectively. The bulk modulus values of Fe3P and Fe2P are higher than those of other carbides, such as Fe3C (255 GPa),28 TiC (242 GPa)29 and Cr3C (287.5 GPa),30 but lower than those of h-WC (393.0 GPa)31 and diamond (436.8 GPa).32 Fe3P has the largest value of bulk modulus among the Fe–P binary compounds, which may be owed to the fact that it has the strongest ionic bond between the Fe and P atoms. Because the ionic bonds have no direction. The calculated values of the shear modulus are 84.0, 132.2, 148.7, 148.0, 176.8, 127.0, 129.4 and 125.4 GPa for Fe3P, Fe2P, o-FeP-1, o-FeP-2, FeP2, m-FeP4-1, o-FeP4 and m-FeP4-2, respectively. The largest value of shear modulus belongs to FeP2, and the largest value of Young’s modulus is attributed to FeP2. In addition, Fe3P with the lowest P atom content has the largest bulk modulus at 315.8 GPa and the smallest shear modulus at 84.0 GPa. This result can be explained by the strong ionic bonding and weak covalent bonding of Fe3P, because the ionic bonds have no direction, but the covalent bonds have directionality.
Fig. 5 presents the bulk modulus, shear modulus and Young’s modulus curves as a function of the P atom content for the Fe–P systems. With an increase in phosphorus content, the three moduli of the Fe–P compounds first increase and then decrease. The ratio of B/G (here BH and GH are used) can be used to indicate the ductile or brittle nature of the compounds, a high value is associated with ductility and a low value is associated with brittleness, the critical value is about 1.75. Fig. 6 shows the B/G and Poisson’s ratio curves as a function of the P atom content for the Fe–P systems. When comparing the B/G values, it’s clearly implied that Fe3P and Fe2P are considered to be ductile compounds since the values of B/G are larger than 1.75, m-FeP4-2 has the smallest value at 1.18, indicating that it’s the most brittle. The results are in good agreement with the analysis of the density of states. Meanwhile, a Poisson’s ratio of larger or smaller than 0.25 can also be used to indicate the ductile or brittle nature of the compounds. From Fig. 6, we know that Fe3P and Fe2P can be classified as ductile, which may be owed to their strong metallic bonding. While the three FeP4 compounds, two FeP compounds and FeP2 should be classified as brittle, since their values of B/G are smaller than 1.75 and their values of the Poisson’s ratio are smaller than 0.25. This may be owed to their strong covalent bonding.
 |
| Fig. 5 Polycrystalline elastic moduli of the Fe–P binary compounds. | |
 |
| Fig. 6 The B/G and σ values of the Fe–P binary compounds. | |
The hardness (Hv) is very important in the applications of Fe–P binary compounds. In the present paper, the hardness of the two FeP compounds was estimated by a relative semi-empirical equation (eqn (15)).33,44 The equation is defined as follows:
|  | (15) |
where
Hv denotes the hardness,
A is a proportional coefficient and
α is a constant.
A = 14 and
α = −1.191.
ni is the number of
i atoms in the cell,
Zi is the valence electron number of the
i atoms,
v is the cell volume,
xA is the electronegativity of atom A and
d is the bond length in angstroms. The calculated hardness of the FeP compounds is shown in
Table 3.
Table 3 Polycrystalline elastic properties of Fe–P binary compounds, including the bulk modulus (B), shear modulus (G), Young’s modulus (E), Poisson’s ratio (σ) and Vickers hardness (Hv)
Substances |
Fe |
Fe3P |
Fe2P |
o-FeP-1 |
o-FeP-2 |
FeP2 |
m-FeP4-1 |
o-FeP4 |
m-FeP4-2 |
P |
Cal. in ref. 7.
Cal. in ref. 4.
Cal. in ref. 27.
|
B
V (GPa) |
186.5a |
315.8 |
304.8 |
243.0 |
262.8 |
296.8 |
152.7 |
154.5 |
147.7 |
38.4 |
B
R (GPa) |
186.5a |
315.7 |
303.5 |
228.1 |
238.7 |
271.7 |
152.3 |
152.7 |
147.6 |
21.7 |
B
H (GPa) |
186.5a |
315.8 |
304.1 |
235.5 |
250.7 |
284.2 |
152.5 |
153.6 |
147.7 |
30.0 |
G
V (GPa) |
81.7a |
102.6 |
139.5 |
156.6 |
156.4 |
187.0 |
132.6 |
136.3 |
129.6 |
36.9 |
G
R (GPa) |
77.5a |
65.4 |
125.0 |
140.9 |
139.6 |
166.5 |
121.7 |
122.5 |
121.2 |
26.2 |
G
H (GPa) |
79.6a |
84.0 |
132.2 |
148.7 |
148.0 |
176.8 |
127.0 |
129.4 |
125.4 |
31.5 |
E
H (GPa) |
209.1a |
231.5 |
346.4 |
368.5 |
371.0 |
439.3 |
298.2 |
303.1 |
293.2 |
70.0 |
B
H/GH |
2.34a |
3.76 |
2.30, 2.18b |
1.58 |
1.69 |
1.61 |
1.20 |
1.19 |
1.18 |
0.95 |
σ
|
0.31a, 0.29c |
0.38 |
0.31, 0.30b |
0.24 |
0.25 |
0.24 |
0.17 |
0.17 |
0.17 |
0.11 |
H
V (GPa) |
35.82 |
|
|
33.39 |
33.39 |
|
|
|
|
19.23 |
3.3 Anisotropy of elastic properties
The mechanical anisotropy is important in the applications of Fe–P materials. The fracturing cracks of materials form not only in the substrate, but also in the inclusion. The formation and propagation of micro cracks is often related to the elastic anisotropy. Knowing the anisotropy of FexPy compounds would be helpful in designing and enhancing some special device. To describe the degrees of anisotropy of Fe–P binary compounds, a numbers of indexes, including the shear anisotropic factors (A1, A2 and A3), the percentages of anisotropy under compression and shear stress (AB and AG) and the universal elastic anisotropy (AU), were calculated using the following equations.34–36 |  | (16) |
|  | (17) |
|  | (18) |
|  | (19) |
|  | (20) |
|  | (21) |
where BV, BR, GV and GR are the bulk and shear moduli calculated with the Voigt and Reuss methods, respectively. The calculated results are shown in Table 4. For A1, A2 and A3, a value of unity implies isotropy and a non-unity value implies anisotropy for a crystal. For isotropic structures, the values of AB, AG and AU are zero. Meanwhile the large discrepancies from zero indicate highly mechanical anisotropic properties.
Table 4 Anisotropic factors of the Fe–P binary compounds
Substances |
A
1
|
A
2
|
A
3
|
A
B
(%) |
A
G
(%) |
A
U
|
Fe |
2.71 |
2.71 |
2.71 |
0 |
11.45 |
1.29 |
Fe3P |
0.83 |
0.83 |
3.91 |
0.03 |
22.43 |
2.89 |
Fe2P |
1.35 |
1.35 |
1.00 |
0.21 |
5.48 |
0.58 |
o-FeP-1 |
1.44 |
1.83 |
0.94 |
3.16 |
5.28 |
0.62 |
o-FeP-2 |
0.97 |
1.74 |
1.44 |
4.80 |
5.68 |
0.70 |
FeP2 |
0.72 |
1.05 |
1.17 |
4.42 |
5.80 |
0.71 |
m-FeP4-1 |
0.61 |
0.75 |
1.63 |
0.13 |
4.29 |
0.45 |
o-FeP4 |
0.47 |
1.18 |
1.61 |
0.56 |
5.33 |
0.58 |
m-FeP4-2 |
1.41 |
1.30 |
1.66 |
0.03 |
3.35 |
0.35 |
P |
0.51 |
2.85 |
0.55 |
27.79 |
16.96 |
2.81 |
From Table 4, it can be seen that Fe is isotropic, Fe2P and m-FeP4-2 have strong isotropy, and Fe3P has the strongest anisotropy especially in the (001) plane. Fe3P has the largest value of AG at 22.43% among all the Fe–P binary compounds, implying that the anisotropy in the shear modulus for Fe3P is the strongest. However, the A1, A2, A3, AB and AG values can’t fully describe the elastic anisotropy. The A1, A2 and A3 values describe the anisotropy of the shear modulus in the different crystal planes, and the index AU is considered as an appropriate parameter to describe the degrees of elastic anisotropy of the compound. From Table 4, Fe3P has the strongest anisotropy of the Fe–P binary compounds, since the value of AU is 2.89, and m-FeP4-2 has the strongest isotropy among the FexPy compounds, since the value of AU is 0.35.
The most straightforward way to illustrate the elastic anisotropy is to plot the Young’s modulus and shear modulus in three dimensions (3D) as a function of the crystallographic direction. The directional dependence of Young’s modulus and the shear modulus is given by eqn (22–25):10,34,37,38,42,43
Hexagonal crystal (for Fe2P)
|  | (22) |
Orthorhombic crystal (for o-FeP-1, o-FeP-2, FeP2 and o-FeP4)
|  | (23) |
Monoclinic crystal (for m-FeP4-1 and m-FeP4-2)
|  | (24) |
Tetragonal (for Fe3P)
|  | (25) |
where the
sij values are the elastic compliance constants, and
l1,
l2 and
l3 are the directional cosines. The surface contours of the Young’s modulus and shear modulus of the Fe–P binary compounds are illustrated in
Fig. 7 and
Fig. 9. For an isotropic system, the graph would be a sphere. Obviously, Fe
3P, Fe
2P, FeP
2, m-FeP
4-1 and o-FeP
4 show a strong anisotropic character in the Young’s modulus, and Fe
3P, the two FeP compounds, FeP
2 and o-FeP
4 show a strong anisotropic character in the shear modulus. The surface contours of the two FeP compounds and m-FeP
4-2 in
Fig. 7 are similar to a cylinder, which means that the Young’s modulus of these compounds have weaker anisotropy than the other compounds. Projections of the Young’s modulus on the (100), (001) and (110) planes show more details about the anisotropic properties of the Young’s modulus as shown in
Fig. 8. Obviously, the Young’s modulus has a strong directional dependence on these planes. From
Fig. 8, we can see that FeP
2 shows the maximum Young’s modulus along the [010] and [110] directions, and that Fe
3P shows the minimum Young’s modulus along the [010] direction on the (100) and (001) planes. For Fe
2P, the planar contours on the (001) plane is similar to an ellipse, which means that the Young’s modulus of Fe
2P on the (001) plane has weaker anisotropy than the other compounds.
 |
| Fig. 7 Contour plots of the Young’s modulus of the Fe–P compounds in 3-D space. | |
 |
| Fig. 8 Planar projections of the Young’s modulus of the Fe–P compounds on the (100), (001) and (110) crystallographic planes. | |
 |
| Fig. 9 Contour plots of the shear modulus (GPa) of the Fe–P compounds in 3-D space. | |
3.4 Electronic structures
The electronic structures and chemical bonding characteristics of the FexPy compounds are indicated by the electron density distribution map, total density of states (TDOS) and partial density of states (PDOS).
The calculated total electron density distribution maps of the Fe–P compounds are shown in Fig. 10. The electron density is mainly concentrated on the iron atoms. For o-FeP-1, o-FeP-2, Fe2P and Fe3P, the electron density values are larger than zero even in the interstitial regions, which indicates the metallic nature of these compounds. The elongated contours along the Fe–P bond axes show the covalent interactions. m-FeP4-1 has the strongest covalent bonding between the P atoms.
 |
| Fig. 10 Total electron density distribution through (−0.563, 0.318, 0.763), (0.561, −0.764, −0.318), (−0.021, −0.020, 0.999), (−0.039, −0.355, −0.934), (1, 0, 0), (0, 0, 1) and (−0.012, −0.012, 0.999) slices intersecting both the Fe and P atoms for the (a) o-FeP-1, (b) o-FeP-2, (c) FeP2, (d) o-FeP4, (e) m-FeP4-1, (f) Fe2P and (g) Fe3P compounds, respectively. | |
The TDOS and PDOS of the FexPy compounds are shown in Fig. 11. The nature of the magnetic characters can be understood from the spin-polarized total density of states. Comparing the up with the down densities, it can be seen that the up and down states are not symmetric for Fe3P and Fe2P, which indicates that they have magnetic characters. Actually, the low and high valence bands are almost symmetric, and it is near to the Fermi level that the up and down states are dissymmetric. While for other compounds, the up and down states are symmetric, so they have no magnetic character. No energy gap near to the Fermi level can be seen for Fe3P, Fe2P, o-FeP-1 and o-FeP-2, which indicates metallicity and electronic conductivity for these binary compounds. Based on the analysis of the band structure, the energy gaps near to the Fermi level for FeP2, o-FeP4, m-FeP4-1 and m-FeP4-2 are 0.573, 0.903, 0.924 and 1.16 eV, respectively. So these four compounds are considered to be semiconductors, and the electroconductibility of m-FeP4-2 is the worst. The other compounds are conductors. We can see that the TDOS values at the Fermi level increases as the Fe atom content increases. Fe3P has the strongest metallicity, which is consistent with the values of the B/G and Poisson’s ratio (σ). The Fe-d bands of m-FeP4-1 have a peak which shows that the electrons of the d bands have relatively local state density. From Fig. 11, it can be seen that the ground state properties of the Fe–P binary compounds are determined by the 3d bands of Fe. At the low energy part, the band from −9 eV to −5 eV is mainly due to the 3p bands of P. The Fe-d bands are overlapped with the P-p bands in the energy range from −4 eV to 3 eV for the three FeP4 compounds, which indicates covalent interactions because of the strong hybridization between the Fe-d bands and the P-p bands. It’s similar to the energy range from −2 eV to 3 eV of FeP2. The Fe-d bands are hybridized weakly with the P-p bands in the energy range from −5 eV to −2 eV for o-FeP-1 and o-FeP-2. We can see that the FeP4 compounds have the strongest covalent interactions among all the FexPy compounds from Fig. 11, which lends to the higher melting points. This result is consistent with the Fe–P equilibrium phase diagram. The valence electrons of the Fe and P atoms considered are 3p63d64s2 and 3s23p3. For Fe3P, the position of the Fe-d bands does not coincide with the P-p bands, which shows an interaction between the electrons of the P and Fe atoms. The Fe 3d orbitals lose an electron and form the partially filled state, the P 3p orbitals get three electrons and form the entirely filled state. In addition, the partially filled and the entirely filled states are stable states. The electron transfer path implies ionic interaction in the Fe3P compound. In other words, with the increase of phosphorus content, the covalent interactions of the Fe–P binary compounds strengthen, and the ionic interactions and the metallicity weaken.
 |
| Fig. 11 The total density of states (TDOS) and partial density of states (PDOS) for the FexPy compounds, dashed lines represent the Fermi level. | |
According to the above discussion, Fe3P and Fe2P have magnetic characters. m-FeP4-2 is considered to be a semiconductor. The bonding behaviors of the Fe–P binary compounds are combinations of metallic, covalent and ionic bonds. For Fe3P and Fe2P, the chemical bonding is dominated by the Fe–P ionic bonds. The chemical bonding of o-FeP-1, o-FeP-2, FeP2, m-FeP4-1, o-FeP4 and m-FeP4-2 is dominated by the Fe–P covalent bonds but also possesses ionic and metallic bond character, which may lead to the high melting points.
3.5 Debye temperature
It is certain that the sound velocity and Debye temperature can be used to evaluate the chemical bonding characteristics and thermal properties of compounds. The sound velocity and Debye temperature at low-temperature are calculated with the previously obtained bulk modulus (B) and shear modulus (G) values. The Debye temperature can be calculated by the following equation:39,9 |  | (26) |
where, ΘD represents the Debye temperature; h and kB are the Planck and Boltzmann constants, respectively; n is the total number of atoms per formula; NA is the Avogadro constant; M is the molecular weight per formula; ρ is the theoretical density, and the vm is the average sound velocity defined as: |  | (27) |
|  | (28) |
|  | (29) |
where, vs is the transverse sound velocity and vl is the longitudinal sound velocity; B and G are the isothermal bulk modulus and shear modulus values.22,40,41.
The values of the Debye temperature and sound velocities of the Fe–P binary compounds are listed in Table 5. The Debye temperature reflects the strength of the chemical bonding in a crystal structure. From Table 5, we can see that the Debye temperature increases as the P atom content increases in the Fe–P binary compounds except for FeP2. Moreover, Fe3P has the lowest Debye temperature and the highest B/G ratio, which indicates the strongest metallic character. This is consistent with the previous calculations on the density of states. Besides, the average sound velocities of these FexPy compounds are relatively large at about 5500 m s−1 except for Fe3P. A reasonable explanation is that these compounds have high bulk and shear modulus values, and a low density, and that the vl and vs values are correlated to the bulk modulus, shear modulus and density.
Table 5 The theoretical density (ρ, g cm−3), longitudinal sound velocity (vl, m s−1), transverse sound velocity (vs, m s−1), average sound velocity (vm, m s−1) and Debye temperature (ΘD, K)
Species |
ρ
|
v
l
|
v
s
|
v
m
|
Θ
D
|
Fe3P |
8.343 |
7160.8 |
3173.1 |
3581.1 |
497.1 |
Fe2P |
5.665 |
9208.4 |
4830.8 |
5402.9 |
668.6 |
o-FeP-1 |
6.853 |
7955.9 |
4658.2 |
5165.0 |
702.1 |
o-FeP-2 |
6.853 |
8085.6 |
4647.2 |
5161.3 |
701.6 |
FeP2 |
5.467 |
9752.1 |
5686.8 |
6307.8 |
822.4 |
m-FeP4-1 |
4.282 |
8669.5 |
5446.0 |
5996.0 |
742.2 |
o-FeP4 |
4.430 |
8580.2 |
5404.6 |
5948.6 |
744.7 |
m-FeP4-2 |
4.327 |
8530.9 |
5383.4 |
5924.1 |
735.9 |
4. Conclusions
In general, we have investigated the stability, mechanical properties and electronic structures of all the Fe–P binary compounds with first-principles calculations. The cohesive energy and formation enthalpy indicate that they are thermodynamically stable. The elastic constants of the FexPy compounds satisfy the mechanical stability criteria. Fe3P has the largest bulk modulus at 315.8 GPa and the smallest shear modulus at 84.0 GPa. FeP2 exhibits the largest shear and Young’s moduli at 176.8 and 439.3 GPa, respectively. The hardness of the two FeP compounds is 33.39 GPa. Fe3P and Fe2P are considered to be ductile compounds, which may be owed to their strong metallic bonding. The 3D surface contour maps of the Young’s modulus and shear modulus were plotted to verify the mechanical anisotropy of the Fe–P binary compounds, Fe3P has the strongest anisotropy among the FexPy compounds. The bonding behaviors of the Fe–P binary compounds are combinations of metallic, covalent and ionic bonds. Fe3P and FeP2 have the smallest and largest Debye temperatures at 497.1 K and 822.4 K, respectively.
Acknowledgements
This work was supported by the National Natural Science Foundation of China (No. 51171074 and 51261013).
References
- H. Ohtani, N. Hanaya, M. Hasebe, S. Teraoka and M. Abe, CALPHAD: Comput. Coupling Phase Diagrams Thermochem., 2006, 30, 147–158 CrossRef CAS PubMed
.
- W. Zhou, L.-J. Liu, B.-L. Li, P. Wu and Q.-G. Song, Comput. Mater. Sci., 2009, 46, 921–931 CrossRef CAS PubMed
.
- P. Hohenberg and W. Kohn, Phys. Rev. B: Condens. Matter Mater. Phys., 1964, 136, 864 Search PubMed
.
- J.-Y. Li, H.-M. Chen, Q.-Z. Gao, Q.-L. Xie and J.-L. Huang, J. Guangxi Univ., Nat. Sci. Ed., 2009, 34, 565–570 CAS
.
- L. Chen, N. Kurita, T. Fujiwara, M. Abliz, M. Hedo, I. Oguro, A. Matsuo, K. Kindo, Uwatoko and H. Fujii, J. Magn. Magn. Mater., 2007, 310, 219–221 CrossRef PubMed
.
- J. Tobola, M. Bacmann, D. Fruchart, S. Kaprzyk, A. Koumina, S. Niziol, J. L. Soubeyroux, P. Wolfers and R. Zach, J. Magn. Magn. Mater., 1996, 157–158, 708–710 CrossRef
.
- H.-L. Liu, W.-L. Wang, L. Hu and B.-B. Wei, Intermetallics, 2014, 46, 211–221 CrossRef PubMed
.
- J. P. Perdew, K. Burke and M. Ernzerhof, Phys. Rev. Lett., 1996, 77, 3865 CrossRef CAS
.
- J. Feng, B. Xiao, J. Chen, Y. Du, J. Yu and R. Zhou, Mater. Des., 2011, 32, 3231–3239 CrossRef CAS PubMed
.
- X.-Y. Chong, Y.-H. Jiang, R. Zhou and J. Feng, J. Alloys Compd., 2014, 610, 684–694 CrossRef CAS PubMed
.
- J. Haglund, A. Fernandez Guillermet, G. Grimvall and M. Korling, Phys. Rev. B, 1993, 48, 11685–11691 CrossRef
.
- S. Rundqvist, Acta Chem. Scand., 1962, 16, 1–19 CrossRef CAS
.
- A. Koumina, M. Bacmann, D. Fruchart, J. L. Soubeyroux, P. Wolfers, J. Tobola, S. Kaprzyk, S. Niziol, M. Mesnaoui and R. Zach, Annales de Chimie Science des Materiaux, 1998, 23, 177–180 CrossRef CAS
.
- K. Selte and A. Kjekshus, Acta Chem. Scand., 1972, 26, 1276–1277 CrossRef CAS
.
- S. Rundqvist and P. C. Nawapong, Acta Chem. Scand., 1965, 19, 1006–1008 CrossRef CAS
.
- E. Dahl, Acta Chem. Scand., 1969, 23, 2677–2684 CrossRef CAS
.
- M. Evain, R. Brec, S. Fiechter and H. Tributsch, J. Solid State Chem., 1987, 71, 40–46 CrossRef CAS
.
- M. Sugitani, N. Kinomura, M. Koizumi and S. Kume, J. Solid State Chem., 1978, 26, 195–201 CrossRef CAS
.
- W. Jeitschko and D. J. Braun, Acta Crystallogr., Sect. B, 1978, 34, 3196–3201 CrossRef
.
- R. Ahuja, Phys. Status Solidi B, 2003, 235, 282–287 CrossRef CAS PubMed
.
-
F. Mouhat, F. X. Coudert, B. Phys Rev, 2014, 90, 224104.
- X.-Y. Chong, Y.-H. Jiang, R. Zhou and J. Feng, Comput. Mater. Sci., 2014, 87, 19–25 CrossRef CAS PubMed
.
- S.-L. Shang, A. Saengdeejing, Z.-G. Mei, D. E. Kim, H. Zhang and S. Ganeshan,
et al.
, Comput. Mater. Sci., 2010, 48, 813–826 CrossRef CAS PubMed
.
- W. Zhou, L. Liu, B. Li, P. Wu and Q. Song, Comput. Mater. Sci., 2009, 46, 921 CrossRef CAS PubMed
.
- R. Hill, Proc. Phys. Soc., London, Sect. A, 1952, 65, 349–354 CrossRef
.
- B. Xiao, J. Feng, C. T. Zhou, Y. H. Jiang and R. Zhou, J. Appl. Phys., 2011, 109, 023507–023509 CrossRef PubMed
.
- T. Frechen and G. Dietz, J. Phys. F: Met. Phys., 1984, 14, 1811–1826 CrossRef CAS PubMed
.
- C. T. Zhou, B. Xiao, J. Feng, J. D. Xing, X. J. Xie, Y. H. Chen and R. Zhou, Comput. Mater. Sci., 2009, 45, 986 CrossRef CAS PubMed
.
- J. J. Gilman and B. W. Roberts, J. Appl. Phys., 1961, 32, 1405 CrossRef CAS PubMed
.
- Y. F. Li, Y. M. Gao, B. Xiao, T. Min, Y. Yang, S. Q. Ma and D. W. Yi, J. Alloys Compd., 2011, 509, 5242–5249 CrossRef CAS PubMed
.
- Y. F. Li, Y. M. Gao, B. Xiao, T. Min, Z. J. Fan, S. Q. Ma and L. L. Xu, J. Alloys Compd., 2010, 502, 28–37 CrossRef CAS PubMed
.
- Y. C. Liang, W. L. Guo and Z. Fang, Acta Phys. Sin., 2007, 56, 4847 CAS
.
- F. M. Gao, J. L. He, E. D. Wu, S. M. Liu, D. L. Yu, D. C. Li, S. Y. Zhang and Y. J. Tian, Phys. Rev. Lett., 2003, 91, 015502 CrossRef
.
- K. B. Panda and K. S. Ravi Chandran, Acta Mater., 2006, 54, 1641–1657 CrossRef CAS PubMed
.
- X. Q. Chen, H. Y. Niu, D. Z. Li and Y. Y. Li, Intermetallics, 2011, 19, 1275–1281 CrossRef CAS PubMed
.
- N. H. Miao, B. S. Sa, J. Zhou and Z. M. Sun, Comput. Mater. Sci., 2011, 50, 1559–1566 CrossRef CAS PubMed
.
- A. L. Ding, C. M. Li, J. Wang, J. Ao, F. Li and Z. Q. Chen, Chin. Phys. B., 2014, 23, 096201 CrossRef PubMed
.
- J. Feng, B. Xiao, R. Zhou and W. Pan, Acta Mater., 2013, 61, 7364–7383 CrossRef CAS PubMed
.
- J. Feng, B. Xiao, R. Zhou, W. Pan and D. R. Clarke, Acta Mater., 2012, 60, 3380–3392 CrossRef CAS PubMed
.
- Y. Z. Liu, Y. H. Jiang, R. Zhou and J. Feng, J. Alloys Compd., 2014, 582, 500 CrossRef CAS PubMed
.
- J. Feng, B. Xiao, C. L. Wan, Z. X. Qu, Z. C. Huang, J. C. Chen, R. Zhou and W. Pan, Acta Mater., 2011, 59, 1742–1760 CrossRef CAS PubMed
.
- X. Y. Cheng, X. Q. Chen, D. Z. Li and Y. Y. Li, Acta Crystallogr., 2014, 70, 85–103 CAS
.
- Z. Q. Chen, J. Wang and C. M. Li, J. Alloys Compd., 2013, 575, 137–144 CrossRef CAS PubMed
.
- J. C. Phillips, Rev. Mod. Phys., 1970, 42, 320 CrossRef
.
|
This journal is © The Royal Society of Chemistry 2015 |
Click here to see how this site uses Cookies. View our privacy policy here.