DOI:
10.1039/C5RA09667G
(Paper)
RSC Adv., 2015,
5, 75281-75291
Enzymatic delignification: an attempt for lignin degradation from lignocellulosic feedstock
Received
22nd May 2015
, Accepted 19th August 2015
First published on 19th August 2015
Abstract
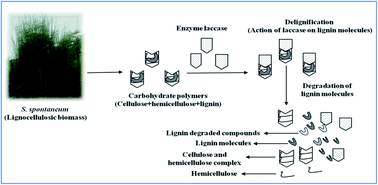
Burgeoning population growth and an increased demand for transportation and industrialization has led to the excessive use of fossil fuels, which in turn leads to higher levels of greenhouse gas emissions and contributes to global warming. At this juncture, biomass-based biofuel production from sustainable resources such as lignocellulosics acts as a better alternative for achieving zero emissions. This in turn necessitates the importance of development of an efficient biomass delignification method, which is an essential prerequisite for the complete biofuel production process. Lignocellulosics such as Saccharum spontaneum contain 17.46% of lignins and 67% of carbohydrates within its cell walls. To make this enormous amount of carbohydrates more accessible for hydrolysis and for further use in fermentation, lignin degradation through laccase has been carried out. In the present study, response surface methodology (RSM) based on central composite design (CCD) has been used to investigate the effects of the various process parameters. The maximum delignification obtained was 84.67% at 6.21 h of incubation time upon monitoring the initial lignin content of 17.46% of the biomass. Thorough study of the biomass was carried out by elemental composition analysis and energy density measurement. Further structural characteristics of the delignified substrate were analyzed by scanning electron microscopy (SEM), Fourier transform infrared (FTIR) spectroscopy and X-ray diffraction (XRD) spectroscopy, which supported the efficacy of the delignification process.
1. Introduction
Ever-increasing energy demand in developed as well as in developing nations has prompted worldwide interest in the production of biomass-based fuels as a substitute to petro-fuels.1,2 These issues made it imperative to find alternatives that would reduce fossil-fuel dependence. In this context, biofuel production from biomass, particularly lignocellulosics, is attracting global attention because of its low-cost, non-competitive and sustainable nature. Lignocellulosic biomass contains 40–60% cellulose, 20–30% hemicellulose and 15–30% lignin.3 In general, lignocellulosics such as grass species represent potential candidates for the bioethanol production because of their high regenerative capacity and reduced land requirement. Saccharum spontaneum (Kans or Sarkanda) is a perennially tall grass that grows up to 4 m in height; moreover, it has deep rhizomes and root system to utilize water efficiently and occupies vast acres of land mass worldwide.4 Its ability to quickly grow and colonize land as well as its high content of cell-wall carbohydrates (67.85%, dry-weight basis) make it a potential candidate for bioethanol production.5–7
Biomass-based biofuel production necessitates the dismantling of plant cell-wall constituents into carbohydrate polymers for subsequent hydrolysis into monomeric sugars. One of the key aspects of biomass heterogeneity towards hydrolysis is associated with the composition and content of lignin molecules, which is a large and complex aromatic structure containing phenylpropanoid subunits linked by carbon–carbon and carbon–oxygen bonds. Lignin is closely interlaced with hemicellulose molecules that form an envelope to wrap the crystalline cellulose microfibrils, which hampers the accessibility of cellulase towards biomass hydrolysis.8–12 Because the breakdown or removal of lignin is essential for accessing the cellulose and hemicellulose components, an appropriate pretreatment process is indispensable. The environment itself is populated by a wide variety of microbes that are capable of degrading or modifying lignin and contributing to plant biomass de-construction.13
Laccase (oxidoreductase, EC 1.10.3.2) is a multicopper phenol oxidase enzyme that oxidizes electron-rich phenolic and non-phenolic substrates.14 Recently, laccases with high redox potential from basidiomycetes were used to remove lignin (with synthetic mediator 1-hydroxybenzotriazole, HBT) from lignocellulosics, such as wood and non-wood biomass15 and ensiled corn stover,16 making cellulose more accessible to hydrolysis.
The selection of appropriate delignification methods has a major impact on the yield of fermentable sugar and eventually on ethanol production from lignocellulosics. For the past two decades, several physical, chemical and physico-chemical pretreatment methods have been attempted for the removal or degradation of lignin.17,18 These modes of pretreatment generally resulted in the formation of products such as furfurals, hydroxymethylfurfurals, acetic acid, formic acid and levulinic acid, which act as inhibitors19 in the subsequent steps of hydrolysis and fermentation.20 Enzymatic delignification is unique in nature in the sense that it selectively targets and cleaves the specific phenolic moieties of the lignin molecule. This results in the formation of various phenolic intermediates that do not interfere with the hydrolysis process but rather act as natural mediators21 by taking part in the oxidation of non-phenolic moieties of lignin molecules.22,23 It also improves the accessibility of hydrolytic enzymes (even at lower concentrations) towards depolymerized lignocellulosics for efficient hydrolysis.24 The overall process of delignification is represented in Fig. 1.
 |
| Fig. 1 Overall delignification process. | |
To date, only a few reports have been cited on enzymatic delignification utilizing various types of lignocellulosics, among which no reports are found on the enzymatic delignification of S. spontaneum. In the present study, the quantity of lignin has been monitored before and after enzymatic pretreatment via various single process parameters. RSM based on a central composite design (CCD) has been used to obtain optimum process conditions for the enzymatic delignification of lignin. Structural, compositional and energy-density measurement was performed, which manifested the establishment of the enzymatic delignification process.
2. Materials and methods
2.1 Raw substrate
The wasteland weed, Saccharum spontaneum, was collected from local premises of the Indian Institute of Technology, Kharagpur, India. The entire plant, including stems and leaf sheaths, were cut into small pieces using a chopper. The chopped pieces were then sun dried and powdered to approximately 0.2 mm in particle size and subsequently used for further studies.
2.2 Biochemical composition analysis of raw substrate
The moisture content of S. spontaneum was determined by standard methods of the Association of Analytical Communities (AOAC).25 Lignin estimation was done by following the titrimetric method.26 Dried powdered substrate (0.05 g) was added to a 100 mL Erlenmeyer conical flask containing 60 mL of distilled water. Potassium permanganate (7.5 mL) and sulphuric acid solutions (7.5 mL) were mixed together. The solution was added immediately to the substrate to disintegrate the sample, followed by incubation for 10 min at 25 °C. Thereafter, 1.5 mL of potassium iodide solution was added, and free iodine was titrated with a standard sodium thiosulphate solution using starch as an indicator. A blank titration was carried out using the same volume of water and reagent. The amount of residual lignin (%, w/w) remaining in the solid sample was estimated by subtracting the final lignin from the initial lignin content.
The reduction of sugar content was measured by following the dinitrosalicylic acid method.27 The “semi-micro determination of cellulose” method was used to measure the cellulose content,28 whereas hemicellulose was estimated by the anthrone method.29
2.3 Elemental composition analysis of raw and delignified substrate
The carbon–hydrogen–nitrogen–sulphur (CHNS) analysis of raw and delignified substrate was carried out using an M/s Elementar, VarioMicrocube, Germany.
2.4 Enzyme
The enzyme used for delignification was hyperactive laccase produced from Pleurotus sp., and its activity was measured spectrophotometrically using 2,2′-azino-bis(3-ethylbenzothiazoline-6-sulphonic acid) (ABTS) as the substrate.30 One international unit (IU) of laccase activity was defined as the amount of enzyme required to oxidize 1 micro mol of ABTS per minute under the assay conditions.
2.5 Enzymatic delignification of S. spontaneum
Enzymatic delignification of S. spontaneum was carried out by incubating enzyme laccase and powdered substrate in a 50 mL Erlenmeyer conical flask with various solid loadings and reaction conditions. After a fixed incubation time, the solid residue was separated and subsequently oven dried to estimate residual lignin content. The delignification was monitored at various conditions of solid loading, incubation time, temperature, pH, and enzymatic concentration. In the beginning of the experimental work, single parameters, such as solid loading (5–40%, w/v), incubation time (1–10 h), temperature (30–60 °C), pH (3–10), and enzymatic concentration (100–1000 IU mL−1), were selected to study its effects on enzymatic delignification. Further optimization was done by RSM based on Central Composite Design.
2.6 Experimental design for the optimization of enzymatic delignification of S. spontaneum
The optimization and evaluation of enzymatic delignification of S. spontaneum was carried out using a three-level, 25, full-factorial central composite design (CCD) with five process parameters. The boundary parameters studied during the process of enzymatic delignification were solid loading of 15–25%, incubation time of 5–7 h, temperature of 35–45 °C, pH of 6–8, and enzymatic concentration of 300–500 IU mL−1. All the experiments were performed in triplicate, and the un-coded values of the process parameter was tabulated (Table 1). The resulting optimized condition was then used for the delignification of S. spontaneum, followed by residual lignin estimation.
Table 1 Experimental designs (factors and responses) for the enzymatic delignification of Saccharum spontaneum in terms of uncoded level of variables based on central composite design
Run order |
Solid loading (%) |
Incubation time (h) |
Temperature (°C) |
pH |
Enzyme concentration (IU mL−1) |
Delignification (%) |
Predicted |
Experimental |
1 |
25 |
5 |
35 |
6 |
300 |
75.14 |
75.30 |
2 |
25 |
6 |
40 |
7 |
400 |
77.24 |
77.68 |
3 |
15 |
7 |
35 |
8 |
500 |
73.10 |
73.03 |
4 |
20 |
6 |
40 |
8 |
400 |
76.56 |
77.54 |
5 |
20 |
5 |
40 |
7 |
400 |
73.24 |
73.33 |
6 |
20 |
6 |
40 |
6 |
400 |
87.24 |
86.30 |
7 |
20 |
6 |
40 |
7 |
400 |
86.56 |
85.60 |
8 |
25 |
7 |
35 |
8 |
300 |
73.14 |
73.08 |
9 |
20 |
6 |
40 |
7 |
500 |
87.56 |
86.03 |
10 |
20 |
6 |
45 |
7 |
400 |
75.14 |
75.59 |
11 |
25 |
5 |
45 |
6 |
500 |
74.15 |
74.09 |
12 |
20 |
6 |
40 |
7 |
400 |
86.56 |
85.40 |
13 |
25 |
5 |
45 |
8 |
300 |
76.56 |
76.37 |
14 |
15 |
5 |
35 |
8 |
300 |
73.72 |
73.75 |
15 |
25 |
7 |
45 |
6 |
300 |
77.24 |
77.31 |
16 |
20 |
6 |
40 |
7 |
400 |
86.56 |
85.48 |
17 |
25 |
7 |
45 |
8 |
500 |
78.24 |
77.96 |
18 |
15 |
7 |
35 |
6 |
300 |
78.20 |
78.48 |
19 |
20 |
6 |
40 |
7 |
300 |
77.27 |
76.84 |
20 |
15 |
5 |
45 |
6 |
300 |
76.98 |
77.14 |
21 |
25 |
5 |
35 |
8 |
500 |
71.94 |
71.75 |
22 |
25 |
7 |
35 |
6 |
500 |
77.24 |
77.31 |
23 |
15 |
5 |
45 |
8 |
500 |
79.40 |
79.21 |
24 |
20 |
6 |
40 |
7 |
400 |
86.56 |
85.44 |
25 |
15 |
6 |
40 |
7 |
400 |
87.30 |
86.70 |
26 |
20 |
6 |
40 |
7 |
400 |
86.56 |
86.48 |
27 |
20 |
6 |
40 |
7 |
400 |
86.56 |
85.48 |
28 |
15 |
7 |
45 |
8 |
300 |
75.14 |
75.08 |
29 |
15 |
7 |
45 |
6 |
500 |
84.20 |
85.26 |
30 |
15 |
5 |
35 |
6 |
500 |
75.24 |
75.39 |
31 |
20 |
6 |
35 |
7 |
400 |
73.72 |
73.30 |
32 |
20 |
7 |
40 |
7 |
400 |
74.44 |
74.39 |
2.7 Response surface methodology (RSM)
In the present study, response surface methodology based on three levels and 25 factorial central composite design was adopted to explore the effects of various process parameters. The various process parameters, such as solid loading (15–25%), incubation time (5–7 h), 35–45 °C, pH (6–8), and enzymatic concentration (300–500 IU mL−), were considered as factors to evaluate the response (% delignification), which was in accordance with the study carried out for the optimization of wet explosion pretreatment of a Douglas fir.31 The series of experimental runs designed and conducted are tabulated in Table 1 in un-coded terms, which include −1, 0, +1 as lowest, middle and highest values for five parameters, respectively. The analysis of the obtained data was done by the response surface regression method to fit into the second-order polynomial eqn (1), expressed as |
 | (1) |
where Y represents the response (% delignification), whereas βm0, βmi, βmii and βmij stand for constant coefficients, and Xi and Xj represents coded independent variables affecting the response variable Y.
2.8 Effect of mediators on enzymatic delignification
The powdered samples of S. spontaneum were treated with laccase in the presence of mediators such as ABTS, vanillic acid, and methyl syringate. The optimized process conditions of delignification, together with mediators (1–5%) were used to explore their effects on enzymatic delignification. The treatments were performed in a 50 mL Erlenmeyer conical flask placed in a water bath maintained at 40.85 °C and incubated for 6.21 h. After the treatment, the solid samples were separated, oven dried and analyzed for estimation of % delignification.
2.9 Measurement of energy density
The solid biomass samples before and after enzymatic delignification were used for energy-density measurement in a standard bomb calorimeter (Oxygen Bomb Calorimeter, Eastern Instruments, Kolkata, India). The powdered samples were dried at 40 °C in an oven to remove the moisture content and then subsequently compressed to form pellets using a pelletizer before being weighed. The heat content of the samples was determined in the bomb calorimeter in the presence of excess oxygen and at a high pressure (400 psi), which is considered to be a near-adiabatic system.
3. Structural characterization of raw and delignified substrate
Scanning electron microscopy (SEM) images discerned the surface characteristics of both the raw and delignified substrate. The procedure adopted for scanning electron microscopy included the coating of the dried substrate with gold and was subsequently observed under a JEOL JSM 5800 (Jeol Ltd, Tokyo, Japan) SEM.
Fourier transform infrared microscopy (FTIR) was carried out for both the raw and delignified substrates to reveal the functional groups and their band intensities, stretching vibrations and absorption peaks that contribute to the lignin, cellulose and hemicellulose structure by following the KBr pellet technique. FTIR spectra were obtained over the range of 400–4000 cm−1 with a spectral resolution of 0.5 cm−1.
X-ray diffraction was performed to analyze and calculate the degree of crystallinity for both the raw and delignified substrates using a XRD1710 equipment with CoKα radiation (α = 1.79 Å) at 40 kV and 20 mA. Both the samples were examined from 2θ = 15° to 75° with scanning speed of 3° min−1. Percentage crystallinity was defined as [(I002 − Iam)/I002] × 100, where I002 stands for the maximum crystalline intensity peak at 2θ between 22° and 23° for cellulose I, and Iam corresponds to minimum crystalline intensity peak at 2θ between 18° and 19° for cellulose I.32
4. Results and discussion
4.1 Biochemical characterization of S. spontaneum
In terms of carbohydrate content, biochemical compositional analysis is a pre-requisite to confirm biomass as a potential lignocellulosic substrate. The biochemical composition illustrated that S. spontaneum is rich in cellulose (38.70%, w/w) and hemicellulose (29.00%, w/w) with a moisture content of (4.95%, w/w), which makes it a suitable candidate for bioethanol production. However, the high lignin content (17.46%, w/w) of this substrate necessitates an effective delignification process to degrade lignin, which acts as a physical barrier for accessing cellulose and hemicellulose of a plant cell wall. Therefore, lignin degradation was necessary to further utilize this substrate. The reported composition of cellulose (45.10%, w/w), hemicellulose (22.75%, w/w) and lignin (24.56%, w/w) of S. spontaneum33 were slightly different than in the present study, which might be due to the difference either in geographical and seasonal variations or perhaps to various methods used for compositional analysis.
4.2 Elemental composition analysis of raw substrate
The elemental compositional analysis (Table 2) shows that the raw substrate contains a higher percentage of carbon and hydrogen than the delignified substrate, which indicates a higher degree of cross linking and occurrence of high-molecular-weight compounds.34 During enzymatic pretreatment, C–C and C–O bonds of lignin, which hold together the mono-lignols or lignin precursors of lignin molecule,35,36 were cleaved selectively by the enzyme, which was confirmed by the reduced percentage of carbon and hydrogen in the delignified substrate. This further indicated that the lignin precursors constituting the lignin molecule were cleaved specifically by laccase. The higher oxygen percentage in the delignified substrate in turn had a positive effect on the enzyme for oxidative cleavage of the electron-rich phenolic and non-phenolic moieties of lignin with a simultaneous reduction of oxygen to water.37 The effectiveness of the delignification process was also supported by the low amount of carbon loss (7.70%) in terms of less energy-density reduction or improved fuel properties of the substrate after enzymatic delignification. Nitrogen loss might be associated with the enzyme catalysis reaction. The increased oxygen amount in the delignified substrate might be because of oxidation–reduction reactions carried out by laccase, which comes under the family of oxidoreductase. In plants, thiol (–SH)-containing amino acids are buried under the hydrophobic core of proteins that might be oxidized by laccase during delignification, which contributes to higher sulphur content in the delignified substrate.
Table 2 Elemental composition analysis of raw and delignified substratea
Substrate |
C (wt%) |
H (wt%) |
N (wt%) |
S (wt%) |
O (wt%) |
Note: oxygen (wt%) was calculated from the difference of C, H, N and S. |
Raw |
38.69 |
4.712 |
0.7 |
0.218 |
55.68 |
Delignified |
35.71 |
4.175 |
0.62 |
0.345 |
59.15 |
4.3 Effect of single-process parameter on enzymatic delignification
4.3.1 Effect of solid loading on enzymatic delignification. To achieve the highest reaction efficiency in an enzyme-mediated delignification of S. spontaneum, a proper solid loading must be maintained. A high substrate concentration results in an inefficient interaction between enzyme and substrate molecules, whereas the low substrate concentration reduces the affinity of the enzyme towards the substrate. In the present study, solid loading was varied from 5% to 40% (Fig. 2). A solid loading of 20% was selected as optimum with delignification (71.93%, w/w) and 80% (w/w, dry wt) solid recovery. At a high solid loading, recovery of residual liquid was very low due to the high viscous nature, which could not be further used for by-product analysis. Solid recovery was approximately 80% (w/w, dry wt) in each level of all the parameters studied during delignification.
 |
| Fig. 2 Effect of solid loading on enzymatic delignification. | |
4.3.2 Effect of incubation time on enzymatic delignification. The reaction rate itself defines the consumption of the substrate or the formation of the product with respect to time. Hence, to study the effect of incubation time on enzymatic delignification, a reaction was carried out at 20% solid loading for a time period from 1 to 10 h. It was found that significant increase in delignification was observed up to 6 h of incubation (76.16%, w/w), which might be due to saturation of all of the active enzymatic sites. Fig. 3 shows the effect of incubation time on enzymatic delignification.
 |
| Fig. 3 Effect of incubation time on enzymatic delignification. | |
4.3.3 Effect of temperature on enzymatic delignification. Temperature plays an important role in the disruption of the lignocellulose matrix. At high temperatures (110 °C), hemicelluloses solubilization was observed, whereas the crystallinity of the cellulose was unaffected up to 170 °C. The present study was focused on the enzyme-based degradation of lignin, which operates at minimal process conditions. Enzymes, being proteins, were easily denatured in terms of active site distortion, whereas at low temperatures, their activity reduced because of the lack of kinetic motion between the enzyme and substrate molecules.38A range of temperature (30–60 °C) was selected to study its effect on enzymatic delignification process. Fig. 4 clearly demonstrated that maximum lignin degradation (74.21%, w/w) occurred at 40 °C.
 |
| Fig. 4 Effect of temperature on enzymatic delignification. | |
4.3.4 Effect of pH on enzymatic delignification. Enzymes are generally amphoteric molecules with respect to the acidic and basic groups residing on their surfaces. The charges on the respective groups will differ according to the pH of their surroundings. Variations in pH not only change the shape of an enzyme but also affect the surface hydrophobicity of the substrate. The surface charge of the substrate can be affected by variations in pH via surface functional groups to change surface hydrophobicity. Therefore, the optimum pH of an enzyme–substrate reaction is an important decisive factor for an enzyme-mediated delignification process. A broad range of pH (3–10) was selected to study its effect on the delignification process (Fig. 5). It was observed that the enzyme performed best between pH 5 and 8, showing maximum delignification (73.08%, w/w) at pH 7.
 |
| Fig. 5 Effect of pH on enzymatic delignification. | |
4.3.5 Effect of enzyme concentration on enzymatic delignification. Enzyme concentration plays an important role in all enzyme-catalyzed reactions because a small quantity of enzyme can catalyze a large amount of substrate into certain products. Hence, it is necessary to maintain an optimum level of enzyme concentration to obtain the maximum product.In the present study, an enzyme concentration of 100–1000 IU mL−1 was used for the enzymatic delignification of S. spontaneum (Fig. 6). It was observed that an enzyme concentration of 400 IU mL−1 was sufficient to result in maximum delignification (72.29%, w/w) without significant difference at higher enzyme concentrations.
 |
| Fig. 6 Effect of enzyme concentration on enzymatic delignification. | |
4.4 Statistical optimization of enzymatic delignification
A second-order polynomial equation was developed using the experimental data of enzymatic delignification along with the term of interactions between the different experimental variables.
The second-order polynomial mathematical expression for percent delignification with different variables (solid loading, incubation time, temperature, pH, and enzyme concentration) in terms of un-coded factors is represented in eqn (2), expressed as
|
Y1 = 36.7098 − 3.4492X1 + 35.5427X2 + 5.2905X3 − 33.7084X4 − 0.1122X5 + 0.0681X12 − 2.6266X22 − 0.0815X32 + 1.9334X42 + 0.0971X1X2 − 0.0043X1X2 + 0.0546X1X4 − 0.0364X2X3 − 0.7731X2X4 + 0.1961X3X4 + 0.0036X3X5 + 0.0037X4X5,
| (2) |
where
Y1 represents percent delignification and
X1,
X2,
X3,
X4, and
X5 refer to solid loading, incubation time, temperature, pH and enzymatic concentration, respectively.
The analysis of the variance (ANOVA) of the aforementioned quadratic equation for enzymatic delignification is represented in Table 3. The ANOVA outcome is detailed as an f-value and its corresponding degrees of freedom (DF) as a p-value. In an ANOVA, the f-value or f-ratio is the major statistical unit employed to test the hypothesis to make the effects real and significant along with the associated degrees of freedom. In addition, if the p-value or the probability value is found to be lower than the critical value (α), then the effect is supposed to be significant. In general, critical value used is to be set at 0.05 and hence, any value lower than this will produce significant effects, whereas greater value results in non-significant effects.
Table 3 ANOVA analysis of a quadratic model of RSM for enzymatic delignification
Source |
DFa |
Seq SSb |
Adj SSb |
Adj MSc |
F |
p |
Degrees of freedom. Sum of squares. Mean squares. |
Regression |
20 |
124.499 |
124.499 |
6.2249 |
14.18 |
<0.001 |
Linear |
5 |
47.457 |
43.102 |
8.6203 |
19.63 |
<0.001 |
Square |
5 |
37.737 |
37.737 |
7.5475 |
17.19 |
<0.001 |
Interaction |
10 |
39.304 |
39.304 |
3.9304 |
8.95 |
0.001 |
Residual error |
11 |
4.831 |
4.831 |
0.4391 |
|
|
Lack-of-fit |
6 |
3.371 |
3.371 |
0.5619 |
1.93 |
0.245 |
Pure error |
5 |
1.459 |
1.459 |
0.2918 |
|
|
Total |
31 |
129.329 |
|
|
|
|
R2 = 96.26%, R2(adj) = 89.47 |
|
|
|
|
|
|
During ANOVA analysis, the critical f-value at degrees of freedom 20 and 6 is found to be 3.87, which is less than the tabulated value of 14.18. Hence, it can be assumed that the regression of the quadratic polynomial equation is significant for enzymatic delignification. At degrees of freedom 5 and 6, the critical f-value is observed to be 4.38, which is less than the tabulated values of 19.63 and 17.19, thereby indicating that the square as well as the linear effects of the quadratic polynomial equation for enzymatic delignification are significant. In addition, the f (critical f-value) = 4.05 at degrees of freedom 10 and 6 is less than the calculated value of 8.95, which indicates that there is a significant interaction between the various parameters.39 Moreover, the p-values are found to be less than 0.05, which indicated that the regression model for enzymatic delignification of S. spontaneum is significant. The regression coefficient R2 was observed to be 96.26%, whereas the adjusted R2 was found to be 89.47%, which is good for biological systems. There is not much difference between the R2 and adjusted R2 values, which indicates the adequacy of the regression model for enzymatic delignification.
The aforementioned discussion and observations from the analysis of variance (ANOVA) table are validated by the study of 3D response surface plots in the regression equation, which emphasizes the important interactions between various selected parameters and their individual effects on enzymatic delignification.
4.5 3D response surface-plot analyses
Response surface plots are the graphical representations of the quadratic regression equation used to analyze the interactions and their influences on various parameters.
In the current study, various process parameters were selected and optimized for enzymatic delignification. It was clear from the response surface plot (Fig. 7) between solid loading and temperature that with an increase in these factors, percentage delignification increases up to a certain extent and thereafter markedly decreases, which might be due to the reduced enzymatic affinity towards substrates at a high substrate concentration and enzymatic denaturation at high temperatures. It was observed that a solid loading of 15% and 40.85 °C was optimal for an enzymatic delignification of S. spontaneum (Fig. 7a). In case of Ricinus communis, solid loading of 36.10% (solid
:
liquid 1
:
2.77) and 41.80 °C was found to be optimal for enzymatic delignification using laccase.40
 |
| Fig. 7 Response surface plots for (a) solid loading and temperature, (b) incubation time and temperature, (c) incubation time and enzyme concentration, and (d) incubation time and pH. | |
The response surface plot of incubation time and temperature revealed that an increase in these factors result in a higher percentage of delignification. However, after a certain time interval, no further increase in delignification was observed, which might be due to the saturation of all the active enzymatic sites (Fig. 7b). An incubation time of 6.21 h and 40.85 °C was found to be optimal for maximum delignification. In the case of Bambusa bambos, an incubation time of 8 h and 35.26 °C was reported to be optimal for enzymatic delignification using laccase.24
An enzyme concentration of 500 IU mL−1 and incubation time of 6.21 h was found to be optimal while analyzing the interaction between incubation time and enzyme concentration (Fig. 7c), whereas an enzyme concentration of 400 IU mL−1 and incubation time of 8 h was reported to be optimal for the enzymatic pretreatment of Bambusa bambos.24
The response surface plot between incubation time and pH revealed that the enzyme has a broad range of pH stability, and the optimum pH for maximum delignification was found to be 6.0, whereas during single-parameter selection, a pH of 7.0 was observed to be optimal (Fig. 7d). The optimal pH for the enzymatic delignification of Bambusa bambos using laccase was determined to be 6.87,24 which further supports the aforementioned data for the enzymatic delignification of S. spontaneum. After critical analysis of the 3D surface plots, the optimal process conditions for enzymatic delignification were as follows: solid loading of 15%, incubation time of 6.21 h, temperature of 40.85 °C, pH 6.0, and enzyme concentration of 500 IU mL−1. Following the optimal process conditions, the maximum predicted delignification obtained was 85.37%, which is very close to the obtained experimental percent delignification, 84.67% (residual lignin, 2.67%, w/w), with nearly 20% (w/w) solid loss and 80% (w/w) solid recovery, which is inconsistent with the solid loss of 15.6–47.5% (w/w) during NaOH pretreatment of S. spontaneum.41 The previously adopted optimization process is in coherence with the optimization of hydrogel for improved swelling capacity.42
4.6 Delignification of S. spontaneum in the presence of mediators
A series of experiments were carried out to determine the effects of mediators, such as vanillic acid, ABTS, and methyl syringate, for lignocellulosic delignification. The concentrations of the mediators varied from 1% to 5%. The % delignification of delignified substrate was determined using the titrimetric method,26 in which the mediator concentrations varied from 1% to 5%. The concentration of ABTS (2%) was found to be significant, having a maximum of 80.11% delignification. However, for vanillic acid, the maximum % delignification was recorded at 3% concentration possessing 77.27% delignification. In the case of methyl syringate, the maximum delignification was recorded to be 75.85% at a 4% concentration. Thus, mediators do not have any significant impact on the delignification process, whereas 84.67% delignification was recorded when comparing the process without a mediator. However, there are some reports that indicate the role of mediator in enhanced % delignification, which was observed in the recombinant fungal laccase.43 In the present study, although the added mediator plays no significant role in enhanced percent delignification, it can assumed that natural mediators must be present in the enzyme broth while extracting the enzyme after fermentation and thus reacted naturally without addition of any external mediator. It can be noted that laccase was produced using lignin-enriched biomass.
4.7 Energy density measurement
The energy density of lignocellulosics is one of the most important factors that should be taken into account because of its prime role in the overall economic process of biofuels production process. In general, lignocellulosic feedstocks having lower energy densities are considered to be less energy efficient in terms of their conversion into biofuels when compared with the high-energy density feedstocks.44–46 Initially, the raw substrate contains more energy density because of higher lignin content, which carries higher energy than cellulose and hemicellulose. After pretreatment, the energy density of the delignified substrate was found to be reduced (Table 4). This might be due to lignin degradation, which is in coherence with the study wherein the energy density of lignocellulosic (cotton stalk) was reduced after pretreatment or delignification with ionic liquid.47
Table 4 Energy density of raw and delignified substrate
Biomass |
Lignin (%, w/w) |
Energy density (kJ g−1) |
Raw |
17.46 |
12.10 ± 0.33 |
Delignified |
2.67 |
10.48 ± 0.21 |
4.8 Structural characterization of S. spontaneum
Scanning electron microscopy (SEM) was carried out to observe the structural characteristics of S. spontaneum before and after enzymatic delignification. In general, lignin is a highly polymeric cross-linked structure that imparts rigidity and strength to plants. The raw substrate before pretreatment is in the form of a rigid and highly ordered surface structure. However, rigidity and ordered surface structure was distorted in the enzyme-mediated delignified substrate because of an enzymatic action on lignin, which further enhanced the surface area of cellulose, making it amenable for cellulolytic enzymes47 (Fig. 8).
 |
| Fig. 8 SEM images (a) raw substrate (b) delignified substrate. | |
Fourier transform infrared (FTIR) spectra show significant changes after enzymatic delignification. From Fig. 9, it was depicted that the band at 3409 cm−1 was because of the broad O–H stretching groups, and the bands at 2919 cm−1 and 2854 cm−1 were attributed to the C–H stretching in CH3 and CH2 groups.47 The bands at 1608 cm−1 and 1637 cm−1 were due to
C
C
stretching, and the band at 1731 cm−1 was attributed to
C
O
.48 Absorption at 1106, 1162, 1253, and 1321 cm−1 could be attributed to be acyl and O–H phenolic groups. In enzymatically delignified spectra, bands observed at 1376 cm−1 and 1049 cm−1 appear to be characteristic of C–H cellulose and hemicelluloses.49 From the previous spectral observation, it is concluded that the stretching and weakening of the bands with respect to their corresponding wavenumber indicates significant degradation of lignin by laccase.
 |
| Fig. 9 FTIR spectra of raw and delignified substrate of S. spontaneum. | |
Infrared spectra of the delignified sample were similar to that of raw spectra, which signifies that the delignification condition does not promote severe changes in the chemical structures of cellulose and hemicellulose.
Cellulose crystallinity is one of the major factors that strongly evidenced the effectiveness of the enzymatic delignification in terms of increased % crystallinity. The biodegradability of biomass after delignification mainly depends on the cellulose crystallinity combined with the enzymes.50 It also influences the enzymatic hydrolysis of cellulose and hemicellulose after enzymatic delignification.51,52 The cellulose crystallinity value of raw substrate was observed to be 76.71%, which was increased to 85.26% in the delignified substrate (Fig. 10) and is consistent with the results of crystallinity increase in enzymatically treated Bambusa bambos (33%) than the raw sample (28.44%).24 The crystallinity values of raw and delignified samples as well as hemicellulose and the reduction of sugar content of S. spontaneum were tabulated (Table 5). From the table, it was observed that increased crystallinity (10.14%) of the delignified substrate is due to removal of lignin and amorphous hemicellulosic fractions53 that might expose the buried crystalline cellulose.
 |
| Fig. 10 XRD of raw and pretreated substrate of S. spontaneum. | |
Table 5 Crystallinity and reducing sugar content of raw and delignified substrate
Incubation time (h) |
% cellulose crystallinity |
% increase crystallinity |
Hemicellulose (%, w/w) |
Reducing sugar (mg g−1) |
Raw |
76.61 |
— |
29.00 |
67.50 |
Delignified |
85.26 |
10.14 |
24.48 |
462.18 |
5. Conclusion
Lignocellulose is an indispensable source for renewable biofuel production. In the present study, it has been observed that S. spontaneum can be a viable substrate for biofuel production owing to its richness in cellulose (38.70%) and hemicellulose (29.00%) content. To corroborate the hypothesis, a study on enzymatic delignification of S. spontaneum was investigated and optimized the process conditions by RSM based on CCD design. The optimized process conditions were solid loading, 15% (w/v); incubation time, 6.21 h; temperature, 40.85 °C; pH, 6.0; and enzyme concentration, 500 IU mL−1. The maximum delignification and reducing sugar obtained were 84.67% and 462.18 mg g−1, respectively, with an increased crystallinity of 10.14% over the raw substrate. SEM analysis signifies the changes in surface characteristics of the delignified biomass. FTIR shows that delignification conditions do not lead to major changes in the structures of cellulose and hemicellulose. The study not only explored the potential of S. spontaneum as a viable substrate but also substantiated enzymatic delignification as one of the best methods for biofuel production, helping researchers to explore the possibility of utilizing the substrate to help satisfy the ever-growing global demand for energy.
Acknowledgements
We are thankful to the University Grants Commission, New Delhi, India, for providing a scholarship to Mr Rajiv Chandra Rajak to carry out this study.
References
- A. Avinash, D. Subramaniam and A. Murugesan, Renewable Sustainable Energy Rev., 2014, 29, 517–527 CrossRef CAS.
- SADoME, Biofuels industrial strategy of the Republic of South Africa, Department of Minerals and Energy, South Africa, 2007, http://www.energy.gov.za/files/esources/petroleum/biofuels%20_indus_strat.pdf%20%282%%2029.pdf Search PubMed.
- B. C. Saha and M. A. Cotta, Biomass Bioenergy, 2008, 32, 971–977 CrossRef CAS.
- C. S. T. Sastri and K. Y. Kavathekar, Plants for reclamation of wastelands, CSIR, New Delhi, India, 1990, pp. 360–362.
- A. K. Chandel, M. L. Narasu, G. Chandrasekhar, A. Manikyam and L. V. Rao, Bioresour. Technol., 2009, 100, 2404–2410 CrossRef CAS.
- A. K. Chandel, M. L. Narasu, R. Rudravaram, P. Ravindra and L. V. Rao, Int. J. Food Eng., 2009, 2, 1–12 Search PubMed.
- D. Scordia, S. L. Cosentino and T. W. Jeffries, Bioresour. Technol., 2010, 101, 5358–5365 CrossRef CAS.
- R. Martín-Sampedro, J. L. Rahikainen, L. S. Johansson, K. Marjamaa, J. Laine, K. Kruus and O. J. Rojas, Biomacromolecules, 2013, 14, 1231–1239 CrossRef.
- N. Pareek, T. Gillgren and L. J. Jönsson, Bioresour. Technol., 2013, 148, 70–77 CrossRef CAS.
- J. L. Rahikainen, R. Martin-Sampedro, H. Heikkinen, S. Rovio, K. Marjamaa, T. Tamminen, O. J. Rojas and K. Kruus, Bioresour. Technol., 2013, 133, 270–278 CrossRef CAS.
- S. Nakagame, R. P. Chandra and J. N. Saddler, Biotechnol. Bioeng., 2010, 105, 871–879 CAS.
- A. Tejirian and F. Xu, Enzyme Microb. Technol., 2011, 48, 239–247 CrossRef CAS.
- A. T. Martínez, F. J. Ruiz-Dueñas, M. J. Martínez, J. C. del Río and A. Gutiérrez, Curr. Opin. Biotechnol., 2009, 20, 348–357 CrossRef.
- R. Bourbonnais, M. G. Paice, B. Freiermuth, E. Bodie and S. Borneman, Appl. Environ. Microbiol., 1997, 63, 4627–4632 CAS.
- A. Gutiérrez, J. Rencoret, E. M. Cadena, A. Rico, D. Barth, J. C. del Río and A. T. Martínez, Bioresour. Technol., 2012, 119, 114–122 CrossRef.
- Q. Chen, M. N. Marshall, S. M. Geib, M. Tien and T. L. Richard, Bioresour. Technol., 2012, 117, 186–192 CrossRef CAS.
- N. Mosier, C. Wyman, B. Dale, R. T. Elander, Y. Y. Lee and M. Holtzapple, Bioresour. Technol., 2005, 96, 673–686 CrossRef CAS.
- R. Biswas, H. Uellendahl and B. K. Ahring, BioEnergy Res., 2015 DOI:10.1007/s12155-015-9590-5.
- Y. Morikawa, X. Zhao and D. Liu, RSC Adv., 2014, 4, 37878–37888 RSC.
- C. Cara, E. Ruiz, I. Ballesteros, M. J. Negro and E. Castro, Process Biochem., 2006, 41, 423–429 CrossRef CAS.
- C. Eggert, U. Temp, J. F. Dean and K. E. Eriksson, FEBS Lett., 1996, 391, 144–148 CrossRef CAS.
- C. Johannes and A. Majcherczyk, Appl. Environ. Microbiol., 2000, 66, 524–528 CrossRef CAS.
- P. Astolfi, P. Brandi, C. Galli, P. Gentili, M. F. Gerini and L. Greci, New J. Chem., 2005, 29, 1308–1317 RSC.
- A. Kuila, M. Mukhopadhyay, D. K. Tuli and R. Banerjee, Enzyme Res, 2011, 2011, 8 Search PubMed.
- AOAC, Official methods of analysis, Association of Official Analytical Chemists, Maryland, USA, 17th edn, 2000 Search PubMed.
- M. A. Hussain, M. E. Huq and S. M. Rahman, Pak. J. Biol. Sci., 2002, 5, 521–522 CrossRef.
- G. L. Miller, Anal. Chem., 1959, 31, 426–428 CrossRef CAS.
- D. M. Updegraff, Anal. Biochem., 1969, 32, 420–424 CrossRef CAS.
- J. A. Marlett and S. C. Lee, J. Food Sci., 2006, 45, 1688–1693 CrossRef.
- S. S. Bhattacharya and R. Banerjee, Chemosphere, 2008, 73, 81–85 CrossRef CAS.
- R. Biswas, P. J. Teller and B. K. Ahring, Bioresour. Technol., 2015, 192, 46–53 CrossRef CAS.
- L. Segal, J. J. Creely, A. E. Martin and C. M. Conrad, Text. Res. J., 1959, 29, 786–794 CrossRef CAS.
- A. K. Chandel, O. V. Singh, L. V. Rao, G. Chandrasekhar and M. L. Narasu, Bioresour. Technol., 2011, 102, 1709–1714 CrossRef CAS.
- S. Nanda, P. Mohanty, J. A. Kozinski and A. K. Dalai, Energ. Environ. Res., 2014, 4, 21–32 Search PubMed.
- E. Adler, Wood Sci. Technol., 1977, 11, 169–218 CrossRef CAS.
- P. Karhunen, P. Rummakko, J. Sipilä, G. Brunow and I. Kilpeläinen, Tetrahedron Lett., 1995, 36, 4501–4504 CrossRef CAS.
- R. Bourbonnais, M. G. Paice, B. Freiermuth, E. Bodie and S. Borneman, Appl. Environ. Microbiol., 1997, 63, 4627–4632 CAS.
- T. W. Moon and P. W. Hochachka, Biochem. J., 1971, 123, 695–705 CrossRef CAS.
- D. C. Montgomery and G. C. Runger, Applied Statistics and Probability for Engineers, John Wiley and Sons (Asia) Pvt. Ltd, Singapore, 3rd edn, 2002 Search PubMed.
- M. Mukhopadhyay, A. Kuila, D. K. Tuli and R. Banerjee, Biomass Bioenergy, 2011, 35, 3584–3591 CrossRef CAS.
- R. Kataria and S. Ghosh, Energy Sources, Part A, 2014, 36, 1028–1035 CrossRef CAS.
- S. K. Balbir, R. Sharma, S. Kalia and M. S. Bhatti, RSC Adv., 2014, 4, 40339–40344 RSC.
- A. Rico, J. Rencoret, J. C. del Río, A. T. Martínez and A. Gutiérrez, Biotechnol. Biofuels, 2014, 7, 6 CrossRef.
- J. Shi, V. S. Thompson, N. A. Yancey, V. Stavila, B. A. Simmons and S. Singh, Biofuels, 2013, 4, 63–72 CrossRef CAS.
- S. Sokhansanj, S. Mani, A. Turhollow, A. Kumar, D. Bransby, L. Lynd and M. Laser, Biofuels, Bioprod. Biorefin., 2009, 3, 124–141 CrossRef CAS.
- S. Sokhansanj and J. R. Hess, Methods Mol. Biol., 2009, 581, 1–25 Search PubMed.
- M. F. Li, Y. M. Fan, F. Xu, R. C. Sun and X. L. Zhang, Ind. Crops Prod., 2010, 32, 551–559 CrossRef CAS.
- R. Bodirlau and C. A. Teaca, Rom. J. Phys., 2008, 54, 93–104 Search PubMed.
- P. M. S. Sara, A. M. C. Lopes, L. B. Roseiro and R. B. Łukasik, RSC Adv., 2013, 3, 16040–16050 RSC.
- P. He, L. Chai, L. Li, L. Hao, L. Shaob and F. Lu, RSC Adv., 2013, 3, 11759–11773 RSC.
- R. Kumar and C. E. Wyman, Biotechnol. Bioeng., 2009, 102, 1544–1557 CrossRef CAS.
- D. Kumar, M. Ashfaque, M. Muthukumar, M. Singh and N. Garg, J. Environ. Biol., 2012, 33, 81–84 CAS.
- J. Gabhane, S. P. M. P. William, A. N. Vaidya, K. Mahapatra and T. Chakrabarti, Biomass Bioenergy, 2011, 35, 96–102 CrossRef CAS.
|
This journal is © The Royal Society of Chemistry 2015 |
Click here to see how this site uses Cookies. View our privacy policy here.