 Open Access Article
Creative Commons Attribution 3.0 Unported Licence
The beneficial effects of trifluoromethyl-substituents on the photoconversion efficiency of copper(I) dyes in dye-sensitized solar cells†
Fabian
Brunner
,
Y. Maximilian
Klein
,
Sarah
Keller
,
Collin D.
Morris
,
Alessandro
Prescimone
,
Edwin C.
Constable
and
Catherine E.
Housecroft
*
Department of Chemistry, University of Basel, Spitalstrasse 51, CH-4056 Basel, Switzerland. E-mail: catherine.housecroft@unibas.ch
First published on 6th July 2015
Abstract
The synthesis and characterization of [Cu(2)2][PF6] and [Cu(3)2][PF6] in which 2 = 6,6′-bis(trifluoromethyl)-2,2′-bipyridine and 3 = 6-trifluoromethyl-2,2′-bipyridine are reported. The single crystal structure of [Cu(2)2][PF6] confirms that the copper(I) centre is sterically protected by the four CF3 groups in a near regular tetrahedral environment. The Cu+/Cu2+ oxidation potential is shifted from +0.44 to +0.72 V on going from [Cu(1)2][PF6] to [Cu(2)2][PF6] (1 = 6,6′-dimethyl-2,2′-bipyridine), in keeping with the electron-withdrawing effects of the CF3 groups. 1H and 19F NMR spectroscopic data for a CH2Cl2 solution containing [Cu(1)2][PF6] and [Cu(2)2][PF6] demonstrate that the ligands in [Cu(2)2][PF6] remain highly labile. An on-surface procedure was used to assemble the dyes [Cu(4)(2)]+ and [Cu(4)(3)]+ (4 = anchoring ligand ((6,6′-dimethyl-[2,2′-bipyridine]-4,4′-diyl)bis(4,1-phenylene))bis(phosphonic acid)) on TiO2; solid-state absorption spectra show that dye coverage for [Cu(4)(3)][PF6] exceeds that of [Cu(4)(2)][PF6]. The performances of the dyes in dye-sensitized solar cells (DSCs) are compared with that of [Cu(4)(1)]+. DSCs containing the fluorinated ancillary ligands exhibit photoconversion efficiencies of ≈30–34% relative to N719 set at 100%; this is a significant enhancement with respect to DSCs containing [Cu(4)(1)]+ with no fluoro-groups. Density functional theory (DFT) calculations for the heteroleptic dyes demonstrate that the HOMO is stabilized upon introduction of the CF3 groups, but that the compositions of the molecular orbitals in the HOMO–LUMO manifold are little changed. The improved DSC performance is associated with enhanced short-circuit current density (JSC) for [Cu(4)(3)]+ and [Cu(4)(2)]+ versus [Cu(4)(1)]+; this is also seen in high EQEmax values of 46% for [Cu(4)(2)]+ and 51% for [Cu(4)(3)]+ (both at λmax = 480 nm).
Introduction
The replacement of rare elements by Earth-abundant metals in dye-sensitized solar cells (DSCs),1,2 organic light-emitting diodes (OLEDs),3,4 and light-emitting electrochemical cells (LECs)5 is a high priority for developing sustainable materials chemistry. Although ruthenium, metal porphyrin-based and metal-free organic compounds are state-of-the-art dyes with photoconversion efficiencies reaching ≈12%,6 the last few years have seen significant progress in the use of copper(I) complexes in Grätzel-type7 DSCs. Most attention has focused on the development of [Cu(![[N with combining circumflex]](https://www.rsc.org/images/entities/char_004e_0302.gif) N)2]+ complexes in which
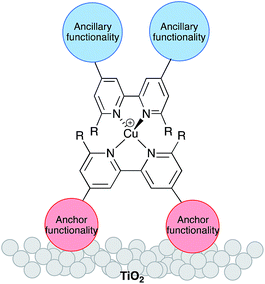
N)2]+ complexes in which ![[N with combining circumflex]](https://www.rsc.org/images/entities/char_004e_0302.gif) N is a 2,2′-bipyridine (bpy) or 1,10-phenanthroline (phen) domain. Early copper(I) dyes were homoleptic complexes bearing anchoring groups,8–11 and such compounds continue to be used.12 However, DSC performance benefits from the use of heteroleptic dyes [Cu(Lanchor)(Lancillary)]+. One ligand bears peripheral groups suited to binding to the semiconductor (TiO2) surface, while functionalities in the second (ancillary) ligand can be freely varied (Scheme 1) allowing ready tuning of the photophysical properties of the dye.
N is a 2,2′-bipyridine (bpy) or 1,10-phenanthroline (phen) domain. Early copper(I) dyes were homoleptic complexes bearing anchoring groups,8–11 and such compounds continue to be used.12 However, DSC performance benefits from the use of heteroleptic dyes [Cu(Lanchor)(Lancillary)]+. One ligand bears peripheral groups suited to binding to the semiconductor (TiO2) surface, while functionalities in the second (ancillary) ligand can be freely varied (Scheme 1) allowing ready tuning of the photophysical properties of the dye.
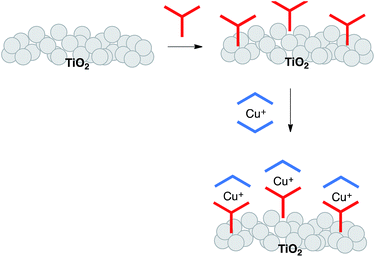
Substituents adjacent to the N,N′-metal binding site in bpy and phen are essential for stabilizing tetrahedral copper(I) against oxidation to square planar copper(II).13 However, unless these substituents are very sterically demanding, heteroleptic complexes rapidly establish an equilibrium mixture of homo- and heteroleptic complexes,14 making synthesis and isolation of the latter challenging. Two independent strategies have emerged for the synthesis and surface-binding of heteroleptic copper(I) sensitizers. The first is the HETPHEN approach with bulky substituents adjacent to the N,N′-donor sites15 allowing heteroleptic copper(I) dyes to be isolated and then adsorbed onto an electrode surface.16,17 Using this approach, Boujtita, Odobel and co-workers have designed a dye with a landmark photon-to-current conversion efficiency of 4.66% (relative to 7.36% for ruthenium dye N719).17 In the second approach, we have introduced a stepwise, on-surface assembly in which the photoanode is first functionalized with an anchoring ligand, which then undergoes in situ ligand exchange with a homoleptic copper(I) complex (Scheme 2).18,19 A variation of the latter is a one-pot approach, in which the ligand-functionalized electrode is soaked in a dye-bath comprising a 1![[thin space (1/6-em)]](https://www.rsc.org/images/entities/char_2009.gif) :
:![[thin space (1/6-em)]](https://www.rsc.org/images/entities/char_2009.gif) 1 mixture of [Cu(MeCN)4][PF6] and an ancillary ligand.20 Both are straightforward and adaptable methods that allow fast throughput screening of combinations of Lanchor and Lancillary in [Cu(Lanchor)(Lancillary)]+ sensitizers. Using this approach, we have achieved photoconversion efficiencies of >3% (relative to 7.63% for reference dye N719).21
1 mixture of [Cu(MeCN)4][PF6] and an ancillary ligand.20 Both are straightforward and adaptable methods that allow fast throughput screening of combinations of Lanchor and Lancillary in [Cu(Lanchor)(Lancillary)]+ sensitizers. Using this approach, we have achieved photoconversion efficiencies of >3% (relative to 7.63% for reference dye N719).21
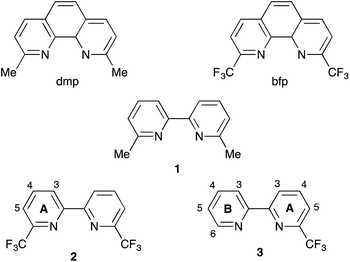
Given that surface-bound sensitizers are typically designed on a ‘push–pull’ principle,22 it is somewhat surprising that the highest efficiencies (3.16%) for copper-based DSCs assembled by the on-surface approach are for dyes in which the ancillary ligands contain electron-withdrawing halo-substituents.21 The results of ground state DFT calculations indicate that the incorporation of peripheral iodo-substituents in the dye may result in improved electron transfer from the reduced electrolyte over the halo-substituted aryl ring to the sensitizer.21 More elaborately designed copper(I) dyes containing peripheral hole-transporting domains20,23–25 failed to achieve efficiencies as high as those with halo-functionalities. Interestingly, the incorporation of fluorinated-substituents in both ruthenium(II) and organic dyes may impede charge recombination events.26,27 We were therefore prompted to consider different ways in which halo-substituents could be incorporated into the ancillary ligand in a [Cu(Lanchor)(Lancillary)]+ sensitizer. One of the simplest ancillary ligands is 6,6′-dimethyl-2,2′-bipyridine (1, Scheme 3). The performances of cells incorporating [Cu(Lanchor)(1)]+ sensitizers are enhanced on going from Lanchor with carboxylic acid to phosphonic acid anchors, and by introducing an arene spacer between the bpy and phosphonic acid anchor domains.28,29 Here, we report the effects of replacing 1 as the ancillary ligand by 2 or 3 which contain CF3 groups in the 6- and 6′-positions of the bpy ligand (Scheme 3). The introduction of CF3 substituents in the 2- and 9-positions in [Cu(phen)2]+ complexes has been investigated in detail,30–33 and considerably stabilizes these complexes with respect to oxidation to copper(II).30
Experimental
General
A Bruker Avance III-400 or 500 NMR spectrometer was used to record 1H, 13C, 19F and 31P NMR spectra at 295 K. 1H and 13C chemical shifts were referenced to residual solvent peaks with respect to δ(TMS) = 0 ppm, 31P with respect to δ(85% aqueous H3PO4) = 0 ppm, and 19F with respect to an external reference of CFCl3 (δ = 0 ppm). Solution and solid-state absorption spectra were recorded on an Agilent 8453 and Cary 5000 spectrophotometer, respectively; solid-state spectra were recorded in transmission mode. Electrospray ionization (ESI) and MALDI-TOF mass spectra were recorded on Bruker Esquire 3000plus and Bruker microflex FT instruments, respectively.Electrochemical measurements were made using a CH Instruments 900B potentiostat with glassy carbon or platinum working electrode and platinum wire and silver wire as the counter and pseudo-reference electrodes, respectively. Substrates were dissolved in HPLC grade CH2Cl2 (≈10−4 to 10−5 mol dm−3) containing 0.1 mol dm−1 [nBu4N][PF6] as the supporting electrolyte; all solutions were degassed with argon. Cp2Fe (Fc) was used as an internal or external reference (see text) and the scan rate was 100–300 mV s−1.
A Biotage Initiator 8 was used for microwave reactions. Compound 2 was prepared according to the literature.34 2-Chloro-6-(trifluoromethyl)pyridine and 2-pyridylzinc bromide were purchased from Fluorochem and Merck, respectively. [Cu(MeCN)4][PF6] was prepared as previously reported.35
![[thin space (1/6-em)]](https://www.rsc.org/images/entities/char_2009.gif) 600), 245sh (9400), 282 (12
600), 245sh (9400), 282 (12![[thin space (1/6-em)]](https://www.rsc.org/images/entities/char_2009.gif) 600), 295sh (6700). Found C 59.31, H 3.41, N 12.46; C11H7F3N2 requires C 58.93, H 3.15, N 12.50%.
600), 295sh (6700). Found C 59.31, H 3.41, N 12.46; C11H7F3N2 requires C 58.93, H 3.15, N 12.50%.
![[thin space (1/6-em)]](https://www.rsc.org/images/entities/char_2009.gif) 500), 295 (23
500), 295 (23![[thin space (1/6-em)]](https://www.rsc.org/images/entities/char_2009.gif) 000), 340 (2980), 445 (7050). Found C 36.63, H 1.98, N 7.39; C24H12CuF18N4P requires C 36.36, H 1.53, N 7.07%.
000), 340 (2980), 445 (7050). Found C 36.63, H 1.98, N 7.39; C24H12CuF18N4P requires C 36.36, H 1.53, N 7.07%.
![[thin space (1/6-em)]](https://www.rsc.org/images/entities/char_2009.gif) 400), 273 (25
400), 273 (25![[thin space (1/6-em)]](https://www.rsc.org/images/entities/char_2009.gif) 800), 293 (26
800), 293 (26![[thin space (1/6-em)]](https://www.rsc.org/images/entities/char_2009.gif) 200), 340 (2940), 443 (6580). Found C 40.94, H 2.51, N 8.53; C22H14CuF12N4P requires C 40.23, H 2.15, N 8.53%.
200), 340 (2940), 443 (6580). Found C 40.94, H 2.51, N 8.53; C22H14CuF12N4P requires C 40.23, H 2.15, N 8.53%.
![[thin space (1/6-em)]](https://www.rsc.org/images/entities/char_2009.gif) 705 reflections, 4905 unique, Rint = 0.051. Refinement of 4869 reflections (434 parameters) with I > 2σ(I) converged at final R1 = 0.0369 (R1 all data = 0.0370), wR2 = 0.1038 (wR2 all data = 0.1038), gof = 1.0014. CCDC 1062412.†
705 reflections, 4905 unique, Rint = 0.051. Refinement of 4869 reflections (434 parameters) with I > 2σ(I) converged at final R1 = 0.0369 (R1 all data = 0.0370), wR2 = 0.1038 (wR2 all data = 0.1038), gof = 1.0014. CCDC 1062412.†
The dye-covered TiO2 electrode and Pt counter-electrode were combined using thermoplast hot-melt sealing foil (Solaronix Test Cell Gaskets) by heating while pressing them together. The electrolyte (LiI (0.1 M), I2 (0.05 M), 1-methylbenzimidazole (0.5 M), 1-butyl-3-methylimidazolinium iodide (0.6 M) in 3-methoxypropionitrile) was introduced into the DSC by vacuum backfilling. The hole in the counter electrode was sealed with hot-melt sealing foil (Solaronix Test Cell Sealings) and a cover glass (Solaronix Test Cell Caps).
Measurements were made by irradiating from behind using a light source LOT Quantum Design LS0811 (100 mW cm−2 = 1 sun). The power of the simulated light was calibrated using a reference Si cell. All DSCs were completely masked40,41 before measurements were made.
For solid-state absorption spectra of adsorbed dyes, Solaronix Test Cell Titania Electrodes (transparent) were used and the dye assembly was as described above for the photoanode.
Results and discussion
Preparation and characterization of 3
The asymmetrical ligand 3 was prepared under microwave conditions by the Negishi cross coupling43 of 2-chloro-6-(trifluoromethyl)pyridine and 2-pyridylzinc bromide in the presence of a catalytic amount of [Pd(PPh3)4]. After workup, 3 was isolated in 61% yield. The base peak in the electrospray mass spectrum appeared at m/z 225.1 and arose from [M + H]+. The 1H and 13C NMR spectra (assigned by 2D methods) of a CD2Cl2 solution of 3 were consistent with the structure shown in Scheme 3. In the 1H NMR spectrum of 3 (Fig. 1), the resonances from the CF3-substituted pyridine ring (δ 8.64, 7.99 and 7.69 ppm) are close to those observed for disubstituted 2 (ref. 34) (Scheme 3) in the same solvent (δ 8.73, 8.03 and 7.74 ppm). A singlet at δ −68.4 ppm was observed in the 19F NMR spectrum of 3 (the same chemical shift exhibited by ligand 2) and coupling to CCF3 (JCF = 274 Hz) and CA6 (JCF = 35 Hz) in the 13C NMR spectrum of 3 was consistent with the reported values of JCF in 2.34 Coupling from the CF3 group to CA5 (JCF = 2.9 Hz) was also resolved.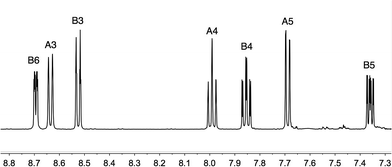 | ||
| Fig. 1 500 MHz 1H NMR spectrum of compound 3 in CDCl3. Chemical shifts in δ/ppm. See Scheme 3 for ring labelling. | ||
Synthesis and characterization of [Cu(2)2][PF6] and [Cu(3)2][PF6]
The homoleptic complexes [Cu(2)2][PF6] and [Cu(3)2][PF6] were prepared by the reaction of [Cu(MeCN)4][PF6] with two equivalents of the respective ligand in CH2Cl2. Use of MeCN, both in the synthesis and spectroscopic characterization, was avoided because of possible competitive coordination to copper.44 The base peak in the MALDI-TOF mass spectrum of each complex was assigned to the [CuL2]+ ion (m/z 647.2 for L 2, m/z 511.1 for L = 3). Fig. 2 shows the solution 1H NMR spectra of the complexes; the 1H and 13C NMR spectra were assigned using 2D-methods and are consistent with the presence of a 6,6′-disubstituted ligand in [Cu(2)2][PF6] and a 6-substituted ligand in [Cu(3)2][PF6]. The 19F NMR spectra of [Cu(2)2][PF6] and [Cu(3)2][PF6] are shown in Fig. S1;† the relative integrals of the singlets for ligands 2 or 3 with respect to the doublet for the [PF6]− ion are consistent with four or two CF3 groups, respectively.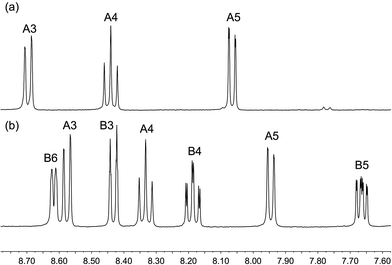 | ||
| Fig. 2 500 MHz 1H NMR spectra of (a) [Cu(2)2][PF6] and (b) [Cu(3)2][PF6] in CD2Cl2. Chemical shifts in δ/ppm. See Scheme 3 for ring labelling. | ||
The solution absorption spectra of [Cu(2)2][PF6] and [Cu(3)2][PF6] are shown in Fig. 3 and data given in Table 1. The intense, high-energy transitions arise from ligand-based π* ← π transitions, and the broad band in the visible region from metal-to-ligand charge transfer (MLCT).45,46 In [Cu(2)2][PF6], the MLCT band has a maximum at 445 nm compared with 443 nm in [Cu(3)2][PF6]. This compares with 453 nm in [Cu(1)2][PF6] (see Scheme 3 for 1).28 Similarly, the MLCT bands in [Cu(dmp)2][PF6] and [Cu(bfp)2][PF6] arise at similar wavelengths (453 and 462 nm, respectively).28,30,47
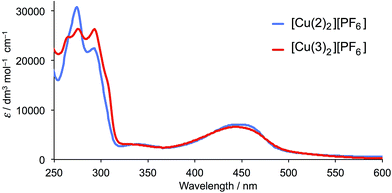 | ||
| Fig. 3 Solution absorption spectra of [Cu(2)2][PF6] and [Cu(3)2][PF6] (CH2Cl2, 2.5 × 10⁻⁵ mol dm−3). | ||
| Complex | λ max (ε) π* ← π/nm (dm3 mol−1 cm−1) | λ max (ε) MLCT/nm (dm3 mol−1 cm−1) |
|---|---|---|
| [Cu(2)2][PF6] | 273 (30![[thin space (1/6-em)]](https://www.rsc.org/images/entities/char_2009.gif) 500), 295 (23 500), 295 (23![[thin space (1/6-em)]](https://www.rsc.org/images/entities/char_2009.gif) 000), 340 (2980) 000), 340 (2980) |
445 (7050) |
| [Cu(3)2][PF6] | 263 (24![[thin space (1/6-em)]](https://www.rsc.org/images/entities/char_2009.gif) 400), 273 (25 400), 273 (25![[thin space (1/6-em)]](https://www.rsc.org/images/entities/char_2009.gif) 800), 293 (26 800), 293 (26![[thin space (1/6-em)]](https://www.rsc.org/images/entities/char_2009.gif) 200), 340 (2940) 200), 340 (2940) |
443 (6580) |
The electrochemical behaviour of [Cu(2)2][PF6] was investigated in CH2Cl2 solution. Studies of the electrochemistry of [Cu(phen)2][PF6] complexes demonstrated that donor solvents such as MeCN and DMF lower the Cu+/Cu2+ potential because of solvent participation to give 5-coordinate copper(II) complexes.48 For [Cu(dmp)2][PF6], Eox1/2 shifts from 0.43 V in CH2Cl2 to 0.15 V in DMF (versus Fc/Fc+ with [nBu4N][PF6] as supporting electrolyte).48 An independent measurement gives Eox1/2 = 0.50 V for [Cu(dmp)2][PF6] in CH2Cl2 and 0.27 V in MeCN (versus Fc/Fc+ with [nBu4N][PF6] as supporting electrolyte).49 We have previously reported Eox1/2 for [Cu(1)2][PF6] as 0.17 V in MeCN (versus Fc/Fc+);28 in CH2Cl2, a reversible process at Eox1/2 = +0.44 V is observed. This shift to higher potential is consistent with the solvent dependence of [Cu(dmp)2][PF6].48,49 The cyclic voltammogram (CV) of [Cu(1)2][PF6] was referenced internally by adding ferrocene at the end of the experiment. A reversible oxidation process was observed in the CV of [Cu(2)2][PF6] in CH2Cl2. However, when ferrocene was added as an internal reference, a reversible Fc/Fc+ wave was observed at an uncharacteristically low potential; the reason for this may lie in electron transfer between Cu2+ and Cp2Fe.50,51 A value of Eox1/2 = +0.72 V for [Cu(2)2][PF6] (Fig. 4) was determined using an external Fc/Fc+ reference. The replacement of four Me by CF3 groups results in the expected higher potential for Cu+ oxidation, and is consistent with the trend on going from [Cu(dmp)2][PF6] to [Cu(bfp)2][PF6] (see Scheme 1); for the latter, a value of Eox1/2 = +1.55 V is reported versus SCE,30 ≈1.17 V versus Fc/Fc+ using the conversion of Pavlishchuk and Addison.52 No well resolved reduction processes were observed for [Cu(2)2][PF6] within the solvent-accessible window (Fig. 4).
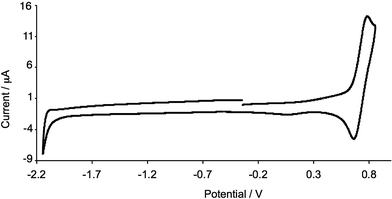 | ||
| Fig. 4 Cyclic voltammogram of [Cu(3)2][PF6] in CH2Cl2 (referenced externally to Fc/Fc+). Scan rate = 300 mV s−1; Pt working electrode. | ||
Crystal structure of [Cu(2)2][PF6]
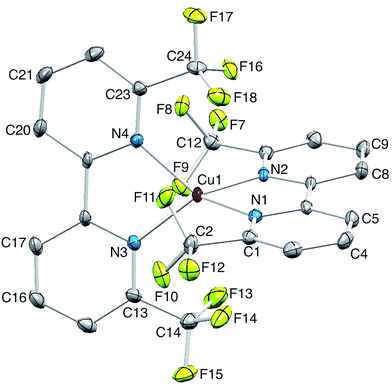
Single crystals of [Cu(2)2][PF6] were grown from CH2Cl2 by diffusion of Et2O, and the structure of the [Cu(2)2]+ cation is shown in Fig. 5. The copper(I) atom adopts the expected tetrahedral coordination environment with two chelating ligands 2, and bond parameters for the coordination sphere are listed in the caption to Fig. 5. One bpy domain is planar (angle between the least squares planes through the rings containing N1 and N2 = 1.0°) while the second ligand is twisted (angle between the planes through the rings with N3 and N24 = 9.0°) leading to a small helical twist (Fig. 6a) that renders the cation chiral. The chirality is defined in terms of the orientation of the CF3 groups containing atoms C12 and C24; one lies above and one below the least squares plane of the bpy unit to which they are bonded. The complex crystallizes in the non-centrosymmetric space group P212121 and we propose that the steric demands of the CF3 groups (Fig. 6b) prevent racemization in the solid state. Significantly, [Cu(bfp)2][BF4] and [Cu(bfp)2][PF6]30 (see Scheme 1) also crystallize in the space group P212121. As discussed by Kovalevsky et al. for [Cu(bfp)2]+ in which the phen domains are close to orthogonal,31 the steric requirements of the CF3 groups prevent significant flattening of the tetrahedral coordination sphere in [Cu(2)2]+. The angle between the least squares planes through the two bpy domains in [Cu(2)2]+ is 84.1°, compared to 74.3° in [Cu(1)2][PF6].28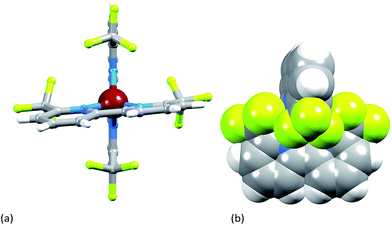 | ||
| Fig. 6 (a) View of the [Cu(2)2]+ cation showing helical twist in one ligand; (b) space-filling diagram illustrating the shielding of the Cu1 atom by the four CF3 groups. | ||
Ligand exchange between [Cu(1)2]+ and [Cu(2)2]+
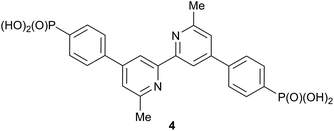
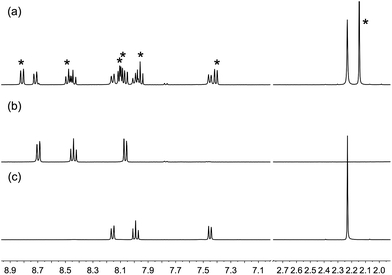
On-surface assembly of the copper(I) dyes [Cu(4)(2)]+ and [Cu(4)(3)]+ (see below) depends upon ligand exchange between surface-bound 4 with 6,6′-dimethyl substituents (Scheme 4) and the homoleptic complexes [Cu(2)2]+ and [Cu(3)2]+. To verify that the steric demands of the CF3 groups did not impede this exchange, 1H and 19F NMR spectroscopies were used to monitor a CH2Cl2 solution containing [Cu(1)2][PF6] and [Cu(2)2][PF6]; ligands 1 and 2 contain a 6,6′-dimethyl and 6,6′-bis(trifluoromethyl) substitution pattern, respectively. In Fig. 7, the 1H NMR spectra of [Cu(1)2][PF6] and [Cu(2)2][PF6] are compared with the spectrum of a solution containing equimolar amounts of both compounds 15 minutes after mixing. The data confirm that ligand exchange occurs rapidly. The relative integrals of the signals for HMe(homoleptic)![[thin space (1/6-em)]](https://www.rsc.org/images/entities/char_2009.gif) :
:![[thin space (1/6-em)]](https://www.rsc.org/images/entities/char_2009.gif) HMe(heteroleptic) are 1.00
HMe(heteroleptic) are 1.00![[thin space (1/6-em)]](https://www.rsc.org/images/entities/char_2009.gif) :
:![[thin space (1/6-em)]](https://www.rsc.org/images/entities/char_2009.gif) 1.06, i.e. essentially a statistical mixture of homo- and heteroleptic complexes. The 19F NMR spectrum of the mixture showed two resonances at δ −68.2 and −68.6 ppm arising from [Cu(2)2]+ and [Cu(1)(2)]+, respectively, in addition to a doublet at δ −73.3 ppm from the [PF6]− ion (Fig. S2†).
1.06, i.e. essentially a statistical mixture of homo- and heteroleptic complexes. The 19F NMR spectrum of the mixture showed two resonances at δ −68.2 and −68.6 ppm arising from [Cu(2)2]+ and [Cu(1)(2)]+, respectively, in addition to a doublet at δ −73.3 ppm from the [PF6]− ion (Fig. S2†).
Dye adsorption and DSC performances
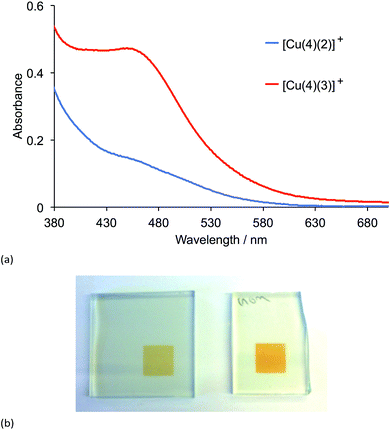
Transparent electrodes with adsorbed dyes were prepared by dipping the electrodes first in a solution of anchoring ligand 4 (Scheme 4) followed by a solution of either [Cu(2)2][PF6] or [Cu(3)2][PF6]. The soaking times and solvents were the same as those used for preparing the photoanodes for the DSCs (see Experimental section). After the electrodes had been dried, their solid-state absorption spectra (transmission mode) were recorded (Fig. 8a). The MLCT band for both adsorbed dyes [Cu(4)(2)][PF6] and [Cu(4)(3)][PF6] appears at ≈455 nm, but the relative intensities of the MLCT bands indicate that dye coverage for [Cu(4)(3)][PF6] is greater than for [Cu(4)(2)][PF6]. This difference was reproducible for a second set of electrodes soaked in the dye baths under the same conditions as the first set, and can also be seen by eye (Fig. 8b). The 0.1 mM CH2Cl2 solutions of [Cu(2)2][PF6] and [Cu(3)2][PF6] used in the second dye bath appear by eye to have the same yellow-orange colour and the same intensity of colour.The dye-functionalized photoanodes for the DSCs were prepared by sequentially soaking the electrodes in solutions of anchoring ligand 4 followed by either [Cu(2)2][PF6] or [Cu(3)2][PF6]. The process was the same as for the assembly of surface-bound [Cu(4)(1)]+ previously reported.29 Duplicate cells were prepared for each dye and the cell characteristics are shown in Table 2; the data are compared to those of cells containing [Cu(4)(1)]+ and to a reference cell containing N719. All cells were fully masked to prevent overestimation of their performances.40,41 Although efficiency values, η, are typically quoted in the literature, we now routinely also include values relative to N719 measured under the same conditions (last column of Table 2). This is a convenient and valid means to compare measurements made in different laboratories, with different coworkers and with different commercial sun simulators.29 The reproducibility of the DSCs containing N719 between cells fabricated previously29 and in this work (Table 2) serves to validate the results for the copper(I) dyes in both investigations.
| Dye | J SC/mA cm−2 | V OC/mV | ff/% | η/% | Relativea η/% |
|---|---|---|---|---|---|
| a Relative to N719 efficiency set at 100%. b Data from ref. 29. c N719 reference for the current study. d N719 reference for the previous study.29 | |||||
| On the day of sealing the cells | |||||
| [Cu(4)(2)]+ | 4.81 | 537 | 73.5 | 1.90 | 31.8 |
| [Cu(4)(2)]+ | 4.67 | 531 | 71.5 | 1.78 | 30.0 |
| [Cu(4)(3)]+ | 5.35 | 530 | 73.4 | 2.08 | 34.8 |
| [Cu(4)(3)]+ | 5.40 | 532 | 70.3 | 2.02 | 33.8 |
| N719c | 13.65 | 652 | 67.0 | 5.97 | 100 |
| [Cu(4)(1)]+ | 3.79 | 522 | 73.8 | 1.46 | 24.7b |
| [Cu(4)(1)]+ | 3.46 | 527 | 74.3 | 1.35 | 22.8b |
| N719d | 12.51 | 672 | 70.2 | 5.91 | 100 |
![[thin space (1/6-em)]](https://www.rsc.org/images/entities/char_2009.gif) |
|||||
| 1 day after sealing the cells | |||||
| [Cu(4)(2)]+ | 4.73 | 557 | 73.8 | 1.95 | 33.2 |
| [Cu(4)(2)]+ | 4.63 | 550 | 70.6 | 1.80 | 30.6 |
| [Cu(4)(3)]+ | 5.45 | 540 | 73.0 | 2.15 | 36.6 |
| [Cu(4)(3)]+ | 5.56 | 546 | 70.2 | 2.13 | 36.2 |
| N719c | 13.19 | 681 | 65.5 | 5.88 | 100 |
![[thin space (1/6-em)]](https://www.rsc.org/images/entities/char_2009.gif) |
|||||
| 3 days after sealing the cells | |||||
| [Cu(4)(2)]+ | 4.85 | 564 | 73.4 | 2.00 | 33.6 |
| [Cu(4)(2)]+ | 4.68 | 559 | 70.7 | 1.85 | 31.1 |
| [Cu(4)(3)]+ | 5.17 | 541 | 73.2 | 2.05 | 34.5 |
| [Cu(4)(3)]+ | 5.53 | 562 | 70.2 | 2.18 | 36.6 |
| N719c | 13.16 | 689 | 65.6 | 5.95 | 100 |
![[thin space (1/6-em)]](https://www.rsc.org/images/entities/char_2009.gif) |
|||||
| 8 days after sealing the cells | |||||
| [Cu(4)(2)]+ | 4.77 | 565 | 73.2 | 1.97 | 32.5 |
| [Cu(4)(2)]+ | 4.70 | 556 | 67.7 | 1.77 | 29.2 |
| [Cu(4)(3)]+ | 5.48 | 563 | 70.8 | 2.18 | 35.9 |
| [Cu(4)(3)]+ | 5.81 | 567 | 68.6 | 2.26 | 37.2 |
| N719c | 12.82 | 696 | 68.1 | 6.07 | 100 |
Firstly, we consider the parameters in Table 2 for the DSCs on the day of fabrication. Good fill factors (ff, ≈70–75%) for all the copper(I) dye-containing cells are observed. The short-circuit current density (JSC) and open-circuit voltage (VOC) values are validated by the reproducibility between each pair of duplicate cells (Fig. 9). The introduction of the fluoro-substituents on going from [Cu(4)(1)]+ to [Cu(4)(2)]+ or [Cu(4)(3)]+ results in a significant increase in JSC and a small increase in VOC. The enhanced JSC with introduction of fluoro-substituents is the opposite trend to that observed by Diau and coworkers26 upon fluorination of the aryl substituent in the ruthenium(II) dye shown in Scheme 5. Interestingly, the best performing of the copper(I) dyes are those with ligand 3 (one CF3) group, and this is consistent with the higher dye-loading for [Cu(4)(3)]+ with respect to [Cu(4)(2)]+ evidenced from the solid-state absorption spectra (Fig. 8a). All cells exhibit a photoconversion efficiency (η) of ≈30–34% relative to N719 set at 100%, which is a notable improvement with respect to DSCs containing [Cu(4)(1)]+ with no fluoro-groups (right column, Table 2).
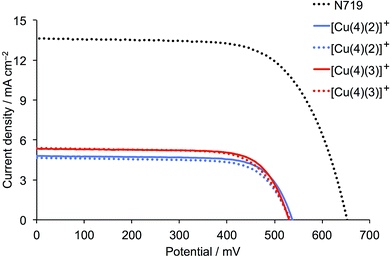 | ||
| Fig. 9 J–V curves for duplicate DSCs containing dyes [Cu(4)(2)]+ and [Cu(4)(3)]+ compared to reference dye N719. The parameters are for the day of sealing the DSCs (top of Table 2). | ||
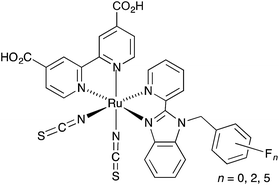 | ||
| Scheme 5 Ruthenium(II) dyes used by Diau to investigate the effects of fluoro-substitution on DSC performance.26 | ||
The cell parameters were measured several times over a period of 8 days after DSC fabrication (Table 2) and J–V curves for the best performing DSCs (Fig. 10) show a marked and similar improvement in VOC for the two dyes (537 to 565 mV for [Cu(4)(2)]+, and 532 to 567 mV for [Cu(4)(3)]+). The dye with one CF3 group also gains in JSC, and the resulting global efficiency is 37.2% relative to N719 set at 100%.
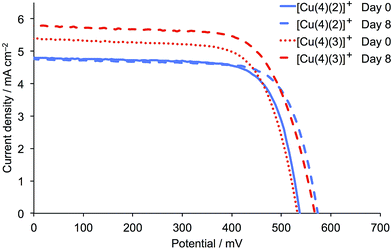 | ||
| Fig. 10 J–V curves for the best performing DSCs (from Table 2) containing the dyes [Cu(4)(2)]+ and [Cu(4)(3)]+ on the day of sealing the DSCs (day 0) and a week later. Colour and line coding on day 0 is consistent with Fig. 9. | ||
The external quantum efficiency (EQE) spectra for DSCs containing [Cu(4)(2)]+ and [Cu(4)(3)]+ are shown in Fig. 11, and a comparison of these spectra with the solid state UV-Vis spectra shown in Fig. 8 demonstrates the proportion of the absorbed light that is converted to electrical current. Both dyes exhibit a maximum EQE at 480 nm, with EQEmax values of 46% for [Cu(4)(2)]+ and 51% for [Cu(4)(3)]+. This compares with 69% at 480 nm for N719. An EQEmax of 51% is very pleasing for a copper(I) sensitizer, and is comparable to those reported for the record dye of Boujtita and Odobel,17 and for the iodo-substituted dye previously reported.21 However, it is clear from Fig. 11 that light-harvesting in the red-part of the spectrum remains deficient in [Cu(4)(2)]+ and [Cu(4)(3)]+.
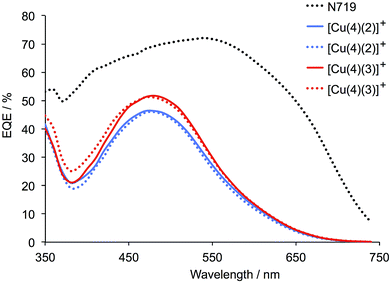 | ||
| Fig. 11 EQE spectra for duplicate DSCs containing dyes [Cu(4)(2)]+ and [Cu(4)(3)]+ compared to reference dye N719. The spectra were recorded on the day of sealing the DSCs. | ||
DFT calculations
Ground state density functional theory (DFT) calculations were carried out on [Cu(4)(1)]+,29 [Cu(4)(2)]+ and [Cu(4)(3)]+ to compare the orbital compositions of MOs in the HOMO–LUMO manifold. The choice of basis set was made following a more detailed investigation of the effects of different basis sets in related copper(I) complexes.28 We focus only on trends of the MO characters on introducing the fluoro-substituents.On going from [Cu(4)(1)]+ to [Cu(4)(2)]+ to [Cu(4)(3)]+, both the HOMO and LUMO are stabilized. This is consistent with the calculated trend on going from [Cu(dmp)2]+ to [Cu(bfp)2]+,33 and stabilization of the HOMO from [Cu(4)(1)]+ to [Cu(4)(2)]+ is consistent with the shift to more positive oxidation potential observed from [Cu(1)2]+ to [Cu(2)]+ (see above).
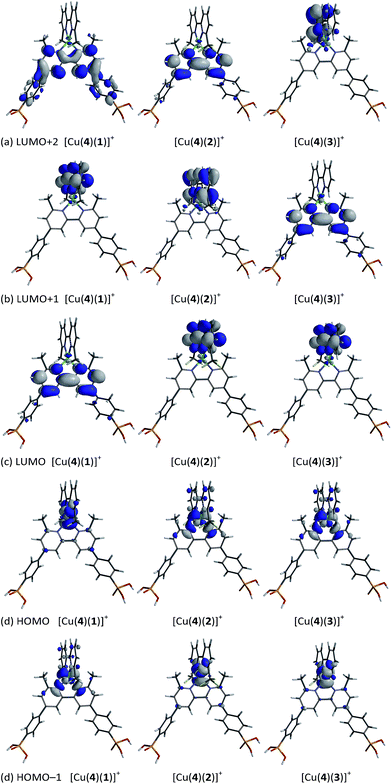
The compositions of the highest lying MOs and lowest lying virtual MOs in each of the heteroleptic complexes are depicted in Fig. 12. The HOMO and HOMO−1 are close in energy and, taken as a pair, their characters are similar in all three complexes. Both MOs are based on the copper with contributions from the ancillary ligand (HOMO in [Cu(4)(1)]+ or HOMO−1 in [Cu(4)(2)]+ and [Cu(4)(3)]+) or from both bpy domains (HOMO−1 in [Cu(4)(1)]+ or HOMO in [Cu(4)(2)]+ and [Cu(4)(3)]+). As previously reported,29 the LUMO of [Cu(4)(1)]+ is localized on anchoring ligand 4, as desired for accepting an electron in the excited state prior to injection into the semiconductor. As Fig. 12 shows, the characters of the three lowest lying unoccupied MOs in [Cu(4)(1)]+, [Cu(4)(2)]+ and [Cu(4)(3)]+ are bpy-based, either on the anchoring or ancillary ligand. Changes in the orbital compositions alone in the HOMO–LUMO manifold do not explain why dyes [Cu(4)(2)]+ and [Cu(4)(3)]+ perform better than [Cu(4)(1)]+. It is likely that the stabilization of the HOMO and LUMO which accompanies the introduction of the CF3 groups is key to the enhanced dye performance, and/or that electron recombination processes are hindered. We are currently undertaking an electrochemical impedance spectroscopic investigation of a range of copper(I) sensitizers in order to gain insight into relationships between 6,6′-substituted 2,2′-bipyridine ancillary ligands and trends in DSC performances.
Conclusions
The complexes [Cu(2)2][PF6] and [Cu(3)2][PF6] bearing trifluoromethyl substituents have been investigated, and the single crystal structure of [Cu(2)2][PF6] has been determined. The Cu+/Cu2+ redox couple shifts to higher potential (+0.44 to +0.72 V versus Fc/Fc+ in CH2Cl2) on replacing methyl groups in [Cu(1)2][PF6] by CF3 groups in [Cu(2)2][PF6]. 1H and 19F NMR spectra for a CH2Cl2 solution of [Cu(1)2][PF6] and [Cu(2)2][PF6] show that the ligands in [Cu(2)2][PF6] remain very labile. The copper(I) dyes [Cu(4)(2)]+ and [Cu(4)(3)]+ have been assembled on TiO2 electrodes using a stepwise on-surface method, and DSCs containing the fluorinated ancillary ligands exhibit excellent photoconversion efficiencies of ≈30–34% relative to N719 set at 100%; this is a noteworthy improvement with respect to DSCs containing [Cu(4)(1)]+, showing that fluoro-substitution is beneficial. Stabilization of the HOMO in the fluorinated-dyes is confirmed by DFT calculations; the compositions of the MOs in the HOMO–LUMO manifold are little changed. The improved DSC performances arise from improved JSC values for [Cu(4)(3)]+ and [Cu(4)(2)]+ versus [Cu(4)(1)]+, consistent with high EQEmax values of 46% for [Cu(4)(2)]+ and 51% for [Cu(4)(3)]+ (both at λmax = 480 nm).Abbreviations
| dmp | 2,9-Dimethyl-1,10-phenanthroline |
| bfp | 2,9-Bis(trifluoromethyl)-1,10-phenanthroline |
Acknowledgements
We thank the Swiss National Science Foundation (Grant number 200020_144500), the European Research Council (Advanced Grant 267816 LiLo) and the University of Basel for financial support. Professor Howard Flack is acknowledged for helpful discussion. PD Dr Daniel Häussinger is acknowledged for assistance with 19F NMR spectroscopy.Notes and references
- B. Bozic-Weber, E. C. Constable and C. E. Housecroft, Coord. Chem. Rev., 2013, 257, 3089 CrossRef CAS.
- M. S. Lazorski and F. N. Castellano, Polyhedron, 2014, 82, 57 CrossRef CAS.
- F. Dumur, Org. Electron., 2015, 21, 27 CrossRef CAS.
- D. Volz, M. Wallesch, C. Fléchon, M. Danz, A. Verma, J. M. Navarro, D. M. Zink, S. Bräse and T. Baumann, Green Chem., 2015, 17, 1988 RSC.
- R. D. Costa, E. Ortí, H. J. Bolink, F. Monti, G. Accorsi and N. Armaroli, Angew. Chem., Int. Ed., 2012, 51, 8178 CrossRef CAS PubMed.
- A. Yella, H.-W. Lee, H. N. Tsao, C. Yi, A. K. Chandiran, M. K. Nazeeruddin, E. W.-G. Diau, C.-Y. Yeh, S. M. Zakeeruddin and M. Grätzel, Science, 2011, 334, 629 CrossRef CAS PubMed; M. Zhang, Y. Wang, M. Xu, W. Ma, R. Li and P. Wang, Energy Environ. Sci., 2013, 6, 2944 Search PubMed; K. Kakiage, Y. Aoyama, T. Yano, T. Otsuka, T. Kyomen, M. Unno and M. Hanaya, Chem. Commun., 2014, 50, 6379 RSC; H. Ozawa, Y. Okuyama and H. Arakawa, ChemPhysChem, 2014, 15, 1201 CrossRef PubMed.
- G. C. Vougioukalakis, A. I. Philippopoulos, T. Stergiopoulos and P. Falaras, Coord. Chem. Rev., 2011, 255, 2602 CrossRef CAS.
- A. Alonso-Vante, J. F. Nierengarten and J. P. Sauvage, J. Chem. Soc., Dalton Trans., 1994, 1650 Search PubMed.
- S. Sakaki, T. Kuroki and T. Hamada, Dalton Trans., 2002, 840 RSC.
- T. Bessho, E. C. Constable, M. Graetzel, A. Hernandez Redondo, C. E. Housecroft, W. Kylberg, M. K. Nazeeruddin, M. Neuburger and S. Schaffner, Chem. Commun., 2008, 3717 RSC.
- E. C. Constable, A. Hernandez Redondo, C. E. Housecroft, M. Neuburger and S. Schaffner, Dalton Trans., 2009, 6634 RSC.
- See for example: Y.-J. Yuan, Z.-T. Yu, J.-Y. Zhang and Z.-G. Zou, Dalton Trans., 2012, 9594 RSC; A. Colombo, C. Dragonetti, D. Roberto, A. Valore, P. Biagini and F. Melchiorre, Inorg. Chim. Acta, 2013, 407, 204 CrossRef CAS; K. A. Wills, H. J. Mandujano-Ramírez, G. Merino, D. Mattia, T. Hewat, N. Robertson, G. Oskam, M. D. Jones, S. E. Lewis and P. J. Cameron, RSC Adv., 2013, 3, 23361 RSC.
- D. R. McMillin and K. M. McNett, Chem. Rev., 1998, 98, 1201 CrossRef PubMed.
- A. Hernandez Redondo, E. C. Constable and C. E. Housecroft, Chimia, 2009, 63, 205 CrossRef.
- M. Schmittel and A. Ganz, Chem. Commun., 1997, 999 RSC; M. Schmittel, H. Ammon, V. Kalsani, A. Wiegrefe and C. Michel, Chem. Commun., 2002, 2566 RSC.
- M. Sandroni, M. Kayanuma, A. Planchat, N. Szuwarski, E. Blart, Y. Pellegrin, C. Daniel, M. Boujtita and F. Odobel, Dalton Trans., 2013, 10818 RSC.
- M. Sandroni, L. Favereau, A. Planchat, H. Akdas-Kilig, N. Szuwarski, Y. Pellegrin, E. Blart, H. le Bozec, M. Boujtita and F. Odobel, J. Mater. Chem. A, 2014, 2, 9944 CAS.
- B. Bozic-Weber, E. C. Constable, C. E. Housecroft, P. Kopecky, M. Neuburger and J. A. Zampese, Dalton Trans., 2011, 12584 RSC.
- E. Schönhofer, B. Bozic-Weber, C. J. Martin, E. C. Constable, C. E. Housecroft and J. A. Zampese, Dyes Pigm., 2015, 115, 154 CrossRef.
- S. Y. Brauchli, F. J. Malzner, E. C. Constable and C. E. Housecroft, RSC Adv., 2014, 4, 62728 RSC.
- F. J. Malzner, S. Y. Brauchli, E. C. Constable, C. E. Housecroft and M. Neuburger, RSC Adv., 2014, 4, 48712 RSC.
- See for example: S.-L. Wu, H.-P. Lu, H.-T. Yu, S.-H. Chuang, C.-L. Chiu, C.-W. Lee, E. W.-G. Diau and C.-Y. Yeh, Energy Environ. Sci., 2010, 3, 949 CAS and references therein.
- B. Bozic-Weber, S. Y. Brauchli, E. C. Constable, S. O. Fürer, C. E. Housecroft and I. A. Wright, Phys. Chem. Chem. Phys., 2013, 15, 4500 RSC.
- S. Y. Brauchli, B. Bozic-Weber, E. C. Constable, N. Hostettler, C. E. Housecroft and J. Zampese, RSC Adv., 2014, 4, 34801 RSC.
- S. Y. Brauchli, E. C. Constable and C. E. Housecroft, Dyes Pigm., 2015, 113, 447 CrossRef CAS.
- W.-K. Huang, H.-P. Wu, P.-L. Lin, Y.-P. Lee and E. W.-G. Diau, J. Phys. Chem. Lett., 2012, 3, 1830 CrossRef CAS PubMed.
- G. Marzani, J. Durantini, D. Minudri, M. Gervaldo, L. Otero, F. Fungo, G. Pozzi, M. Cavazzini, S. Orlandi and S. Quici, J. Phys. Chem. C, 2012, 116, 21190 Search PubMed.
- B. Bozic-Weber, V. Chaurin, E. C. Constable, C. E. Housecroft, M. Meuwly, M. Neuburger, J. A. Rudd, E. Schönhofer and L. Siegfried, Dalton Trans., 2012, 14157 RSC.
- F. J. Malzner, S. Y. Brauchli, E. Schönhofer, E. C. Constable and C. E. Housecroft, Polyhedron, 2014, 82, 116 CrossRef CAS.
- M. T. Miller, P. K. Gantzel and T. B. Karpishin, Angew. Chem., Int. Ed., 1998, 37, 1556 CrossRef CAS.
- A. Y. Kovalevsky, M. Gembicky and P. Coppens, Inorg. Chem., 2004, 43, 8282 CrossRef CAS PubMed.
- X. Wang, W. Wang, M. Koyama, M. Kubo and A. Miyamoto, J. Photochem. Photobiol., A, 2006, 179, 149 CrossRef CAS.
- L.-Y. Zou, M.-S. Ma, Z.-L. Zhang, H. Li, Y.-X. Cheng and A.-M. Ren, Org. Electron., 2012, 13, 2627 CrossRef CAS.
- K. S. Chan and A. K.-S. Tse, Synth. Commun., 1993, 23, 1929 CrossRef CAS.
- G. J. Kubas, Inorg. Synth., 1979, 19, 90 CrossRef CAS.
- APEX2, version 2 User Manual, M86-E01078, Bruker Analytical X-ray Systems, Inc., Madison, WI, 2006 Search PubMed.
- P. W. Betteridge, J. P. Carruthers, R. I. Cooper, K. Prout and D. J. Watkin, J. Appl. Crystallogr., 2003, 36, 1487 CrossRef CAS.
- S. Ito, P. Chen, P. Comte, M. K. Nazeeruddin, P. Liska, P. Péchy and M. Grätzel, Prog. Photovoltaics, 2007, 15, 603 CAS.
- S. Ito, T. N. Murakami, P. Comte, P. Liska, C. Grätzel, M. K. Nazeeruddin and M. Grätzel, Thin Solid Films, 2008, 516, 4613 CrossRef CAS.
- H. J. Snaith, Energy Environ. Sci., 2012, 5, 6513 Search PubMed.
- H. J. Snaith, Nat. Photonics, 2012, 6, 337 CrossRef CAS.
- Spartan'14, Wavefunction, Inc., Irvine, CA 92612 Search PubMed.
- E. Negishi, Angew. Chem., Int. Ed., 2011, 50, 6738 CrossRef CAS PubMed.
- F. J. Malzner, S. Y. Brauchli, E. C. Constable, C. E. Housecroft and M. Neuburger, RSC Adv., 2014, 4, 48712 RSC.
- M. W. Mara, K. A. Fransted and L. X. Chen, Coord. Chem. Rev., 2015, 282–283, 2 CrossRef CAS and references therein.
- N. Armaroli, G. Accorsi, F. Cardinali and A. Listorti, Top. Curr. Chem., 2007, 280, 69 CrossRef CAS and references therein.
- R. M. Everly and D. R. McMillin, J. Phys. Chem., 1992, 95, 9071 CrossRef.
- M. Magni, A. Colombo, C. Dragonetti and P. Mussini, Electrochim. Acta, 2014, 141, 324 CrossRef CAS.
- M. K. Eggleston, D. R. McMillin, K. S. Koenig and A. J. Pallenberg, Inorg. Chem., 1997, 36, 172 CrossRef CAS.
- J. Irangu, M. J. Ferguson and R. B. Jordan, Inorg. Chem., 2005, 44, 1619 CrossRef CAS PubMed.
- S. Itoh, N. Kishikawa, T. Suzuki and H. D. Takagi, Dalton Trans., 2005, 1066 RSC.
- V. V. Pavlishchuk and A. W. Addison, Inorg. Chim. Acta, 2000, 298, 97 CrossRef CAS.
Footnote |
| † Electronic supplementary information (ESI) available: Fig. S1 19F NMR spectra of [Cu(2)2][PF6] and [Cu(3)2][PF6]. CCDC 1062412. For ESI and crystallographic data in CIF or other electronic format see DOI: 10.1039/c5ra09590e |
| This journal is © The Royal Society of Chemistry 2015 |

