Preparation and application of cobalt oxide nanostructures as electrode materials for electrochemical supercapacitors†
Faranak Manteghi*a,
Sayed Habib Kazemi*b,
Masoud Peyvandipoura and
Ahmad Asgharib
aDepartment of Chemistry, Iran University of Science and Technology, Tehran, Iran. E-mail: f_manteghi@iust.ac.ir
bDepartment of Chemistry, Institute for Advanced Studies in Basic Sciences (IASBS), Zanjan, 45137-66731, Iran. E-mail: habibkazemi@iasbs.ac.ir
First published on 3rd September 2015
Abstract
In a reaction between cobalt(II) and ammonium oxalate in the presence of CTAB or F-127 as surfactant to control the particle size, a cobalt oxalate complex was formed. The precipitate was calcined and the resulting nano cobalt oxide was characterized by Fourier Transform Infrared spectroscopy (FTIR), Scanning Electron Microscopy (SEM), Transmission Electron Microscopy (TEM) and X-ray Diffraction (XRD) methods. The crystalline pure and nano-sized particles had an average size of less than 40 nm. Electrochemical properties were examined by cyclic voltammetry, galvanostatic charge/discharge and electrochemical impedance spectroscopy. A maximum specific capacitance of 351 F g−1 was obtained at a scan rate of 0.85 A g−1 in 2 M of KOH solution for Co3O4@Ni foam electrode (Co3O4@NF). Furthermore, the electrode exhibits excellent cycle life stability, and almost 98.6% of its initial specific capacitance was maintained after 1000 cycle tests.
Introduction
Among the transition metal oxides, Co3O4 is found to be one of the most important materials in a wide range of applications in various fields such as electrochromic devices, ceramic pigments, heterogeneous catalysts, solid-state sensors, magnetism, solar energy absorbers, and energy storage, particularly in supercapacitors, because of its higher surface area, good redox properties, controllable size and shape, and structural characteristics.1–4 Electrochemical capacitors are becoming attractive energy storage systems, because they have higher power density and long cycle life stability compared to common batteries. Depending on the charge-storage mechanisms, supercapacitors are generally classified into two major types: carbon based electrical double-layer capacitor (EDLC) and faradaic capacitor.5–12 It was already reported that the size and morphology of Co3O4 extremely affect its electrochemical performance and therefore many researchers are attempting fabricate it in newer shapes and morphology in nanoscale dimensions. Different nanoscale morphologies such as hollow nanospheres, cubic single crystals, fibers, particles, rods, tubes and films in nano-scale have been reported so far.13–19 It is well known that Co3O4 crystallizes in the cubic normal spinel structure with magnetic Co2+ ions in tetrahedral sites and non-magnetic Co3+ ions in octahedral sites. Several other methods were used to synthesis the spinel Co3O4 nanoparticles such as sol–gel, polyol, solvothermal, polymer assisted methods and thermal decomposition.20–24 Additionally, hydrothermal method has been applied for Co3O4 nanostructures and cathodic electrodeposition has recently been used for Co3O4 nanostructures.5,23,25Organic ligands are widely applied in preparation of metallic complexes and in high temperatures, they burn and eliminate from the coordination sphere, thus remain only oxide material. Considering this issue, we report the synthesis of Co3O4 nanostructures by thermal decomposition of cobalt oxalate which was synthesized from co-precipitation of Co(NO3)2·6H2O or CoCl2·6H2O and (NH4)2C2O4 in the presence or absence of F-127 and CTAB as surfactants, while the molar ratio of ammonium oxalate to metal precursor was 1![[thin space (1/6-em)]](https://www.rsc.org/images/entities/char_2009.gif) :
:![[thin space (1/6-em)]](https://www.rsc.org/images/entities/char_2009.gif) 1. The obtained pink precipitate was finally calcined at 400 °C.
1. The obtained pink precipitate was finally calcined at 400 °C.
The structural properties of Co3O4 were investigated by Fourier Transform Infrared spectroscopy (FTIR), Scanning Electron Microscopy (SEM), X-Ray Diffraction (XRD) and Thermal Gravimetric Analysis (TGA). Experimental results revealed that Co3O4 nanoparticles can successfully form in good crystallinity with an average size of almost 38 nm. Electrochemical tests confirm that the prepared Co3O4 nanorods maintain remarkable performance in supercapacitor application.
Experimental
All materials purchased from MERCK were used without any further purification. An aqueous solution of Co(NO3)2·6H2O or CoCl2·6H2O was rapidly added to (NH4)2C2O4 solution with the molar ratio of 1![[thin space (1/6-em)]](https://www.rsc.org/images/entities/char_2009.gif) :
:![[thin space (1/6-em)]](https://www.rsc.org/images/entities/char_2009.gif) 1. To investigate the effect of the temperature and surfactant on morphology and size of Co3O4 particles, different conditions were applied. The cobalt oxalate precipitate was collected by filtration and washed with distilled water; finally Co3O4 was obtained by calcining the precipitates in air at 400 °C. The electrochemical properties and capacitance measurement of the supercapacitor electrodes were studied in a three-electrode system by cyclic voltammetry (CV) and electrochemical impedance spectroscopy (EIS) using a Compact Stat Galvanostat–Potentiostat (Ivium Technologies, Netherlands). The CV response of the electrodes was measured at different scan rates varying from 10 to 100 mV s−1. Voltammetry tests were carried out at potentials between −0.1 and 0.5 V in a 2 M of KOH solution. Impedance spectroscopy measurements were carried out by applying a sinusoidal signal of 5 mV on the open circuit potential as DC bias, in the frequency range of 100 kHz to 10 mHz.
1. To investigate the effect of the temperature and surfactant on morphology and size of Co3O4 particles, different conditions were applied. The cobalt oxalate precipitate was collected by filtration and washed with distilled water; finally Co3O4 was obtained by calcining the precipitates in air at 400 °C. The electrochemical properties and capacitance measurement of the supercapacitor electrodes were studied in a three-electrode system by cyclic voltammetry (CV) and electrochemical impedance spectroscopy (EIS) using a Compact Stat Galvanostat–Potentiostat (Ivium Technologies, Netherlands). The CV response of the electrodes was measured at different scan rates varying from 10 to 100 mV s−1. Voltammetry tests were carried out at potentials between −0.1 and 0.5 V in a 2 M of KOH solution. Impedance spectroscopy measurements were carried out by applying a sinusoidal signal of 5 mV on the open circuit potential as DC bias, in the frequency range of 100 kHz to 10 mHz.
Results and discussion
Characterization of Co3O4 electrode material
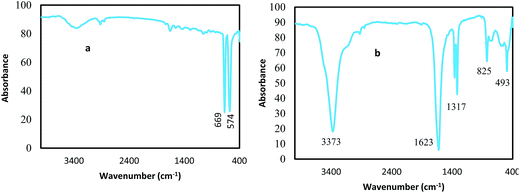
The TG/DTG/DSC measurements of cobalt oxalate as precursor were carried out to find the suitable temperature for calcination. In the TG/DTG/DSC profiles of cobalt oxalate shown in Fig. 1a and b, a mass loss rate of 18.47% can be observed from 148 to 200 °C on the TG curve, which corresponds to a broad endothermic peak at around 190 °C on the DTG–DSC curve. This is due to the dehydration of chemically bonded water molecules in the cobalt oxalate complex. The second mass loss and the corresponding sharp exothermic peak occur at around 293 °C, indicating the decomposition and oxidation reaction of the complex, results in the formation of cobalt oxide, shown in Fig. 1a and b.Using the FTIR technique, cobalt oxide and its precursor (cobalt oxalate complex) were characterized (shown in Fig. 2). As seen in Fig. 2, a broad band at 3373 cm−1 is assigned to both symmetric and asymmetric (O–H) vibrations in crystal water molecules ((O–H)s and (O–H)as). An intense band at 1623 cm−1 is assigned to (C–O)as vibration, two closely spaced bands at 1359–1317 cm−1 to (C–O)s vibration and the band at 825 cm−1 to the δ(OCO) vibration, indicates the presence of bridging oxalate groups.26 The band at 493 cm−1 may be attributed to Co–O stretching modes in the complex.26,27 The Co3O4 was obtained by calcining the precipitates in air at 400 °C. The IR spectrum of cobalt oxide has two major peaks at 574 and 669 cm−1 corresponding to metal–oxygen (Co–O) vibrational modes of the spinel compound.27
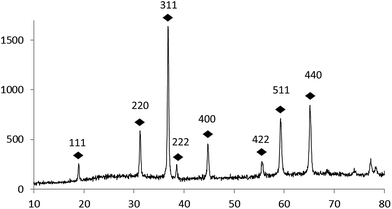
Fig. 3 shows the representative XRD pattern of prepared Co3O4. All reflection peaks can be readily indexed as cubic phase of Co3O4 (space group Fd3m) which is consistent with the value given in the standard card (ASTM no. 01-073-1701) and literature.25,28 No other impurities were detected in the XRD pattern, indicating the high purity of the product.
Effects of temperature and surfactant on the morphology of Co3O4
The morphologies of nine prepared Co3O4 nanostructures obtained from cobalt oxalate prepared under different temperature conditions in the presence or absence of surfactants are shown in Fig. 4 and 5. In Fig. 4, with nitrate as a counter ion of cobalt, it can be seen that by increasing the temperature from 25 to 40 °C, the size of the particles is become smaller but more increasing the temperature up to 80 °C forces the particles to agglomerate. Comparing the presence and absence of CTAB (Fig. 4a and d) shows that the surfactant causes the particles to be smaller. In Fig. 5, with chloride as the anion of cobalt salt, it can be observed that by increasing the temperature to 40 °C, the particles become finer (Fig. 5a and b), but reaching to 80 °C causes them to cling together (Fig. 5c). Interestingly, the separations between particles can be seen in Fig. 5b. Applying two surfactants, CTAB and F-127, causes the particles become much smaller (Fig. 5d and e). It can be observed in all nine figures that the morphology is not seriously changed, but the sizes of particles are influenced by temperature and surfactant. Therefore, we conclude that using CTAB and F-127, and cobalt chloride in preparing cobalt oxalate precursor, force the oxide particles to become smaller nanostructures, as shown in Fig. 5d and e. These two structures maintain higher surface area and shorter diffusion length for electrolyte ions, thus revealed the best specific capacitance in the present work. | ||
| Fig. 4 The SEM images of Co3O4 nanostructures synthesized in (a) 25 °C, (b) 40 °C, (c) 80 °C, and (d) CTAB in 25 °C, all with cobalt nitrate precursor. The scale bars of the figures are all 200 nm. | ||
The TEM image given in Fig. 6 illustrates the size and morphology of porous Co3O4 nanostructures. It can be seen in Fig. 4–6 that the nanostructures are consisted of nanoparticles smaller than 40 nm.
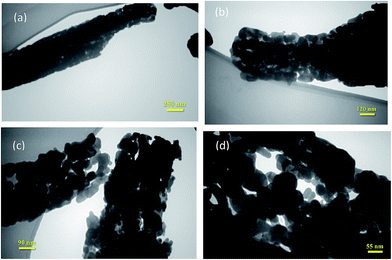 | ||
| Fig. 6 The TEM images of Co3O4 nanostructure, the scale bars are (a) 250 nm, (b) 120 nm, (c) 90 nm and (d) 55 nm. | ||
Moreover, to study the pore structural and the specific surface area of Co3O4 nanostructures fabricated in this work, Brunauer–Emmett–Teller (BET) gas-sorption measurement is carried out. Nitrogen adsorption–desorption isotherm of the Co3O4–F-127 sample (due to its higher capacitance found in electrochemical tests) shown in Fig. S-1 (provided as ESI†), and the corresponding Barrett–Joyner–Halenda (BJH) pore size distribution plot is illustrated in Fig. S-2 (provided as ESI†). The N2 adsorption and desorption experiment of the Co3O4–F-127 sample shows a typical type IV isotherm, proposes the microporous structure. When the relative pressure (P/P0) is higher than 0.95, a small increase appears, suggesting the presence of secondary porous structure formed by aggregation of nanostructures. The BET specific surface area of the sample is measured to be 24.5 m2 g−1. Also, the average pore diameter was 17.22 nm, according to the BJH plot (Fig. S-2†).
Electrochemical studies of Co3O4@NF electrode
The charge/discharge curves of both electrodes in the potential range of −0.1 to +0.45 V (vs. Ag/AgCl) at a current density of 1.7 A g−1 are compared in Fig. 7. The specific capacitance can be calculated according to the following equation:3,29
 | (1) |
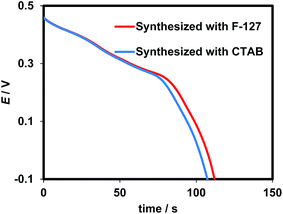 | ||
| Fig. 7 (a) Discharge curves of cobalt oxide synthesized from cobalt chloride in the presence of F-127 and CTAB surfactants. | ||
The excellent capacitive performance of Co3O4@NF was also verified from its voltammograms at various scan rates in a 2 M of KOH solution (Fig. 8). A pair of redox peaks appeared in the corresponding voltammograms; indicates the important contribution of pseudocapacitive mechanism in the specific capacitance of Co3O4@Ni foam. The faradaic capacitive behavior is originated from the following redox reaction of Co3O4:30,31
The first redox couple at 0.39 V can be attributed to the conversion between Co3O4 and CoOOH:
| Co3O4 + OH− + H2O ⇌ 3CoOOH + e− | (2) |
Also, the second redox couple at 0.44 V corresponds to the nearly reversible reaction between CoOOH and CoO2, represented by the following reaction:
| CoOOH + OH− ⇌ CoO2 + H2O + e− | (3) |
It should be noticed that by increasing the potential scan rate the anodic peaks can overlap and we will see an overlapped broad peak.
Fig. 9 depicts galvanostatic discharge curves and specific capacitances against discharge current densities (Fig. 9a and b, respectively). As seen, iR drop value for all curves in Fig. 9a is insignificant. Also, the specific capacitance shows a slight decrease with increasing the current density. Such a slight decrease may attribute to excellent availability of active sites of electrode material even at high current densities. It should be noted that there almost 90% of initial capacitance of the electrode (351 F g−1 at current density of 0.85 A g−1) was maintained even at discharge current density as high as 35 A g−1, indicating the excellent high-rate capability.
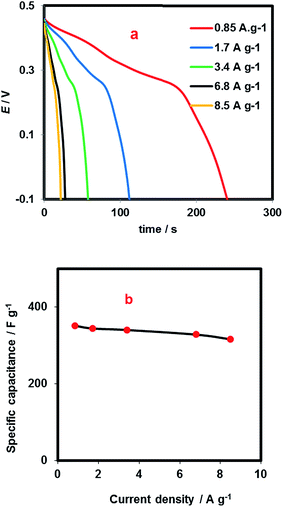 | ||
| Fig. 9 (a) Discharge curves at different current density, and (b) specific capacitance versus current density. | ||
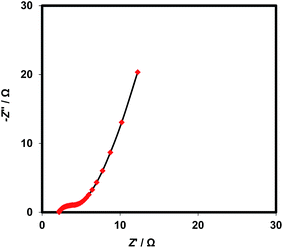
The Nyquist plots of Co3O4@NF electrode is illustrated as Fig. 10. As shown, a very low semicircle is located at high frequency domain; indicating a very low charge transfer resistance associated with Co3O4 redox reaction. The internal resistance can be estimated by extrapolating the plot to infinite frequencies. Internal resistance includes the ionic resistance of electrolyte, the intrinsic resistance of the active material, and the contact resistance at the interface of active material and current collector. Furthermore, the tilted semi-straight line at low frequency domain attributes to the diffusion impedance resulting from the mass transfer resistance in the system.3,32 The pattern of the EIS was fitted to an equivalent circuit shown as Scheme 1, in which the charge transfer resistance of faradaic reaction of cobalt oxide (Rct) is in series with diffusion impedance (Warburg impendence, W). Also, the interfacial double layer capacitance is shown by a constant phase element (CPE). The fitting results were 2.15 Ω, 2.85 Ω, and 0.33 F cm−2 for electrochemical series resistance (ESR), Rct and double layer capacitance, respectively. Additionally, the depression factor of CPE was estimated as 0.85. As seen from Fig. 9, angle of the straight line at low frequency domain is more than 70° (71.5° according to the fitting procedure), confirming the relatively ideal capacitive behavior of the Co3O4@NF electrode material.
 | ||
| Scheme 1 Equivalent circuit used to fitting the EIS experimental results (CPE used instead of Cdl for interfacial capacitor, also W represents the diffusion impedance or Warburg element). | ||
Fig. 11 represents the electrochemical stability of Co3O4@NF examined by charge/discharge cycling at a current density of 0.85 A g−1. The Co3O4@NF electrode revealed the cycle life stability of more than 98% of its initial specific capacitance after 1000 successive cycles. Such a remarkable stability suggests the Co3O4@NF electrode as novel electrode materials for high performance supercapacitors.
It seems that using surfactants in this work was effective in a higher specific capacitance. It can be compared with the similar works, for example Co3O4 prepared (a) with the same salts without template and (b) with CoCl2 and urea without any template having maximum specific capacitance of 202.5 F g−1 and 280.5 F g−1, respectively.1,25
Conclusion
Nanostructures of Co3O4 in the cubic spinel structure with different sizes were fabricated from cobalt oxalate at different temperatures in the absence and presence of two surfactants. Electrochemical measurements revealed that the as-prepared material can deliver a maximum specific capacitance of 351 F g−1 and good stability over 1000 cycles. Furthermore, high specific capacitance was maintained at high charge/discharge current densities due to the unique structure and high surface area of the Co3O4@NF electrode. The BET specific surface area of the sample is measured to be 24.5 m2 g−1 and the average pore diameter was 17.22 nm, according to the BJH plot. The excellent electrochemical performance coupled with the low cost and simple preparation process suggests Co3O4 nanostructures as promising material for practical application in high-rate capable supercapacitors. Of note, the maximum specific capacitance was obtained for the finest cobalt oxide sample prepared in the presence of surfactant F-127 as high as 351 F g−1.Acknowledgements
Financial supports of this work by Institute for Advanced Research in Basic Sciences and Iran University of Science and Technology are appreciated. S. H. Kazemi also appreciates for the partially support of the work by Iran National Science Foundation (Grant number: INSF-93012781).References
- D. Wang, Q. Wang and T. Wang, Inorg. Chem., 2011, 50, 6482–6492 CrossRef CAS PubMed.
- X. Liu, Q. Long, C. Jiang, B. Zhan, C. Li, S. Liu, Q. Zhao, W. Huang and X. Dong, Nanoscale, 2013, 5, 6525–6529 RSC.
- S. H. Kazemi, B. Karimi, S. Abdollahi Aghdam, H. Behzadnia and M. A. Kiani, RSC Adv., 2015, 5, 69032–69041 RSC.
- H. B. Wu, H. Pang and X. W. Lou, Energy Environ. Sci., 2013, 6, 3619–3626 CAS.
- C. Xiang, M. Li, M. Zhi, A. Manivannan and N. Wu, J. Power Sources, 2013, 226, 65–70 CrossRef CAS PubMed.
- J. B. Wu, Y. Lin, X. H. Xia, J. Y. Xu and Q. Y. Shi, Electrochim. Acta, 2011, 56, 7163–7170 CrossRef CAS PubMed.
- H. Sayahi, M. A. Kiani and S. H. Kazemi, J. Solid State Electrochem., 2014, 18, 535–543 CrossRef CAS.
- A. Safavi, S. H. Kazemi and H. Kazemi, Electrochim. Acta, 2011, 56, 9191–9196 CAS.
- S. H. Kazemi, M. G. Maghami and M. A. Kiani, Mater. Res. Bull., 2014, 60, 137–142 CrossRef CAS PubMed.
- S. H. Kazemi, M. A. Kiani, R. Mohamadi and L. Eskandarian, Bull. Mater. Sci., 2014, 37, 1001–1006 CrossRef CAS.
- S. H. Kazemi, B. Karimi, A. Fashi, H. Behzadnia and H. Vali, J. Solid State Electrochem., 2014, 18, 2419–2424 CrossRef CAS.
- S. Habib Kazemi and A. Asghari, Mater. Lett., 2015, 142, 156–159 CrossRef CAS PubMed.
- R. Xu and H. C. Zeng, J. Phys. Chem. B, 2003, 107, 12643–12649 CrossRef CAS.
- X. Shi, S. Han, R. J. Sanedrin, C. Galvez, D. G. Ho, B. Hernandez, F. Zhou and M. Selke, Nano Lett., 2002, 2, 289–293 CrossRef CAS.
- S. A. Makhlouf, J. Magn. Magn. Mater., 2002, 246, 184–190 CrossRef CAS.
- Y. Liu, G. Wang, C. Xu and W. Wang, Chem. Commun., 2002, 1486–1487 RSC.
- B. B. Lakshmi, P. K. Dorhout and C. R. Martin, Chem. Mater., 1997, 9, 857–862 CrossRef CAS.
- A. Gulino, P. Dapporto, P. Rossi and I. Fragalà, Chem. Mater., 2003, 15, 3748–3752 CrossRef CAS.
- G. P. Anipsitakis, E. Stathatos and D. D. Dionysiou, J. Phys. Chem. B, 2005, 109, 13052–13055 CrossRef CAS PubMed.
- J. Park, X. Shen and G. Wang, Sens. Actuators, B, 2009, 136, 494–498 CrossRef CAS PubMed.
- A. Morsali, H. H. Monfared and A. Morsali, J. Mol. Struct., 2009, 938, 10–14 CrossRef CAS PubMed.
- P. Dutta, M. S. Seehra, S. Thota and J. Kumar, J. Phys.: Condens. Matter, 2008, 20, 015218 CrossRef.
- Y. Chen, Y. Zhang and S. Fu, Mater. Lett., 2007, 61, 701–705 CrossRef CAS PubMed.
- A.-M. Cao, J.-S. Hu, H.-P. Liang, W.-G. Song, L.-J. Wan, X.-L. He, X.-G. Gao and S.-H. Xia, J. Phys. Chem. B, 2006, 110, 15858–15863 CrossRef CAS PubMed.
- G. Wang, X. Shen, J. Horvat, B. Wang, H. Liu, D. Wexler and J. Yao, J. Phys. Chem. C, 2009, 113, 4357–4361 CAS.
- I. Luisetto, F. Pepe and E. Bemporad, J. Nanopart. Res., 2008, 10, 59–67 CrossRef CAS.
- K. Nakamoto, Infrared and Raman Spectra of Inorganic and Coordination Compounds, John Wiley & Sons, 6th edn, 2009 Search PubMed.
- H. Pang, F. Gao, Q. Chen, R. Liu and Q. Lu, Dalton Trans., 2012, 41, 5862–5868 RSC.
- S. G. Kandalkar, D. S. Dhawale, C.-K. Kim and C. D. Lokhande, Synth. Met., 2010, 160, 1299–1302 CrossRef CAS PubMed.
- C. Yuan, L. Yang, L. Hou, L. Shen, F. Zhang, D. Li and X. Zhang, J. Mater. Chem., 2011, 21, 18183–18185 RSC.
- H. Pang, J. Deng, J. Du, S. Li, J. Li, Y. Ma, J. Zhang and J. Chen, Dalton Trans., 2012, 41, 10175–10181 RSC.
- S. H. Kazemi, A. Asghari and M. A. Kiani, Electrochim. Acta, 2014, 138, 9–14 CrossRef CAS PubMed.
Footnote |
| † Electronic supplementary information (ESI) available. See DOI: 10.1039/c5ra09060a |
| This journal is © The Royal Society of Chemistry 2015 |


