A novel Fe3C/graphitic carbon composite with electromagnetic wave absorption properties in the C-band

Buhe Bateerab, Lei Wang*a, Lu Zhaoa, Peng Yua, Chungui Tiana, Kai Pana and Honggang Fu*a
aKey Laboratory of Functional Inorganic Material Chemistry, Ministry of Education of the People's Republic of China, Heilongjiang University, 74 Xuefu Road, Nangang District, Harbin 150080, P. R. China. E-mail: fuhg@vip.sina.com; wanglei0525@126.com
bCollege of Materials and Chemical Engineering, Heilongjiang Institute of Technology, 999 Hongqi Street, Xiangfang District, Harbin 150050, P. R. China

Received 9th May 2015 , Accepted 7th July 2015

First published on 7th July 2015


Abstract

An electromagnetic (EM) wave absorber with characteristic absorption in the millimeter wave range is very important for the EM industry. Especially, absorption properties in the microwave frequency range C-band (4–8 GHz) are necessary in the field of military aircraft. Herein, a Fe3C/graphitic carbon (Fe3C/GC) composite has been synthesized through a low-cost and facile ion-exchange route. The Fe3C/GC could exhibit excellent EM wave absorption properties in the C-band with the frequency range of 4–8 GHz and also exhibits good dielectric loss, which could be attributed to the existence of lightweight GC in the composite. The reflection loss value of the Fe3C/GC composite exceeds −10 dB in the frequency range of 4–8 GHz with an absorber thickness of 2–4 mm, implying its potential application as a lightweight EM wave absorber in the C-band region. Moreover, the Fe3C/GC composite shows better electromagnetic wave absorption properties than other iron compound GC-based composites, such as Fe2N/GC and Fe/GC.

Introduction

Electromagnetic (EM) absorbing materials have attracted attention because of their potential applications in the EM industry, such as for military aircraft, radar and wireless communications.1,2 Considerable investigations have focused on effective EM wave absorption materials with properties over a wide frequency range, strong absorption, low density and high resistivity.3 Metal oxides, such as Fe3O4,1 ZnO,4 MnO2,5 BaTiO3 (ref. 6) and TiO2,7 have been widely used in the EM wave absorbing area. Although they have the advantages of low cost, easy preparation and being non-toxic, their inefficient EM wave absorption properties restrain their further applications.8 In addition, magnetic particles and magnetic particles coated with a nonmagnetic insulator have attracted particular interest, such as Fe/Ni,9 carbonyl iron,10 FeCuNbSiB,11 hybrid structures of SiC/Co,12 Fe/Y2O3 (ref. 13) and Fe/ZnO.14 However, the high density and matching thick thickness of these materials limit their applications in practice.

Recently, lightweight carbon-based materials have exhibited significant value in the EM wave absorbing material due to their good conductive, chemical inertness and high temperature resistance.15,16 Among these, carbon-coated Ni or Fe nanocapsules are promising in the field of EM wave absorption.17 Moreover, carbon nanotubes (CNTs)–Fe (Co, Ni) composites have also been widely applied in EM wave-absorption area.18–20 However, most of the research works are focused on the frequency range of Ku-band (12.4–18 GHz) and S-band (2.0–4.0 GHz).21 It is still a challenge to obtain the materials which could exhibit good reflection loss with small matching thickness in C-band (4.0–8.0 GHz). The absorption properties in microwave frequency C-band are essential in many fields, including satellite, aerospace and civil use. Hence, it is necessary to exploit new lightweight materials with excellent EM wave absorption properties in the C-band.

In this work, the Fe3C/graphitic carbon (Fe3C/GC) composite has been synthesized by our previous large-scale and facile ion-exchanged route.22 The Fe3C/GC composite is investigated in terms of complex permittivity and permeability. Herein, it's the first time of the Fe3C/GC composite applied in EM wave absorption area, and the corresponding reflection loss value of the composite could exceed −10 dB in 4–8 GHz frequency range with the absorber thickness of 2–4 mm. We also compared the EM wave absorption properties of Fe3C/GC composite with other composites, including Fe2N/GC and Fe/GC.

Experimental

Synthesis

The Fe3C/GC composite was synthesized by our previous ion-exchanged route.22 In a typical synthesis, 0.12 mol L−1 FeCl2 solution was exchanged with 9 g polyacrylic weak-acid cation-exchanged resin (AC) under stirring at room temperature for 16 h. After centrifugation, washing and drying, the AC-Fe2+ precursor were formed. Finally, the precursor was heated at 800 °C for 1 h under nitrogen atmosphere with a heating rate of 5 °C min−1 to prepare Fe3C/GC composite. To investigate the wave-absorption performance of different iron-crystal, the Fe/GC composite was synthesized by carbonizing AC-Fe2+ precursor at 1100 °C under nitrogen ambient. Also, the Fe2N/GC composite was synthesized by pyrolysis the AC-Fe2+ precursor at 800 °C under the mixture of nitrogen and ammonia for comparison.

Characterizations

X-ray powder diffraction (XRD) patterns were obtained by a Rigaku D/max-IIIB diffractometer using Cu Ka radiation (λ = 1.5406 Å). The transmission electron microscopy (TEM) experiment was performed on a JEM-2100 electron microscope (JEOL, Japan) with an acceleration voltage of 200 kV. Carbon coated copper grids were used as the sample holders. Thermogravimetric analysis was performed on a TG (TA, Q600) thermal analyzer under air with a heating rate of 10 °C min−1. Fourier-transform infrared spectra (FTIR) of the samples were acquired with a PE Spectrum One BIR spectrometer. Magnetization was measured at 300 K in a physical properties measurement system (PPMS, Quantum Design Inc.) up to a field of (20 kOe).

The composite samples used for the measurement of relative permittivity (εr = ε′ + ′′) and permeability (μr = μ′ + ′′) were prepared by mixing the products and paraffin wax in a mass ratio of 7[thin space (1/6-em)]:[thin space (1/6-em)]3. The complex permittivity and permeability of the mixtures in a frequency range of 2 to 18 GHz were evaluated using an Agilent N5244A vector network analyzer. The reflection loss (RL) was calculated according to the following equations.

 
εr = ε′ + ′′ (1)
 
μr = μ′ + ′′ (2)
 
image file: c5ra08623j-t1.tif(3)
 
image file: c5ra08623j-t2.tif(4)
where f is the frequency of the EM wave, d is the thickness of the absorber, c is the velocity of light; Zin is the input impedance of the absorber.

Results and discussion

The synthetic process of the Fe3C/graphitic carbon (Fe3C/GC) composite is shown in Fig. 1. Firstly, the AC resin exchanged with Fe2+ ions to form AC-Fe2+ precursor. After carbonization, the Fe3C/GC could be obtained. TEM is a useful tool to characterize the morphology of nanostructures. As shown in Fig. 2a, the synthetic Fe3C/GC composite is composed of Fe3C nanoparticles with the diameter between 50 and 200 nm dispersed on graphitic carbon surface. The dark spherical particles are attributed to the Fe3C phase. The magnified image in Fig. 2b further indicates the graphitic carbon in the composite existed in the form of nanosheets and nanobelts. It is better to observe the structure on a high resolution and Fourier transform (FT) images (Fig. 2c and d). The interlayer spacings of 0.21 and 0.34 nm are ascribed to the planes of Fe3C(211) and C(002), respectively.
image file: c5ra08623j-f1.tif
Fig. 1 The synthetic process of Fe3C/GC composite.

image file: c5ra08623j-f2.tif
Fig. 2 (a and b) TEM and (c) HRTEM images of Fe3C/GC composite. (d) The Fourier transform (FT) image of (c).

The XRD pattern of the Fe3C/GC composite shows in Fig. 3a. The obvious diffraction peak at 2θ = 26.4° is assigned to the (002) plane of graphitic carbon (JCPDS no. 41-1487). The other diffraction peaks at around 2θ = 37.8°, 39.9°, 40.7°, 42.9°, 43.7°, 44.6°, 45.1°, 46.0°, 48.7° and 49.1° are attributed to the (210), (002), (201), (211), (102), (220), (031), (112), (131), and (221) planes of Fe3C phase (JCPDS no. 89-2867), respectively. As compared, the composite with different iron phase was also synthesized, namely Fe/GC and Fe2N/GC composites (see Experiment section). As shown in Fig. 3b and c, it can be seen that the Fe/GC and Fe2N/GC are composed of α-Fe and graphitic carbon, Fe2N and graphitic carbon, respectively. Raman was used to further investigate the carbon phase in composite (Fig. S1, ESI). The Raman spectra of all the composites are characterized by three main featured peaks, namely 1366 (D-band), 1580 (G-band) and 2730 cm−1 (2D-band). The D-band is ascribed to the vibrations of carbon atoms with dangling bonds in disordered graphite planes and the defects incorporated into pentagon and heptagon graphite-like structures, while the G-band is attributed to the stretching modes of carbon sp2 bonds of the graphite (E2g mode). The G peak is much higher in intensity and narrower in width compared to the D peak, implying the well crystalline of the graphitic carbon in the composites. The second-order 2D-band is typical of graphitic carbon. Moreover, the intensity ratio between G-band and D band (IG/ID) is proportional to the graphitization degree of carbon. IG/ID values for Fe3C/GC, Fe/GC and Fe2N/GC are about 3.52, 3.61 and 4.01, respectively, also indicating the well crystalline of the graphitic carbon in the synthetic composites.


image file: c5ra08623j-f3.tif
Fig. 3 XRD patterns of (a) Fe3C/GC, (b) Fe/GC and (c) Fe2N/GC composites.

The magnetization curves of the synthetic composites were investigated at 300 K and 20 kOe (Fig. S2, ESI). The saturation magnetization and coercivity of the Fe3C/GC composite are about 17.72 and 0.5 emu g−1, respectively. The Fe3C/GC composite displays a very low coercivity of 100 Oe at room temperature and 20 kOe. The negligible coercivity and remanence demonstrate a superparamagnetic behavior of the Fe3C/GC composite. The hysteresis loops for Fe/GC and Fe2N/GC composites display zero coercivity with no remanence, indicating the superparamagnetic behaviour of the samples. The saturation magnetization of Fe3C/GC, Fe2N/GC and Fe/GC composites are about 17.72, 40.30 and 54.19 emu g−1, respectively.

To calculate the GC content of the three composites, TGA analyses under air have been performed in the revised manuscript (Fig. S3 and Table S1). The GC content in Fe3C/GC, Fe2N/GC and Fe/GC composites are about 40.3 wt%, 38.1 wt% and 44.1 wt%, respectively, indicating the similar GC content in the three composites.

Graphitic carbon (GC) is a typical microwave absorbing material for dielectric loss, so the magnetic nanoparticles/GC composite has dual-loss characteristics. Moreover, the existence of GC in the magnetic composite greatly effect on the electronic and magnetic properties of materials. Therefore, the magnetic nanoparticles/GC composite may exhibit good EM absorption properties. To understand the possible microwave absorption mechanism, the real (ε′) and imaginary part (ε′′) of the relative permittivity for the composites were investigated in the frequency range of 2–18 GHz. As shown in Fig. 4a and b, the real (ε′) and imaginary (ε′′) part of the relative permittivity of the Fe3C/GC composite exhibits a decrease tendency in the frequency range of 2–18 GHz with a small fluctuation. However, the ε′ value of Fe2N/GC composite is increase in the frequency range of 3–6.5 GHz, the ε′′ value of Fe2N/GC and Fe3C/GC composite exhibits an increase tendency in the frequency range of 3–6.5 GHz. According to the free electron theory,23 ε′′ = 1/2πε0ρf, where ρ is the resistivity. The low ε′′ value indicates a higher electric resistivity, which is attributed to the magnetic Fe3C nanoparticles coated by GC in the composite. The ε′′ value of the Fe3C/GC composite in the range of 2 to 18 GHz is close to the reported carbon/ferrite composites24 and (Fe, Ni)/C nanocapsules,25 suggesting that the synthetic Fe3C/GC composite exhibits strong dielectric loss against EM wave. Although the resistivity of the bulk graphite is about 7.5 × 10⁻⁶ Ω m, which is close to that of metallic magnets (10−6 to 10−8 Ω m),26 it is expected that the electrical resistivity may increase owing to the curving graphite shells with a thickness of several nanometers exhibits the special microstructure and defect properties.27 Different magnetic materials may exhibit different dielectric loss performances. The magnetic Fe3C nanoparticles in the cavities of GC may increase the electric resistivity, and the protective graphite shell plays a role as an insulator in the composite. Compared with Fe2N/GC and Fe/GC composites, the relatively lower ε′′ values of the Fe3C/GC is attributed to the performance of Fe3C is different from that of Fe2N and Fe.


image file: c5ra08623j-f4.tif
Fig. 4 (a) Real and (b) imaginary parts of relative permittivity; (c) real and (d) imaginary parts of relative permeability for mixed paraffin wax with composite (weight fraction of 70%).

The frequency dependence of the real part (μ′) and imaginary part (μ′′) of relative permeability of the composites are shown in Fig. 4c and d. It can be seen that the μ′ value of Fe2N/GC and Fe/GC composites exhibit a decrease tendency in the frequency of 2–18 GHz with a small fluctuation. Only the μ′ value of the Fe3C/GC composite is significantly increase in the range of 8–11 GHz. The μ′′ values of the Fe2N/GC and Fe/GC composites are fluctuates around zero, whereas the minimum μ′′ value of Fe3C/GC composite appears at 9.2 GHz. The maximum value of μ′′ appeared at 3.6 GHz, implying the natural resonance occurred in the Fe3C/GC composite. It has been shown that the electromagnetic transformation is associated with the energy transfer between vectors of electric and magnetic fields, and further gives rise to the resonance behavior when their energy states satisfy the matching with the frequency of the electromagnetic wave. The negative values of the imaginary part indicate that the loss associated with the magnetic vector is even smaller than those needed for the permeability in medium, probably aroused by the radiation and/or transfer of energy.28 The natural resonance equation is as followed: 2πfr = γHa,29 where γ is the gyromagnetic ratio, Ha is the anisotropy field, and f is the resonance frequency. Therefore, the decrease of the relative permeability of Fe3C/GC composite is attributed to the lower magnetization value of Fe3C than that of Fe and the magnetic dilution of GC. In fact, the anisotropic energy of small-sized particles, especially in the nano-scale, could remarkably increase because of the surface anisotropic field affected by the small size effect.9

The eddy current loss phenomenon is related to thickness (d) and the electric conductivity (σ) of the composites, which can be expressed by the followed equation:30

μ′′(μ′)−2f−1 = 2πμ0d2σ
where μ0 is the vacuum permeability. Fig. 5 shows the calculated values of μ′′(μ′)−2f−1 changed with the frequency. Generally, the magnetic loss of material mainly originates from natural resonance, exchange resonance and eddy current loss in the microwave region. If the magnetic loss is mainly determined by eddy current loss, the value of μ′′(μ′)−2f−1 should be a constant. Based on the above, it can be concluded that the eddy current loss doesn't play a dominant role in the magnetic loss of the present composites. The low value of μ′′(μ′)−2f−1 is attributed to the GC as a separator for suppressing the eddy current loss.20


image file: c5ra08623j-f5.tif
Fig. 5 Values of μ′′(μ′)−2f−1 for the composites vs. frequency.

There are two possible contributions for microwave absorption, namely, dielectric loss (tan[thin space (1/6-em)]δε = ε′′/ε′) and magnetic loss (tan[thin space (1/6-em)]δμ = μ′′/μ′). The dielectric loss tangent values of the three composites are different as shown in Fig. 6a. The dielectric loss tangent value of Fe2N/GC composite is decreased in the frequency range of 2–6.5 GHz, and the loss tangent value of Fe3C/GC composite appears a characteristic peak at 9 GHz. However, the value of Fe/GC composite has no obvious change in the frequency range of 2–18 GHz.


image file: c5ra08623j-f6.tif
Fig. 6 (a) Dielectric loss tangents and (b) magnetic loss tangents of mixed paraffin wax with composite for weight fraction of 70%.

The maximum magnetic loss tangent (tan[thin space (1/6-em)]δμ = μ′′/μ′) value of Fe3C/GC is about 0.03, which is similar to the Fe/GC of 0.05 and Fe2N/GC of 0.10 (see Fig. 6b). However, all the three composites appear negative values of magnetic loss tangent at 2–18 GHz, which indicates the microwave absorption brings no magnetic loss. The results demonstrate that the dielectric loss plays a dominant role in the three composites. Therefore, the EM attenuation mechanism of the three composites is mainly dependent on the dielectric loss, which is different from the previous reports about the magnetic loss has been regarded as the reason of the main loss.12–14 The magnetic loss tangent (tan[thin space (1/6-em)]δμ = μ′′/μ′) value of Fe3C/GC is −0.33 at 9.2 GHz, indicating no magnetic loss contribution to the microwave absorption. However, the maximum dielectric loss tangent value of Fe3C/GC composite is 0.7 at 9.2 GHz, which endows the Fe3C/GC composite an outstanding microwave absorption property.

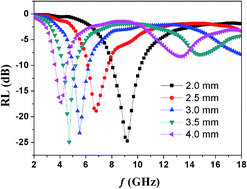
Fig. 7 shows the frequency dependence of reflection loss for the sample/paraffin wax composites in the frequency range of 2–18 GHz at different thickness. The three composites have excellent EM wave absorption properties in C-band (4–8 GHz). Especially, Fe3C/GC composite has the highest EM wave absorption properties. It can be observed that the minimum reflection loss of the Fe3C/GC composite is −26 dB at 9.2 GHz and the absorption range at −10 dB is from 8–10 GHz with a 2 mm thick layer. The frequency range is quite broader than that of the previously report for a single thickness.18 Additionally, the minimum reflection loss obviously shifts to the low frequency range with the increase of layer thickness, and the optimum reflection loss of the different thickness layers is concentrated in the low frequency region. The Fe3C/GC composite exhibits much better microwave absorption properties in C-band than the reported magnetic composites, including Fe/SmO,12 Fe/Y2O3,13 Fe/CNTs18 and CoFe2O4/CNTs.31


image file: c5ra08623j-f7.tif
Fig. 7 Reflection loss curves of composite at different thickness, consisting of mixed paraffin wax with composite for weight fraction of 70%. (a) Fe3C/GC (b) Fe2N/GC (c) Fe/GC.

The magnetic loss tangents of three composites are almost the same, but the corresponding reflection loss values are different, which is may be related to their different dielectric loss tangent caused by different electric resistivity. The Fe3C/GC composite has the most excellent EM wave absorption properties in C-band (4–8 GHz), indicate that the absorbing performance is determined by the matching degree between dielectric loss (tan[thin space (1/6-em)]δε = ε′′/ε′) tangent and magnetic loss tangent (tan[thin space (1/6-em)]δμ = μ′′/μ′). The excellent microwave absorption properties in C-band may be proper combination of the complex permeability and permittivity resulting from the composite of magnetic nanoparticles and GC.

Conclusions

The Fe3C/GC composite synthesized through a low-cost and scaled-up route exhibited better EM wave absorption properties in C-band (4–8 GHz) than that of the Fe2N/GC and Fe/GC composites. The minimum reflection loss of Fe3C/GC composite reaches −26 dB and its absorption range under −10 dB is between 4 to 8 GHz with a thickness layer of 2 mm. The excellent microwave absorption properties of Fe3C/GC composite could be attributed to the high dielectric loss of light weight graphitic carbon. The composite exhibited well performance of EM wave-absorption in C-band, which may have potential applications in military aircraft, radar and wireless communications.

Acknowledgements

We gratefully acknowledge the support of this research by the National Natural Science Foundation of China (21371053, 21401048, 21473051), the Cultivation Fund of the Key Scientific and Technical Innovation Project, Ministry of Education of China (708029), the China Postdoctoral Science Foundation (2014M551285), Postdoctoral Science Foundation of Heilongjiang Province (LBH-TZ0519), the Natural Science Foundation of Heilongjiang Province (QC2014C007), Heilongjiang University Youth Foundation (QL201303).

Notes and references

  1. P. Liu and Y. Huang, RSC Adv., 2013, 3, 19033 RSC.
  2. X. Shen, F. Song, X. Yang, Z. Wang, M. Jing and Y. Wang, J. Alloy Compd., 2015, 621, 146 CrossRef CAS PubMed.
  3. K. Jia, R. Zhao, J. C. Zhong and X. B. Liu, J. Magn. Magn. Mater., 2010, 332, 2167 CrossRef PubMed.
  4. R. Zhuo, Y. Wang, D. Yan, S. Li, Y. Liu and F. Wang, Mater. Lett., 2014, 117, 34 CrossRef CAS PubMed.
  5. M. Zhou, X. Zhang, J. M. Wei, S. Zhao, L. Wang and B. X. Feng, J. Phys. Chem. C, 2011, 115, 1398 CAS.
  6. J. Yang, J. Zhang, C. Liang, M. Wang, P. Zhao, M. Liu, J. Liu and R. Che, ACS Appl. Mater. Interfaces, 2013, 5, 7146 CAS.
  7. S. W. Phan, M. Tadokoro, J. Watanabe and N. Kuramoto, Curr. Appl. Phys., 2008, 8, 391 CrossRef PubMed.
  8. F. Meng, R. Zhao, Y. Zhan, Y. Lei, J. Zhong and X. Liu, Appl. Surf. Sci., 2011, 257, 5000 CrossRef CAS PubMed.
  9. S. J. Yan, S. L. Dai, H. Y. Ding, Z. Y. Wang and D. B. Liu, J. Magn. Magn. Mater., 2014, 358, 170 CrossRef PubMed.
  10. A. Wang, W. Wang, C. Long, W. Li, J. Guan, H. Gu and G. Xu, J. Mater. Chem. C, 2014, 2, 3769 RSC.
  11. L. Qiao, F. S. Wen, J. Q. Wei, J. B. Wang and F. S. Li, J. Appl. Phys., 2008, 103, 063903 CrossRef PubMed.
  12. H. Wang, L. Wu, J. Jiao, J. Zhou, Y. Xu, H. Zhang, Z. Jiang, B. Shen and Z. Wang, J. Mater. Chem. A, 2015, 3, 6517 CAS.
  13. J. R. Liu, M. Itoh and K. Machida, Chem. Lett., 2003, 32, 394 CrossRef CAS.
  14. X. G. Liu, D. Y. Geng, H. Meng, P. J. Shang and Z. D. Zhang, Appl. Phys. Lett., 2008, 92, 173117 CrossRef PubMed.
  15. M. Zong, Y. Huang, Y. Zhao, X. Sun, C. Qu, D. Luo and J. Zheng, RSC Adv., 2013, 3, 23638 RSC.
  16. W. Liu, H. Li, Q. Zeng, H. Duan, Y. Guo, X. Liu, C. Sun and H. Liu, J. Mater. Chem. A, 2015, 3, 3739 CAS.
  17. X. G. Liu, B. Li, D. Y. Geng, W. B. Cui, F. Yang, Z. G. Xie, D. J. Kang and Z. D. Zhang, Carbon, 2009, 47, 470 CrossRef CAS PubMed.
  18. R. C. Che, L. M. Peng, X. F. Duan, Q. Chen and X. L. Liang, Adv. Mater., 2004, 16, 401 CrossRef CAS PubMed.
  19. H. Y. Lin, H. Zhu, H. F. Guo and L. F. Yu, Mater. Lett., 2007, 61, 3547 CrossRef CAS PubMed.
  20. X. F. Zhang, X. L. Dong, H. Huang, Y. Y. Liu, W. N. Wang and X. G. Zhu, Appl. Phys. Lett., 2006, 89, 053115 CrossRef PubMed.
  21. F. S. Wen, F. Zhang and Z. Y. Liu, J. Phys. Chem. C, 2011, 115, 14025 CAS.
  22. L. Wang, C. Tian, H. Wang, Y. Ma, B. Wang and H. Fu, J. Phys. Chem. C, 2010, 114, 8727 CAS.
  23. J. R. Bolton and M. D. Archer, Basic electron-transfer theory, Advances in Chemistry, Washington, 2009, vol. 228, p. 7 Search PubMed.
  24. J. R. Liu, M. Itoh, T. Horikawa, K. I. Machida, S. Sugimoto and T. Maeda, J. Appl. Phys., 2005, 98, 054305 CrossRef PubMed.
  25. Y. J. Chen, F. Zhang, G. G. Zhao, X. Y. Fang, H. B. Jin, P. Gao, C. L. Zhu, M. S. Cao and G. Xiao, J. Phys. Chem. C, 2010, 114, 9239 CAS.
  26. X. C. Luo and D. D. L. Chung, Carbon, 2001, 39, 985 CrossRef CAS.
  27. X. F. Zhang, X. L. Dong, H. Huang, Y. Y. Liu, B. Lv, J. P. Lei and C. J. Choi, J. Phys. D: Appl. Phys., 2007, 40, 5383 CrossRef CAS.
  28. X. F. Zhang, P. F. Guan and X. L. Dong, Appl. Phys. Lett., 2010, 97, 033107 CrossRef PubMed.
  29. L. L. Diandra and D. R. Reuben, Chem. Mater., 1996, 8, 1770 CrossRef.
  30. F. S. Wen, H. B. Yi, L. Qiao, H. Zheng, D. Zhou and F. S. Li, Appl. Phys. Lett., 2008, 92, 042507 CrossRef PubMed.
  31. R. C. Che, C. Y. Zhi, C. Y. Liang and X. G. Zhou, Appl. Phys. Lett., 2006, 88, 033105 CrossRef PubMed.

Footnote

Electronic supplementary information (ESI) available. See DOI: 10.1039/c5ra08623j

This journal is © The Royal Society of Chemistry 2015
Click here to see how this site uses Cookies. View our privacy policy here.