DOI:
10.1039/C5RA08254D
(Paper)
RSC Adv., 2015,
5, 66141-66146
Polymorphous transformation of rod-shaped iron oxides and their catalytic properties in selective reduction of NO by NH3
Received
5th May 2015
, Accepted 27th July 2015
First published on 28th July 2015
Abstract
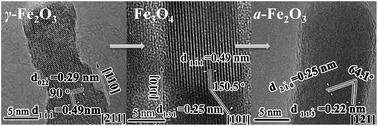
Polymorphous transformation of rod-shaped γ-Fe2O3 was applied to fabricate Fe3O4/Fe2O3 nanorods. Hydrogen reduction of γ-Fe2O3 nanorods at 350 °C yielded Fe3O4 nanorods with similar size; re-oxidation of the resulting Fe3O4 nanorods produced γ-Fe2O3 at 500 °C and α-Fe2O3 nanorods at 600 °C. When applied to catalyze selective reduction of NO with NH3, the activity followed the order γ-Fe2O3 > γ-Fe2O3-500 > α-Fe2O3 > Fe3O4, which was well correlated with their crystalline structures. The superior performance of γ-Fe2O3 nanorods was attributed to the simultaneous exposure of Fe3+ and O2−, which favoured the adsorption and activation of NH3 and NO molecules.
Introduction
Nanostructured iron oxides, mostly Fe2O3 and Fe3O4, have attracted increasing attention in catalysis due to their tunable size, morphology, and crystal phase on the nanometer level.1–4 Among the four polymorphs of Fe2O3, α- and γ-phases are the most extensively studied cases;5 their size and shape altered the catalytic performance considerably. α-Fe2O3 nanorods had a higher activity for CO oxidation than cubic nanocrystals, primarily because of the enrichment of active iron ion on the {110} facets.6 Polyhedral γ-Fe2O3 particles were more active and selective for styrene oxidation to benzaldehyde than spherical particles; and this was ascribed to the exposed {110} planes that provided more Fe ion for the activation of H2O2.7 Moreover, the crystal phase of Fe2O3 affected their catalytic properties as well. For example, γ-Fe2O3 nanorods catalyzed selective reduction of NO with NH3 more efficiently than α-Fe2O3 nanorods.8,9 The γ-phase preferentially exposed the {110} and {100} facets that facilitated the adsorption and activation of NH3 and NO molecules.
The crystalline structure of iron oxides could be described as close-packed arrays of iron cation and oxygen anion with flexible configurations. Polymorphous transformation is one of the most effective routes to mediate the crystal phases among iron oxides; it often involves thermal treatment of a proper precursor at suitable temperature and under oxidizing or reducing atmospheres.5,10,11 For example, calcination of γ-Fe2O3 particles at 370–600 °C in air yielded α-type particles;5,10 oxidation of Fe3O4 particles produced α- or γ-Fe2O3 particles at 200–700 °C.10 While hydrogen reduction of α-Fe2O3 nanorings at 360 °C led to the formation of Fe3O4 nanorings, which could be further oxidized into γ-Fe2O3 nanorings by air at 240 °C.11 Following such a strategy, octahedral γ-Fe2O3 nanoparticles,12 hierarchical γ-Fe2O3 dendrite,13 Fe3O4 disc14 and rods15 have been synthesized. In this work, we studied polymorphous transformation of rod-shaped γ-Fe2O3 to Fe3O4 and α-Fe2O3 nanorods. The influence of crystal phase of these rod-shaped iron oxides on their catalytic performances in selective reduction of NO with NH3 was examined.
Experimental
Synthetic procedure
All chemical reagents were commercially available in analytical purity and used without further purification. Rod-shaped β-FeOOH was prepared by aqueous-phase precipitation of ferric salt with Na2CO3.8,9 An aqueous solution containing 5.38 g FeCl3·6H2O, 50 mL polyethylene glycol (PEG), and 150 mL water was gradually heated to 120 °C. 200 mL 0.2 M Na2CO3 aqueous solution was added through a syringe pump at a rate of 5.5 mL min−1. The mixture was further aged at 120 °C for 1 h. The precipitate was collected by filtration, washed with water and ethanol, and dried at 50 °C for 6 h in vacuum. γ-Fe2O3 nanorods were obtained by refluxing the β-FeOOH precursor in PEG. A slurry mixture of 5.0 g β-FeOOH nanorods and 500 mL PEG was gradually heated to 200 °C and refluxed for 24 h under nitrogen flow. The resulting solid was washed with water and ethanol and dried at 50 °C for 12 h in vacuum. Fe3O4 nanorods were obtained by reducing the γ-Fe2O3 nanorods at 350 °C for 3 h with a 5% H2/N2 mixture. Re-oxidation of Fe3O4 nanorods with a 6% O2/N2 atmosphere at 500 °C for 0.5 h yielded γ-Fe2O3-500 nanorods; while re-oxidizing the Fe3O4 nanorods with a 20% O2/N2 atmosphere at 600 °C for 4 h produced α-Fe2O3 nanorods.
Analysis and measurements
X-ray diffraction (XRD) patterns were recorded on a Rigaku D/Max2500V/PC powder diffractometer with a CuKα radiation source that was operated at 40 kV and 200 mA. Nitrogen adsorption–desorption isotherms were measured on a Nova 4200e instrument at −196 °C. Before the measurement, the sample was degassed at 300 °C for 6 h under vacuum. Micro-Raman spectra were recorded on a Renishaw inVia spectro-meter at room temperature by using a 532 nm solid laser as the excitation source. X-ray photoelectron spectra (XPS) were recorded with a VG ESCALAB MK2 spectrometer using an Al Kα radiation operated at an accelerating voltage of 12.5 kV. The γ-Fe2O3 sample was pressed into a thin disc and mounted on a sample rod placed in a pre-treatment chamber; and it was heated to 350 °C and kept at that temperature for 3 h under flowing a 5% H2/N2 mixture. After being cooled down to room temperature, the sample was evacuated and transferred into the analysis chamber where the spectra of Fe2p and O1s were recorded. The charging effect was corrected by adjusting the binding energy of C1s to 284.6 eV. Transmission electron microscopy (TEM) images were taken on a Philips Tecnai G2 Spirit microscope (120 kV). High-resolution TEM (HRTEM) images were recorded on a G2 F30S-Twin (300 kV) and JEOL 2100 microscope (200 kV). Field-emission scanning electron microscopy (FESEM) images were taken on a Philips Fei Quanta 200F instrument operated at 20 kV. Temperature-programmed reduction of hydrogen (H2-TPR) was conducted with an AutoChem II 2920 instrument (Micromeritics) and analyzed with a thermal conductor detector (TCD). 50 mg samples were pre-treated with He (30 mL min−1 for Fe3O4) or a 3.0 vol% O2/He mixture (30 mL min−1 for α-Fe2O3, γ-Fe2O3 and γ-Fe2O3-500) at 400 °C for 0.5 h. After being purged with He for 1 h at room temperature, the sample was heated to 900 °C at a ramp of 5 °C min−1 under flowing a 5.0 vol% H2/N2 mixture (30 mL min−1).
SCR of NO by NH3
Selective reduction of NO with NH3 was conducted with a continuous-flow quartz tubular reactor under atmospheric pressure. 100 mg catalysts (40–60 mesh) were treated with a 3.0 vol% O2/He mixture (60 mL min−1, α-Fe2O3, γ-Fe2O3 and γ-Fe2O3-500) or He (60 mL min−1, Fe3O4) at 400 °C for 0.5 h. The feed gas contained 1000 ppm NO, 1000 ppm NH3, and 3 vol% O2 balanced with He (120 mL min−1). The effluent from the reactor was analyzed by an on-line mass spectrometer (Omini-Star) for the analysis of N2 and N2O. A NO/NO2/NOx analyzer (Thermo Environmental Instruments Inc.) was used to monitor the concentrations of NO and NO2. The conversion of NO and the selectivity of N2 were calculated according to the following equations.
NO conversion% = ([NO]in − [NO]out) × 100/[NO]in |
N2 selectivity = [N2]out/([N2]out + [N2O]out) × 100% |
Results and discussion
Fig. 1 shows XRD pattern of the γ-Fe2O3 nanorods. Typical diffraction lines of γ-Fe2O3 were clearly identified. Compared with the standard pattern of γ-Fe2O3, however, the intensities of the (400) and (440) lines enhanced remarkably, indicating the preferential exposure of the {110} and {100} planes. The micro-Raman spectrum (Fig. 1b) showed the typical band of A1g mode at 700 cm−1, the band of Eg mode at 500 cm−1, and the band of T2g mode at 350 cm−1,16 confirming the crystalline structure of γ-Fe2O3. The XPS profile (Fig. 2) showed binding energies of Fe2p at 710.9 and 724.4 eV and a satellite peak at 719.2 eV, suggesting the presence of Fe3+ species on the surface.17 There were two types of oxygen species in the O1s spectrum; the binding energy at 530 eV represented the lattice oxygen (Oα) while the binding energy at 531.6 eV referred to the deficient oxygen (Oβ);18 the concentration of Oβ on the γ-Fe2O3 nanorods was 38%. SEM and TEM images (Fig. 3) verified that the γ-Fe2O3 nanorod had an average diameter of 20 nm and a mean length of 130 nm. When viewed along [211] direction, the interplanar distances of 0.29 and 0.49 nm with an interfacial angle of 90° was assigned to the (022) and (111) planes. The lattice spacings of 0.29 nm with a dihedral angle of 60°, viewed along [111] direction, suggested the anisotropic growth of the nanorod along [110] direction (Fig. 3). Taking the rectangular tip into account, the γ-Fe2O3 nanorod was proposed to expose {110} and {001} side planes and {110} top planes. According to the atomic configuration of γ-Fe2O3,19 the {110} and {001} facets are simultaneously terminated with iron cation and oxygen anion.
 |
| Fig. 1 XRD patterns (a) and Raman spectra (b) of the Fe2O3 and Fe3O4 nanorods. | |
 |
| Fig. 2 Fe2p (a) and O1s (b) XPS profiles of the iron oxides nanorods. | |
 |
| Fig. 3 SEM and TEM images of the γ-Fe2O3 nanorods. | |
Hydrogen reduction of the γ-Fe2O3 nanorods at 350 °C yielded Fe3O4 nanorods. Although the obtained sample exhibited similar diffraction lines to the γ-Fe2O3 nanorods (Fig. 1a), micro-Raman spectra discriminated its crystal phase. The band of A1g mode of Fe3O4 appeared at 665 cm−1 while bands of T2g mode appeared at 540 and 311 cm−1 (Fig. 1b).20 Moreover, the XPS profile (Fig. 2) showed typical bonding energies of Fe2p3/2 at 710 eV and Fe2p1/2 at 724 eV; quantitative analysis verified that the Fe3+/Fe2+ ratio was about 1.95 that is very close to the stoichiometric value of 2.0 in Fe3O4,21,22 evidencing that γ-Fe2O3 was entirely converted into Fe3O4. The Fe3O4 nanorod had a diameter of about 20 nm and a mean length of 130 nm; and it was enclosed with {110} and {001} side planes and {110} top planes (Fig. 4a–c). By far, there is no general consensus on the atomic configurations of these polar surfaces on Fe3O4.23–25 Fe3O4 consists of tetrahedral Fe3+ site and octahedral site that was equally occupied by Fe2+ and Fe3+;10 the facets might be terminated by tetrahedral iron cation, oxygen anion or octahedral iron cation.
 |
| Fig. 4 TEM images of the Fe3O4 (a–c), γ-Fe2O3-500 (d–f), and α-Fe2O3 (g–i) nanorods. | |
Re-oxidization of the Fe3O4 nanorods at 500 °C yielded γ-Fe2O3-500 nanorods with characteristic XRD pattern (Fig. 1a) and Raman bands at 700, 500, and 350 cm−1 (Fig. 1b).16 The XPS profile was similar to that of the original γ-Fe2O3 nanorods with the presence of only Fe3+ on the surface, but the concentration of Oβ species lowered to 19% (Fig. 2). This might be caused by the reconstruction of the porous nanostructure during the polymorphous transformation of the rod-shaped iron oxides. The γ-Fe2O3-500 nanorod (Fig. 4d–f) exposed similar crystal facets as the original γ-Fe2O3 nanorod, although the exposure of the {100} and {001} facets slightly decreased from 58% to 40%.
Further increasing the temperature of oxidation up to 600 °C, α-Fe2O3 nanorods were produced, as being evidenced by the diffraction lines of α-Fe2O3 (Fig. 1a) and the micro-Raman spectrum (Fig. 1b). A1g mode in α-Fe2O3 appeared at 221 and 497 cm−1 and Eg modes presented at 292, 406 and 611 cm−1.16 TEM analysis indicated that the size of the α-Fe2O3 nanorod (Fig. 4g) was almost the same as the Fe3O4 nanorods. HRTEM observation verified that the α-Fe2O3 nanorods mainly exposed the (210) plane, which is terminated by ferric ion only. The surface areas of the rod-shaped iron oxides were 111 m2 g−1 for γ-Fe2O3, 138 m2 g−1 for Fe3O4, 92 m2 g−1 for γ-Fe2O3-500, and 56 m2 g−1 for α-Fe2O3.
Fig. 5 shows H2-TPR profiles of the rod-shaped iron oxides. The two γ-Fe2O3 samples showed an intense reduction peak at 200–400 °C and two broad reduction peaks at 400–900 °C. The total amount of hydrogen consumed approximately equalled to the stoichiometric amount (18.75 mmol H2 per g) for the conversion of Fe2O3 to Fe. Since the amount of hydrogen consumed at 200–400 °C was about 13% of the total amount, this low-temperature reduction could be assigned to the reduction of Fe2O3 to Fe3O4. The two broad reduction peaks at high-temperature range corresponded to the further reduction of Fe3O4 to Fe.26,27 The reduction of Fe3O4 nanorods consisted of two steps: Fe3O4 to FeO at 400–650 °C and FeO to Fe at 650–900 °C. The total amount of H2 consumed was 17.53 mmol H2 per g, equalling to the theoretical value (17.24 mmol H2 per g) for the reduction of Fe3O4 to Fe. The ratio of the amounts of hydrogen consumed during the two steps was 0.25, confirming a sequential process from Fe3O4 to Fe through FeO.27 α-Fe2O3 nanorods showed a similar reduction pattern as γ-Fe2O3 but the reduction of Fe2O3 to Fe3O4 occurred at relatively a higher temperature, about 400 °C, suggesting that γ-Fe2O3 was more reducible than α-Fe2O3 with similar size and shape. This is linked to the dominant exposure of the {110} and {100} facets on the γ-Fe2O3 nanorod, which are simultaneously terminated by Fe3+ and O2− sites. This kind of surface atomic configuration caused the Fe–O bond more reducible and reactive8,9 and also favored the activation of hydrogen molecule.28
 |
| Fig. 5 H2-TPR profiles of the Fe2O3 and Fe3O4 nanorods. | |
Polymorphous transformation of Fe2O3 to Fe3O4 starts with the removal of surface oxygen ion by hydrogen, followed by the diffusion of Fe2+ to the bulk. The crystal structure of Fe2O3 determines the rearrangements of iron cation and oxygen anion.29 Since γ-Fe2O3 and Fe3O4 share a very similar cubic structure,23 the phase transformation is actually a topotactic process without crystallographic change, making the migration of Fe2+ is more energetically favourable. Therefore, γ-Fe2O3 nanorods were easily reduced into Fe3O4 nanorods. On the other hand, re-oxidation of Fe3O4 to Fe2O3 is initialized by the adsorption of oxygen molecule, followed by electron transfer from Fe2+ to Fe3+, requiring the diffusion of bulk iron cation toward the surface.30 Because of the similar cubic structure between Fe3O4 and γ-Fe2O3, the topotactic conversion only involved rearrangement of ferric ions inside the unit cell but without requiring nucleation species.30,31 As a consequence, Fe3O4 nanorods were converted into γ-Fe2O3 nanorods at 500 °C. On the other hand, the oxygen layer in α-Fe2O3 is in a hexagonal-close-packed pattern with a two-layer periodicity, differing from the face-center-cubic stacking manner in Fe3O4, re-oxidation of Fe3O4 to α-Fe2O3 requires a rearrangement of oxygen layers and a nucleation species.32,33 Therefore, the conversion of Fe3O4 nanorods to α-Fe2O3 nanorods occurred at a higher temperature, 600 °C.
Fig. 6a compares NO conversion on the rod-shaped iron oxides in selective reduction of NO with NH3. Both the conversion of NO below 350 °C and the temperature window for 80% NO conversion followed the order γ-Fe2O3 > γ-Fe2O3-500 > α-Fe2O3 > Fe3O4. At 225 °C, the conversion of NO on γ-Fe2O3 nanorods approached 80%, whereas it was 38% on γ-Fe2O3-500, 13% on α-Fe2O3, and only 2% on Fe3O4. This result evidences the superior activity of the γ-Fe2O3 nanorods. In addition, the selectivity of N2 was more than 95% while the selectivity of N2O was less than 5% in the temperature region investigated (Fig. 6b). Long-term stability test at 300 °C indicated that the conversion of NO over the γ-Fe2O3 nanorods retained at 90% for 100 hours; and the spent catalyst kept the original crystal phase, size and shape (Fig. 6c), demonstrating the outstanding stability of rod-shaped γ-Fe2O3 under the reaction conditions. This prominent performance of the γ-Fe2O3 nanorods is closely associated with the simultaneously exposed iron and oxygen ions on the {100} and {001} facets. The reaction pathway of NH3-SCR on iron oxides generally involves the initial adsorption and activation of NH3 on the Lewis acidic Fe3+ site and H-removal by the neighbouring oxygen anion, followed by its reaction with the weakly adsorbed NO to release N2.34,35 In this context, the reducibility of iron oxides plays a major role in determining the activity. For the γ-Fe2O3 nanorods, the surface atomic configuration favored a superior redox feature with the Fe–O bond more reducible and reactive.28 The relatively lower activity of the γ-Fe2O3-500 nanorods might be due to the less exposing fraction of reactive {110} and {100} facets (58% vs. 40%) and the decreased amount of surface deficient oxygen species. The lower activity of the α-Fe2O3 nanorods was caused by the dominant exposure of the (210) planes that is terminated by ferric ion only. This surface provides adsorption site of NH3 but lacks neighbouring oxygen anion for the activation of ammonia molecule.8 The much lower activity of the Fe3O4 nanorods was ascribed to the surface coordination environment;25 there was at least 1/3 iron species (Fe2+) in the unit cell, which are almost inert for the NH3-SCR reaction.
 |
| Fig. 6 (a) NO conversion, (b) N2/N2O selectivities as a function of temperature in NH3-SCR over the Fe2O3 and Fe3O4 nanorods and (c) long-term test of the γ-Fe2O3 nanorods at 300 °C. Reaction conditions: 100 mg catalyst, 1000 ppm NO/1000 ppm NH3/3.0 vol% O2/He, 72 000 mL g−1 h−1; the temperature was increased to 500 °C at a rate of 3 °C min−1. | |
Conclusions
Polymorphous transformation of rod-shaped γ-Fe2O3 to Fe3O4 and α-Fe2O3 was achieved at proper temperatures and under reducing and/or oxidative atmospheres. Since γ-Fe2O3 and Fe3O4 had a similar crystalline structure, their polymorphous transformation followed a typical topotactic process under relatively mild conditions; whereas the phase transfer from Fe3O4 to α-Fe2O3 required a higher temperature because of lattice reconstruction. The γ-Fe2O3 nanorods showed superior catalytic activity toward NH3-SCR, primarily because of the preferentially exposed {110} and {100} facets that were co-terminated by iron and oxygen ions.
Acknowledgements
We acknowledge financial support for this research work from the National Natural Science Foundation of China (21025312, 21303193, and 21321002) and the National Key Basic Research Program of China (2013CB933100).
Notes and references
- J. Ouyang, J. Pei, Q. Kuang, Z. Xie and L. Zheng, ACS Appl. Mater. Interfaces, 2014, 6, 12505–12514 CAS
. - X. Mou, X. Wei, Y. Li and W. Shen, CrystEngComm, 2012, 14, 5107–5120 RSC
. - H. Liang, W. Chen, X. Jiang, X. Xu, B. Xu and Z. Wang, J. Mater. Chem. A, 2014, 2, 4340–4346 CAS
. - W. Cheng, J. He, T. Yao, Z. Sun, Y. Jiang, Q. Liu, S. Jiang, F. Hu, Z. Xie, B. He, W. Yan and S. Wei, J. Am. Chem. Soc., 2014, 136, 10393–10398 CrossRef CAS PubMed
. - L. Machala, J. Tucek and R. Zboril, Chem. Mater., 2011, 23, 3255–3272 CrossRef CAS
. - X. Liu, J. Liu, Z. Chang, X. Sun and Y. Li, Catal. Commun., 2011, 12, 530–534 CrossRef CAS PubMed
. - N. Zhao, W. Ma, Z. Cui, W. Song, C. Xu and M. Gao, ACS Nano, 2009, 3, 1775–1780 CrossRef CAS PubMed
. - X. Mou, B. Zhang, Y. Li, L. Yao, X. Wei, D. S. Su and W. Shen, Angew. Chem., Int. Ed., 2012, 51, 2989–2993 CrossRef CAS PubMed
. - X. Mou, Y. Li, B. Zhang, L. Yao, X. Wei, D. S. Su and W. Shen, Eur. J. Inorg. Chem., 2012, 14, 2684–2690 CrossRef PubMed
. - R. M. Cornell and U. Schwertmann, The iron oxides: structure, properties, occurrence and uses, Wiley-VCH, Weinheim, Germany, 2nd edn, 2003 Search PubMed
. - C. J. Jia, L. D. Sun, F. Luo, X. D. Han, L. J. Heyderman, Z. G. Yan, C. H. Yan, K. Zheng, Z. Zhang, M. Takano, N. Hayashi, M. Eltschka, M. Klaui, U. Rudiger, T. Kasama, L. Cervera Gontard, R. E. Dunin-Borkowski, G. Tzvetkov and J. Raabe, J. Am. Chem. Soc., 2008, 130, 16968–16977 CrossRef CAS PubMed
. - W. X. Li, B. L. Lv and Y. Xu, J. Nanopart. Res., 2013, 15, 2114 CrossRef
. - G. Sun, B. Dong, M. Cao, B. Wei and C. Hu, Chem. Mater., 2011, 23, 1587–1593 CrossRef CAS
. - Y. Yang, X. Liu, Y. Lv, T. S. Herng, X. Xu, W. Xia, T. Zhang, J. Fang, W. Xiao and J. Ding, Adv. Funct. Mater., 2015, 25, 812–820 CrossRef CAS PubMed
. - L. Hou, Q. Zhang, F. Jérôme, D. Duprez, H. Zhang and S. Royer, Appl. Catal., B, 2014, 144, 739–749 CrossRef CAS PubMed
. - X. Zhang, Y. Niu, X. Meng, Y. Li and J. Zhao, CrystEngComm, 2013, 15, 8166–8172 RSC
. - D. Li, S. J. Li, Y. Zhang, J. J. Jiang, W. J. Gong, J. H. Wang and Z. D. Zhang, Mater. Res. Innovations, 2015, 19, 58–62 CrossRef PubMed
. - A. P. Grosvenor, B. A. Kobe and N. S. McIntyre, Surf. Sci., 2004, 572, 217–227 CrossRef CAS PubMed
. - X. L. Hu and J. C. Yu, Adv. Funct. Mater., 2008, 18, 880–887 CrossRef CAS PubMed
. - J. M. Li, A. C. H. Huan, L. Wang, Y. W. Du and D. Feng, Phys. Rev. B: Condens. Matter Mater. Phys., 2000, 61, 6876–6878 CrossRef CAS
. - T. Fujii, F. M. F. de Groot, G. A. Sawatzky, F. C. Voogt, T. Hibma and K. Okada, Phys. Rev. B: Condens. Matter Mater. Phys., 1999, 59, 3195–3202 CrossRef CAS
. - G. Bhargava, I. Gouzman, C. M. Chun, T. A. Ramanarayanan and S. L. Bernasek, Appl. Surf. Sci., 2007, 253, 4322–4329 CrossRef CAS PubMed
. - R. Jansen, V. Brabers and H. van Kempen, Surf. Sci., 1995, 328, 237–247 CrossRef CAS
. - B. Stanka, W. Hebenstreit, U. Diebold and S. Chambers, Surf. Sci., 2000, 448, 49–63 CrossRef CAS
. - N. Spiridis, J. Barbasz, Z. Łodziana and J. Korecki, Phys. Rev. B: Condens. Matter Mater. Phys., 2006, 74, 155423 CrossRef
. - S. J. Hug, J. Colloid Interface Sci., 1997, 188, 415–422 CrossRef CAS
. - J. Zieliński, I. Zglinicka, L. Znak and Z. Kaszkur, Appl. Catal., A, 2010, 381, 191–196 CrossRef PubMed
. - Q. Han, Z. Liu, Y. Xu, Z. Chen, T. Wang and H. Zhang, J. Phys. Chem. C, 2007, 111, 5034–5038 CAS
. - U. Colombo, F. Gazzarrini and G. Lanzavecchia, Mater. Sci. Eng., 1967, 2, 125–135 CrossRef CAS
. - K. J. Gallagher, W. Feitknecht and U. Mannweiler, Nature, 1968, 217, 1118–1121 CrossRef CAS PubMed
. - F. Jiao, J. C. Jumas, M. Womes, A. V. Chadwick, A. Harrison and P. G. Bruce, J. Am. Chem. Soc., 2006, 128, 12905–12909 CrossRef CAS PubMed
. - U. Colombo, F. Gazzarrini, G. Lanzavecchia and G. Sironi, Science, 1965, 147, 1033 CAS
. - S. Nie, E. Starodub, M. Monti, D. A. Siegel, L. Vergara, F. El Gabaly, N. C. Bartelt, J. De la Figuera and K. F. McCarty, J. Am. Chem. Soc., 2013, 135, 10091–10098 CrossRef CAS PubMed
. - P. Granger and V. I. Parvulescu, Chem. Rev., 2011, 111, 3155–3207 CrossRef CAS PubMed
. - K. Otto and M. Shelef, J. Catal., 1970, 18, 184–192 CrossRef CAS
.
|
This journal is © The Royal Society of Chemistry 2015 |
Click here to see how this site uses Cookies. View our privacy policy here.