Enhanced removal of diclofenac from water using a zeolitic imidazole framework functionalized with cetyltrimethylammonium bromide (CTAB)†
Kun-Yi Andrew Lin*a,
Hongta Yangb and
Wei-Der Leea
aDepartment of Environmental Engineering, National Chung Hsing University, 250 Kuo-Kuang Road, Taichung, Taiwan, Republic of China. E-mail: linky@nchu.edu.tw; Tel: +886-4-22854709
bDepartment of Chemical Engineering, National Chung Hsing University, 250 Kuo-Kuang Road, Taichung, Taiwan, Republic of China
First published on 18th September 2015
Abstract
Diclofenac represents one of the most common pharmaceuticals and personal care products (PPCPs) in municipal wastewater. To enhance the removal of diclofenac from water, a cationic surfactant, cetyltrimethylammonium bromide (CTAB), was introduced into a zeolitic imidazole framework (ZIF)-67. CTAB is added originally to minimize the use of ligands during the synthesis of ZIF-67; however CTAB present in ZIF-67 also increases the surface charge and thus enhances the adsorption capacity up to 10 times compared to CTAB-free ZIF-67. Factors influencing the diclofenac adsorption are investigated, including CTAB loading, temperature and pH. A loading of 0.274 mol-CTAB/mol-Co2+ is suggested as an optimal loading to prepare a relatively efficient CTAB-ZIF-67, while over loading of CTAB could not fully incorporate CTAB into ZIF-67. In view of the diclofenac adsorption kinetics and isotherm, the adsorption of diclofenac to CTAB-ZIF-67 was considered to involve a strong affinity between diclofenac and CTAB-ZIF-67 owing to the electrostatic attraction between the carboxylic acid of diclofenac and the quaternary amine of CTAB. Considering that the removal of diclofenac from urine is of great interest, separation of diclofenac from urine using CTAB-ZIF-67 was evaluated and also employed to investigate the effect of co-existing ions. We also determined the desorption behavior of diclofenac from CTAB-ZIF-67 to provide insight for the recyclability of CTAB-ZIF-67 for diclofenac adsorption.
1. Introduction
Emerging pollutants have become one of the most important issues in wastewater treatment. These emerging contaminants include pharmaceuticals and personal care products (PPCPs), flame retardants, pesticides, disinfection by-products, artificial and natural hormones.1 PPCPs particularly attract attention because they are highly persistent and low-biodegradable.2 Thus, PPCPs and their metabolic derivatives can be detected not only in effluents from wastewater treatment plants (WWTPs) but also surface water, ground water and even drinking water.3,4 The presence of PPCPs in various water bodies, even at trace levels, poses a serious threat to public health and the aqua ecology.5,6 Among these PPCPs, diclofenac appears to be one of the most concerning compounds because it has been extensively-used as a non-steroidal anti-inflammatory drug (NSAID) and commonly found in influents and effluents of WWTPs as well as drinking water.4,7 It is also considered to be harmful to aqua lives as well as vultures.8,9 Thus, it is necessary to eliminate diclofenac contamination in water.Since conventional municipal WWTPs cannot effectively degrade diclofenac, advanced oxidation processes (AOPs) have been proposed to treat diclofenac in water.10–12 Nevertheless, oxidants (e.g., ozone and peroxide) must be continuously spent and therefore it can be challenging to use AOPs to remove diclofenac in a large-scale operation.13 Besides, derivatives from AOPs may exhibit even higher toxicity compared to the original pollutant.4 Therefore, adsorption is still considered as a preferable approach to remove diclofenac from water considering its simplicity, low initial cost,14 and by-product-free operation.1 To expand spectrum of adsorbent selection, recently a new type of inorganic–organic hybrid materials, so-called Metal Organic Frameworks (MOFs), has been developed. MOFs have been extensively used in adsorption applications, such as CO2 capture,15–17 gas storage,18 drug delivery,19 and sensors.20 Considering successful demonstrations of MOFs in the above-mentioned areas, lately MOFs are also used to remove pollutants from aqueous solutions.21–23 Some MOFs are even proven to be promisingly advantageous than conventional sorbents for removal of pollutants from water.21,24 Thus, elimination of contaminants using MOFs has attracted increasing attention. Among various types of MOFs, Zeolitic Imidazole Frameworks (ZIFs) stand out as an intriguing subset because ZIFs exhibit superior thermal and chemical stabilities in aqueous solutions, even under alkaline conditions.25 ZIFs have been also employed to remove several pollutants such as humic acid,26 toxic dyes,24,27 and herbicides.23 Therefore, ZIFs should be a feasible adsorbent to remove diclofenac from water. However, to our best knowledge, few studies have evaluated the removal of diclofenac from water using ZIFs. Therefore, in this study ZIFs are employed to remove diclofenac from water. ZIF-67 was selected as a representative ZIF to remove diclofenac because ZIF-67 can be easily prepared under a mild condition in water. Considering that diclofenac is an acid (i.e., 2-(2,6-dichloranilino) phenylacetic acid), surface-functionalization (i.e., positively-charged modification) of ZIF-67 may facilitate the adsorption of diclofenac. Lately, ZIF-67 synthesized with assistance of surfactants has been demonstrated. The addition of surfactants (i.e., cetyltrimethylammonium bromide (CTAB) and Pluronic F127) can minimize dosage of the ligand (i.e., 2-methylimidazole) and allow the synthesis to proceed at room temperature with very high yield.28 In particular, the addition of CTAB, a cationic surfactant, in fact not only improves the synthesis but also incorporates the cationic group into ZIF-67. Thus, the presence of CTAB in ZIF-67 is expected to enhance the diclofenac adsorption. To examine the effect of CTAB addition, ZIF-67 was synthesized with different CTAB loadings to from CTAB-ZIF-67. CTAB-ZIF-67 crystals were characterized using scanning electron microscopy (SEM), powder X-ray diffraction (PXRD), adsorption FT-IR as well as thermogravimetric analyzer (TGA). A pristine ZIF-67 (i.e., CTAB-free ZIF-67) was also prepared to compare with CTAB-ZIF-67 in terms of diclofenac adsorption. Factors influencing the diclofenac adsorption were investigated, including CTAB loading, temperature and pH. An optimal CTAB loading was also suggested to prepare a relatively efficient CTAB-ZIF-67. The diclofenac adsorption kinetics and isotherm were obtained and analyzed using theoretical models. Thermodynamic parameters of the diclofenac adsorption were also determined to better understand the adsorption mechanism. Separation of diclofenac from urine using CTAB-ZIF-67 was evaluated to investigate effect of co-existing ions. We also determined desorption behavior of diclofenac from CTAB-ZIF-67 to provide insight for recyclability of CTAB-ZIF-67 for the diclofenac adsorption.
2. Experimental
2.1 Materials
Chemicals used in this study are all purchased from major suppliers and used without purification. Cobalt nitrate hexahydrate (Co(NO3)2·6H2O) was obtained from Choneye Pure Chemicals (Taiwan). 2-Methylimidazole (2-MIM) and CTAB were obtained from Acros Organics (USA). Sodium diclofenac (see Fig. S1† for its chemical structure) and nonionic triblock copolymer Pluronic F127 were purchased from Sigma-Aldrich. Ammonium hydroxide solution was obtained from Showa Chemicals (Japan). Deionized (DI) water was prepared to exhibit less than 18 MOhm cm. In this study, we also evaluated the separation of diclofenac from urine using CTAB-ZIF-67. The synthetic human urine was prepared according to the reported composition29 which consists of 3 g L−1 (0.050 M) of urea (Sigma-Aldrich, USA), 2.57 g L−1 (0.044 M) of sodium chloride (Showa chemicals, Japan), 2.13 g L−1 (0.015 M) of sodium sulfate (Showa chemicals, Japan), 2.98 g L−1 (0.04 M) of potassium chloride (Showa chemicals, Japan), 0.81 g L−1 (0.004 M) of magnesium chloride hexahydrate (Sigma-Aldrich, USA), 0.04 (or 1.41) g L−1 (0.0003 M or 0.01 M) of sodium monohydrogen phosphate heptahydrate (Sigma-Aldrich, USA) and 0.58 g L−1 (0.004 M) of calcium chloride dihydrate (Showa chemicals, Japan).2.2 Synthesis and characterization of CTAB-ZIF-67
CTAB-ZIF-67 was synthesized according to the reported procedure28 as illustrated in Fig. 1. First, 1 g of 2-MIM (12.1 mmol), 0.15 g (0.032 mmol) of nonionic triblock copolymer, Pluronic F127 and 0.1 g (0.27 mmol) of CTAB were added to 30 mL of DI water, followed by 6.3 mL of ammonium hydroxide solution. On the other hand, 1.77 g (6.1 mmol) of Co(NO3)2·6H2O was added to another beaker containing 30 mL of DI water. Next, the surfactant solution was slowly added to the cobalt solution, and the mixture was then stirred at ambient temperature for 8 h. The resultant precipitate was collected by centrifugation and washed thoroughly with DI water, and dried at 60 °C in the ventilation oven for 6 h and subsequently in the vacuum oven at 140 °C for 12 h to obtain the final product. In this study, CTAB dosage was varied to prepare ZIF-67 with different CTAB-loadings. The CTAB-ZIF-67 prepared above (i.e., 0.1 g (0.27 mmol) of CTAB) was denoted as CTAB-ZIF-67-M, represent its “moderate” CTAB dosage. CTAB-ZIF-67-L and CTAB-ZIF-67-H were synthesized using 0.05 g (0.137 mmol) and 0.25 g (0.685 mmol) of CTAB to represent “low” and “high” CTAB loadings, respectively.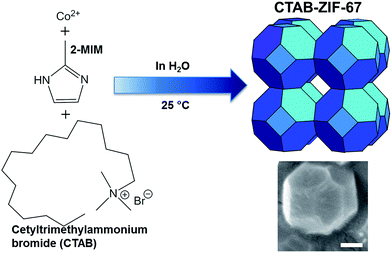 | ||
| Fig. 1 Schematic illustration of the synthesis of ZIF-67 functionalized with CTAB (scale bar in the SEM image is 200 nm). | ||
The as-synthesized CTAB-ZIF-67 was first characterized using a field emission SEM (JEOL JSM-6700, Japan) to observe its morphology. XRD patterns of CTAB-ZIF-67 were determined by an X-ray diffractometer (PANalytical, the Netherlands). Infrared (IR) spectrum of CTAB-ZIF-67 was obtained using a Fourier-Transform Infrared spectrometer (4100, Jasco, Japan). Thermal stability of CTAB-ZIF-67 was measured by a thermogravimetric analyzer (TGA i1000, Instrument Specialists Incorporated, USA) at a heating rate of 20 °C min−1 from 25 to 800 °C in nitrogen. Zeta potentials of CTAB-ZIF-67 were obtained in water with pH varied from 3–11 using a zetasizer (Nano-ZS, Malvern Instruments Ltd, Malvern, UK).
2.3 Removal of diclofenac from water using CTAB-ZIF-67
Adsorption of diclofenac to CTAB-ZIF-67 was investigated by batch-type experiments. First, the adsorption kinetics was measured by adding 0.01 g of CTAB-ZIF-67 to a glass via containing 0.02 L of diclofenac solution with an initial concentration C0 = 20 mg L−1. The vial was immediately placed on the temperature-controllable orbital shaker at 300 rpm to increase contact between CTAB-ZIF-67 and diclofenac. The adsorption capacity of CTAB-ZIF-67 at different mixing time, qt (mg g−1), was calculated as follows (eqn (1)):
 | (1) |
2.4 Effects of pH and co-existing ions on the adsorption of diclofenac
To investigate effect of pH, pH of diclofenac solutions was adjusted by adding 0.1 M of hydrochloric acid and sodium hydroxide to 4–10. Since diclofenac wastewater may also contain other compounds, it is critical to examine whether co-existing ions affect the diclofenac adsorption. Recently, the separation of diclofenac from urine has attracted great attention29 because around 70% of used pharmaceuticals were discharged in human urine as active drugs and metabolites.31 Thus, we particularly evaluated whether CTAB-ZIF-67 can separate diclofenac from urine and also examine whether ingredients in urine (e.g., salts, urea and anions) can interfere with the diclofenac adsorption. Since urine typically contains high concentration of phosphate, variation of phosphate was also monitored during the diclofenac adsorption.2.5 Recyclability and desorption of diclofenac from CTAB-ZIF-67
The recyclability of CTAB-ZIF-67 was also evaluated by regenerating the spent CTAB-ZIF-67 with concentrated sodium chloride solution (5 wt%) and an ion-exchange (I.E.) resin (Dowex Marathon C, strongly acidic). Desorption behaviors of diclofenac from CTAB-ZIF-67 in the presence of sodium chloride and the I.E. resin were measured to provide insights to the recyclability. To obtain the desorption kinetics, diclofenac-saturated CTAB-ZIF-67 was added to a glass vial containing the concentrated sodium chloride solution (5 wt%) or the I.E. resin (5 wt%). Sample aliquots were withdrawn from the mixture and the concentration of diclofenac in the bulk phase was analyzed using the spectrophotometer. Surface areas and pore volumes of ZIF-67 samples were measured by a volumetric sorption analyzer (Micromeritics ASAP 2020, USA) at a relative pressure (P/P0) range of 0.0001–0.99. The release of Co2+ from CTAB-ZIF-67 during the adsorption and desorption processes was determined by an atomic absorption spectrophotometer (Perkin Elmer AA100, USA).3. Results and discussion
3.1 Characterization of CTAB-ZIF-67
Morphologies of CTAB-ZIF-67 with various CTAB loadings can be seen in Fig. S2 (see ESI†), in which the morphology of ZIF-67 without CTAB loading is also revealed for comparison. It can be seen that the pristine ZIF-67 (w/o CTAB) (Fig. S2(a)†) exhibited a well-developed chamfered-cubic structure with sharp edges. In the case of CTAB-ZIF-67-L (Fig. S2(b)†), the chamfered-cubic morphology can be still observed, even though edges of the crystals were slightly rounded. Once the CTAB loading increased to form CTAB-ZIF-67-M (Fig. S2(c)†), the edges were blunted. With the highest loading of CTAB, the morphology of CTAB-ZIF-67-H (Fig. S2(d)†) started becoming irregular. Particle sizes were also found to become smaller with a higher CTAB loading. Similar morphological changes were observed when the addition of CTAB was increased.28,32 To examine whether the morphology variation and the addition of CTAB affected crystalline of CTAB-ZIF-67, the pristine ZIF-67 and CTAB-ZIF-67 with different CTAB loadings were analyzed by XRD and the result can be seen in Fig. 2(a). The XRD pattern of the pristine ZIF-67 can be readily indexed according to reported literatures:33 7.31° (0 1 1), 10.36° (0 0 2), 12.72° (1 1 2), 14.40° (0 2 2), 16.45° (0 1 3), 18.04° (2 2 2), 22.15° (1 1 4), 24.53° (2 3 3), 25.62° (2 2 4), 26.70° (1 3 4), 29.67° (0 4 4), 30.62° (3 3 4), 31.55° (2 4 4) and 32.43° (2 3 5). This indicates that the as-synthesized pristine ZIF-67 was well-developed. Once CTAB was loaded in ZIF-67 to form CTAB-ZIF-67, CTAB-ZIF-67, regardless of the CTAB loading, exhibited comparable XRD patterns to that of the pristine ZIF-67. This indicates that even though CTAB was added to ZIF-67, its crystallinity could be still well-developed. The addition of CTAB, however, can be revealed using FT-IR (Fig. 2(b)). In the spectrum of the pristine ZIF-67, most of peaks are derived from its ligand (e.g., 2-MIM). The peaks in the range of 600–1500 cm−1 could be attributed to the stretching and bending modes of the imidazole ring. The peak at 1584 cm−1 was due to the stretching mode of C![[double bond, length as m-dash]](https://www.rsc.org/images/entities/char_e001.gif) N bonding in 2-MIM. The peaks at 2929 and 3135 cm−1 were assigned to the stretching mode of C–H from the aromatic ring and the aliphatic chain in 2-MIM, respectively.24,33–35
N bonding in 2-MIM. The peaks at 2929 and 3135 cm−1 were assigned to the stretching mode of C–H from the aromatic ring and the aliphatic chain in 2-MIM, respectively.24,33–35
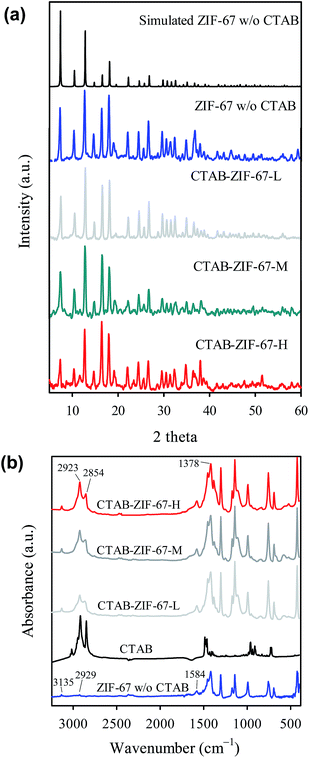 | ||
| Fig. 2 Characteristics of the pristine ZIF-67 (CTAB-free ZIF-67) and CTAB-ZIF-67: (a) PXRD patterns and (b) FTIR spectra at ambient temperature. | ||
Once CTAB was added to ZIF-67, spectra of CTAB-ZIF-67 are found to be similar to that of the pristine ZIF-67, except that a few additional peaks can be observed in the range of 2800–3000 and 1378 cm−1. In comparison with the spectrum of CTAB (Fig. 2(b)), these additional peaks can be attributed to CTAB: the peak at 1378 cm−1 was attributed to the C–H vibration, the peak at 2834 cm−1 was due to symmetric stretching mode of CH2 and the peak at 2911 cm−1 was assigned to the asymmetric stretching mode of CH2.36 The appearance of these peaks suggests that CTAB molecules might be present on the surface of ZIF-67. It has been indicated that introduction of bulky molecules to ZIFs was preferentially via binding to surface of ZIFs rather than penetrating into pores.37
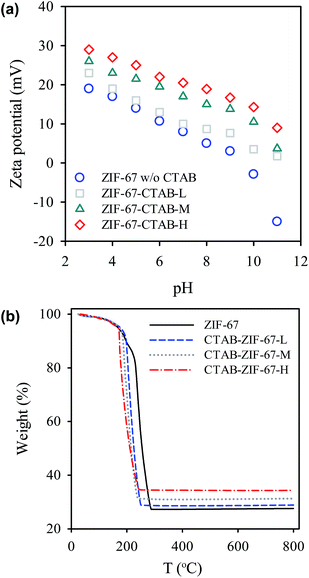
The existence of CTAB can be also revealed by investigating the surface charge of CTAB-ZIF-67 (Fig. 3(a)). Without CTAB, the pristine CTAB-67 already exhibits positive charges under most of pH values. While CTAB was introduced to form CTAB-ZIF-67-L, its zeta potential became slightly more positive. Once more CTAB was added to CTAB-ZIF-67 to form CTAB-ZIF-67-M and CTAB-ZIF-67-H, the surface charges were found to be much more positive. These results validate the existence of CTAB and a higher loading of CTAB can considerably increase the surface charge. Furthermore, we also examined whether the existence of CTAB affected thermal stability of ZIF-67. In the case of the pristine ZIF-67 (Fig. 3(b)), a slight weight loss can first be noticed starting from 100 to 200 °C, possibly owing to the escape of guest molecules such as 2-MIM, methanol and gas molecules from the cavities.38 Subsequently, a significant weight loss can be found in the range of 200–300 °C, which was due to the decomposition of the ligand.38 When CTAB was added to ZIF-67 to form CTAB-ZIF-67-L, it also started the decomposition starting at 100 °C, followed by a major weight loss occurring from 200 to 300 °C. However, one can notice that the TGA curve in 200–300 °C of CTAB-ZIF-67-L appears slightly different from that of the pristine ZIF-67. To quantitatively compare the TGA curves, T50 was used to represent a temperature at which weight loss reaches 50% of its original weight.39 For the pristine ZIF-67, its T50 is 210 °C, whereas T50 of CTAB-ZIF-67-L was 200 °C. Once CTAB loading was further increased in CTAB-ZIF-67 to form CTAB-ZIF-67-M and CTAB-ZIF-H, their T50 became 195 and 190 °C, respectively. This reveals that the addition of CTAB in fact decreased the thermal stability of ZIF-67 noticeably. One can also observe that the edge of TGA curve at around 200 °C, where the major weight loss started occurring, shifted to low temperatures, indicating that the decomposition of CTAB-ZIF-67 was initiated at low temperatures. Unlike other polymer-functionalized nanocomposites which can exhibit enhanced thermal stability,40 the addition of CTAB in fact slightly weakened the thermal stability of ZIF-67 probably because decomposition of alkanes of CTAB occurred at a relatively low temperature. Elemental analyses (i.e., C, N, H) of CTAB-ZIF-67 with different CTAB loadings were also conducted and summarized in Table S2.† One can see that CTAB-ZIF-67 contained a higher percentage of carbon and a lower percentage of nitrogen. Since CTAB, although consists of nitrogen, comprises a long alkyl chain, the addition of CTAB in fact led to a higher fraction of carbon and a lower percentage of nitrogen. When a higher loading of CTAB was added to ZIF-67, the carbon fraction in CTAB-ZIF-67 was further increased and the nitrogen fraction was also further decreased, validating that CTAB was introduced into ZIF-67.
Table S3† also shows surface area and porosities of CTAB-ZIF-67 with different CTAB loadings. Surface area of the pristine ZIF-67 is also listed in Table S3† for comparison. When no CTAB was introduced to ZIF-67, the surface area could reach 1710 m2 g−1, which agrees with the reported value in the literature.41 However, after the introduction of CTAB to ZIF-67, the surface area and pore volume was found to decrease. The decrease became more significant as more CTAB was loaded in ZIF-67. This result suggests that the introduction of CTAB might deposit on the surface of ZIF-67 as discussed in the IR result, thereby blocking the pores and reducing the surface area.
3.2 Effect of CTAB loading on the adsorption of diclofenac
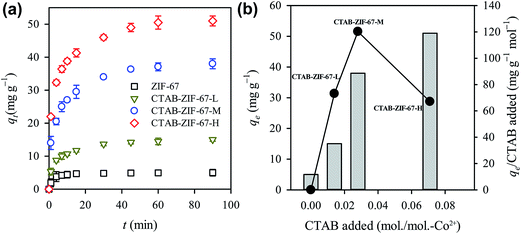
Adsorption kinetics of diclofenac to CTAB-ZIF-67 with different CTAB loadings can be seen in Fig. 4(a). In order to examine the effect of CTAB loading, we also measured adsorption capacity of the pristine ZIF-67 as a reference. As revealed in Fig. 4(a), while diclofenac adsorption to the pristine ZIF-67 could quickly reach the equilibrium, its qe was only around 5 mg L−1. Once CTAB was introduced to form CTAB-ZIF-67-L, the qe is significantly increased to 15 mg g−1. As CTAB loading became even higher in CTAB-ZIF-67-M and CTAB-ZIF-67-H, the qe was further improved to 38 and 51 mg g−1, respectively, indicating that the addition of CTAB can remarkably enhance the diclofenac adsorption. However, the enhancements in qe of CTAB-ZIF-67 were not linearly proportional to the CTAB loadings added during the synthesis. Considering that the CTAB loadings in CTAB-ZIF-67-L, CTAB-ZIF-67-M and CTAB-ZIF-67-H were 0.05 g (137 μmol), 0.1 g (274 μmol) and 0.25 g (686 μmol), respectively, we calculated enhancement in qe (mg g−1) per mole of CTAB added and the result is shown in Fig. 4(b). It can be seen that even though CTAB-ZIF-67 H exhibited the highest qe, its qe per mole of CTAB added was not the highest. Instead, CTAB-ZIF-67-M exhibited a higher qe/mol-CTAB than other two CTAB-ZIF-67. This reveals that a higher amount of CTAB loading did not guarantee a higher enhancement in qe. In fact, one can also observe that the CTAB loading was not linearly proportional to the increase in surface charge of ZIF-67 as seen in Fig. 3(a). This suggests that the addition of CTAB was not fully incorporated into ZIF-67 in CTAB-ZIF-67-H and a part of CTAB might be just wasted. Considering that CTAB-ZIF-67-M appeared to be a much efficient CTAB-functionalized ZIF-67, we selected CTAB-ZIF-67-M to investigate other effects on the diclofenac adsorption.Regardless of the CTAB loading, the result revealed above indicates that the introduction of CTAB remarkably improved the diclofenac adsorption. It has been revealed that adsorption of organic pollutants to MOFs/ZIFs can occur via the following interactions: electrostatic interactions, Lewis acid–base interactions, hydrogen bonding as well as π–π stacking interactions.42 Considering that the size of diclofenac seems larger than pores of ZIF-67, the adsorption of diclofenac to ZIF-67 was considered as a surface phenomenon, in which diclofenac might be attracted to the surface-positively-charged CTAB-ZIF-67. As shown in Fig. S3(a),† the surface morphology and the post-adsorption XRD pattern of CTAB-ZIF-67 remained almost the same after the diclofenac adsorption (Fig. S3(b)†). This suggests that the adsorption of diclofenac to CTAB-ZIF-67 did not considerably alter the morphology and crystalline structure. On the other hand, Fig. S3(c) and (d)† reveal IR spectra of diclofenac and CTAB-ZIF-67 before and after the diclofenac adsorption. It can be seen that the post-adsorption IR spectrum did not change significantly, indicating that the diclofenac adsorption did not remarkably change the surface chemical composition of CTAB-ZIF-67. Nevertheless, the spectral features of diclofenac can be observed in the post-adsorption IR spectrum of CTAB-ZIF-67, especially in the range of 1450–1750 cm−1, indicating that diclofenac was indeed adsorbed to the surface of CTAB-ZIF-67. The elemental analyses of CTAB-ZIF-67 after the diclofenac adsorption are also summarized in Table S2.† It can be seen that carbon was still the primary constituent in diclofenac. Therefore, the carbon content tended to increase in CTAB-ZIF-67 after the diclofenac adsorption, while the nitrogen content became much smaller. This also suggests that diclofenac was adsorbed to CTAB-ZIF-67.
3.3 Effect of temperature on the adsorption kinetics
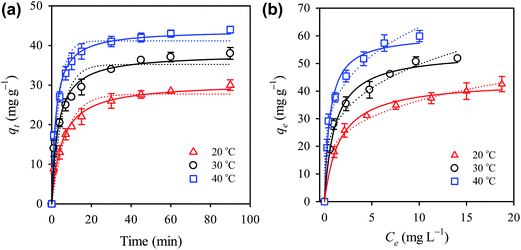
The effect of temperature was examined by studying the adsorption kinetics and isotherm at 20, 30 and 40 °C. Fig. 5(a) shows the adsorption kinetics at different temperatures and the qt was found to increase considerably at higher temperatures, revealing that elevated temperatures can improve the diclofenac adsorption.To quantitatively evaluate the effect of temperature on the adsorption, the pseudo first order and the pseudo second rate laws were employed to analyze the adsorption kinetics. The pseudo first rate law can be expressed as follows (eqn (2)):
 | (2) |
The fitting result using the pseudo first rate law can be represented as the dashed lines in Fig. 5(a), and correlation coefficients (R12) and rate constants, k1, are listed in Table 1. The k1 value was found to increase at higher temperatures, validating faster kinetics at the elevated temperature. However, the R12 values are all below 0.95, indicating that the pseudo first order rate law was not a satisfactory model to describe the kinetics. Furthermore, the kinetic data were analyzed using the pseudo second order rate law which can be expressed as follows:
 | (3) |
| Conditions | qe,exp (mg g−1) | Pseudo-first-order | Pseudo-second-order | ||||
|---|---|---|---|---|---|---|---|
| Temp. (°C) | k1 (min−1) | qe,est (mg g−1) | R12 | k2 × 103 (g mg−1 min−1) | qe,est (mg g−1) | R22 | |
| 20 | 30 | 0.14 | 27.74 | 0.948 | 6.53 | 30.59 | 0.979 |
| 30 | 38 | 0.19 | 35.23 | 0.921 | 9.58 | 37.46 | 0.961 |
| 40 | 44 | 0.24 | 41.07 | 0.922 | 11.05 | 43.90 | 0.992 |
Since the above-mentioned rate laws could not reveal the diffusion mechanism of diclofenac during the adsorption, we additionally employed the Weber–Morris intraparticle diffusion model to analyze the kinetic data. The intraparticle diffusion model, derived from the Fick's second law of diffusion, is typically expressed as follows (eqn (4)):43,44
| qt = kP,it0.5 + C | (4) |
Besides, rate constants at each stage are also summarized in Table S1† and kP,1 is much higher than kP,2 at each temperature, revealing that the diffusion rate of diclofenac from the bulk phase to the surface of ZIF-67 was much faster than that from the external surface to pores within CTAB-ZIF-67. Besides, we also found that kP,1 became larger when the temperature increased, demonstrating the faster mass transfer at elevated temperatures.
3.4 Adsorption isotherm of diclofenac to ZIF-67
Adsorption isotherm of diclofenac to CTAB-ZIF-67 can be seen in Fig. 5(b) and qe approaches to a higher value at the elevated temperature. To analyze the adsorption isotherm, we first employed the Langmuir isotherm model as follows (eqn (5)):
 | (5) |
| Temp. (°C) | Langmuir | Freundlich | Temkin | Dubinin–Radushkevich | ||||||||
|---|---|---|---|---|---|---|---|---|---|---|---|---|
| qmax (mg g−1) | KL (L mg−1) | RL2 | KF (mg g−1) (L mg−1)1/n | n | RF2 | KT (J g−1) | B (J mol−1) | RT2 | qd (mg g−1) | Kad × 106 (mol2 kJ−1) | RDR2 | |
| 20 | 43.95 | 0.624 | 0.993 | 20.2 | 3.89 | 0.992 | 10.18 | 308 | 0.991 | 37.35 | 0.22 | 0.900 |
| 30 | 54.31 | 0.908 | 0.987 | 26.60 | 3.69 | 0.983 | 13.13 | 243 | 0.982 | 46.35 | 0.13 | 0.932 |
| 40 | 60.58 | 1.783 | 0.986 | 35.07 | 3.92 | 0.982 | 29.57 | 230 | 0.990 | 52.67 | 0.052 | 0.934 |
Next, the Freundlich isotherm was employed to model the adsorption isotherm and the Freundlich isotherm can be expressed as follows (eqn (6)):
 | (6) |
In addition, the Temkin isotherm was also employed to model the adsorption isotherm. In the Temkin isotherm model, the interaction between adsorbate and adsorbent can be expressed by the adsorption energy associated with the surface coverage. Thus, the Temkin isotherm can be expressed in the following equation (eqn (7)):
 | (7) |
![[thin space (1/6-em)]](https://www.rsc.org/images/entities/char_2009.gif) Ce versus qe of the adsorption isotherm can be seen in Fig. S5(a) (ESI†) and the data points are fitted by the linear regression using the eqn (7). The data points can be properly fitted by the linear regression, also indicating that an strong affinity exists between diclofenac and CTAB-ZIF-67.
Ce versus qe of the adsorption isotherm can be seen in Fig. S5(a) (ESI†) and the data points are fitted by the linear regression using the eqn (7). The data points can be properly fitted by the linear regression, also indicating that an strong affinity exists between diclofenac and CTAB-ZIF-67.
To further investigate whether the adsorption of diclofenac to CTAB-ZIF-67 was associated with the physisorption, we additionally selected the Dubinin–Radushkevich (D–R) isotherm, in which adsorption is in the form of multiple-layer adsorption due to the van der Waals force. Typically, the D–R can be described as follows (eqn (8)):
ln![[thin space (1/6-em)]](https://www.rsc.org/images/entities/char_2009.gif) qe = ln qe = ln![[thin space (1/6-em)]](https://www.rsc.org/images/entities/char_2009.gif) qd − βε2 qd − βε2
| (8) |
![[thin space (1/6-em)]](https://www.rsc.org/images/entities/char_2009.gif) ln(1 + 1/Ce). Fig. S5(b)† reveals plots of ln
ln(1 + 1/Ce). Fig. S5(b)† reveals plots of ln![[thin space (1/6-em)]](https://www.rsc.org/images/entities/char_2009.gif) qe versus ε2. It can be readily found that the data points are not well-represented by the linear fitting and the corresponding correlation coefficients are much lower compared to the afore-mentioned isotherm model.
qe versus ε2. It can be readily found that the data points are not well-represented by the linear fitting and the corresponding correlation coefficients are much lower compared to the afore-mentioned isotherm model.
These modeling results suggest that the adsorption of diclofenac to CTAB-ZIF-67 involved a strong affinity between diclofenac and CTAB-ZIF-67, which could be attributed to the electrostatic attraction between the carboxylic acid of diclofenac and the quaternary amine of CTAB.
3.5 Activation energy and thermodynamic parameters of the diclofenac adsorption to CTAB-ZIF-67
To obtain the activation energy (Ea) of the diclofenac adsorption, the reaction rate constants (i.e., k2) at various temperatures were used according to the following equation (eqn (9)):
ln![[thin space (1/6-em)]](https://www.rsc.org/images/entities/char_2009.gif) k2 = ln k2 = ln![[thin space (1/6-em)]](https://www.rsc.org/images/entities/char_2009.gif) k − Ea/RT k − Ea/RT
| (9) |
ΔG° = −RT ln![[thin space (1/6-em)]](https://www.rsc.org/images/entities/char_2009.gif) KL KL
| (10) |
| ΔG° = ΔH° − TΔS° | (11) |
| Ea (kJ mol−1) | K (g mg−1 min−1) | Temp. (K) | ΔG° (kJ mol−1) | ΔH° (kJ mol−1) | ΔS° (kJ mol−1 K−1) |
|---|---|---|---|---|---|
| 20.1 | 0.024 | 293 | −29.53 | 40 | 0.24 |
| 303 | −31.5 | ||||
| 313 | −34.29 |
Table 3 summaries ΔG° values at different temperatures, which are all negative, indicating that the diclofenac adsorption to CTAB-ZIF-67 can occur spontaneously. A plot of ΔG° versus T can be seen in Fig. S6(b).† ΔH° and ΔS° of the adsorption can be then determined by the intercept and slope of the linear regression result and listed in Table 3. Considering the positive value of ΔH°, the diclofenac adsorption to CTAB-ZIF-67 was an endothermic as observed in the adsorption kinetics and isotherm. The positive ΔS° also suggests that an affinity existed between diclofenac and CTAB-ZIF-67, which might be the electrostatic attraction as discussed earlier.
3.6 Effects of pH and co-existing ions on the adsorption capacity
Considering that pH of wastewater typically can vary from 4 to 9,53 the effect of pH on the diclofenac adsorption was therefore investigated as seen in Fig. 6(a). It can be seen that the qe remained quite stable in the range of pH = 5–10 and a slight decrease can be noticed when pH changed to 4. The decrease in qe at pH = 4 might be due to that excess of H+ in water protonated diclofenac and lessened the electrostatic attraction between diclofenac and CTAB-ZIF-67. However, overall the effect of pH was not significant on the adsorption capacity.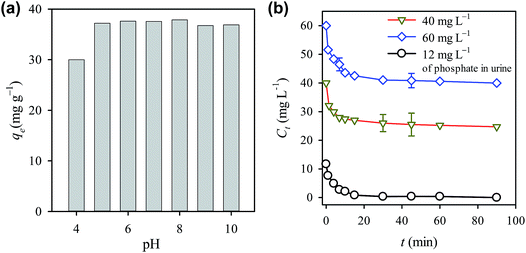 | ||
| Fig. 6 Effects of (a) pH and (b) co-existing ions from urine on the diclofenac adsorption using CTAB-ZIF-67. | ||
On the other hand, wastewater also contains other compounds which may interfere with the adsorption. To examine the effect of co-existing ions, urine was particularly selected as a matrix containing diclofenac because the separation of diclofenac from urine has become of great interest recently.29 Fig. 6(b) shows the adsorption of diclofenac to CTAB-ZIF-67 from the simulated fresh urine. When C0 = 40 mg L−1, around 15 mg L−1 of diclofenac was remove at equilibrium. Compared to the removal of diclofenac from DI water (i.e., 25 mg L−1), the adsorption was indeed affected by the complex composition of urine, including salts and urea. Since urine contains a relative high amount of phosphate (i.e., 12 mg L−1), variation of phosphate during the diclofenac adsorption was also shown in Fig. 6(b). It can be found that phosphate was completely removed in the end of the adsorption, showing that a strong competition adsorption occurred between diclofenac and other anions.
3.7 Recyclability and desorption behavior of diclofenac from CTAB-ZIF-67
In this study, recyclability of CTAB-ZIF-67 was also evaluated. Considering that the presence of salts could interfere with the adsorption, the spent CTAB-ZIF-67 was regenerated by washing with a concentrated sodium chloride solution. In order to conveniently regenerate the spent CTAB-ZIF-67, we also employed an acidic ion-exchange (I.E.) resin to desorb diclofenac. The recyclability result can be seen in Fig. 7(a), in which the adsorption capacities of CTAB-ZIF-67 regenerated by the NaCl solution and I.E. resin are 75% and 53%, respectively, of the capacity obtained using the pristine CTAB-ZIF-67, showing that the regeneration was not complete and diclofenac might be still in CTAB-ZIF-67. The difference between the NaCl solution and I.E. resin might be due to that mass concentrations of NaCl and I.E. resin added to solutions were equal but the amount of active sites in the NaCl solution was much more than that in the I.E. resin solution. Since the regeneration using the NaCl solution and I.E. resin only proceeded for 2 h, we additionally investigated desorption behavior of diclofenac from CTAB-ZIF-67 using in the presence of NaCl and I.E. resin as shown in Fig. 7(b). When DI water alone was used to regenerate CTAB-ZIF-67, the desorption kinetics was significantly slow even though DI water was also able to desorb diclofenac. Once the I.E. resin was added, the desorption kinetics became significant faster, indicating that the I.E. resin was able to desorb diclofenac from CTAB-ZIF-67. Furthermore, in the presence of NaCl, the desorption kinetics became even faster. The NaCl solution was much more effective than the I.E. resin to regenerate CTAB-ZIF-67 as we observed that the recyclability from the regeneration using the NaCl solution was higher than using the I.E. resin. Despite that the concentrated NaCl was relatively effective to desorb diclofenac, alternative intense methods may be required to regenerate the spent CTAB-ZIF-67, such as elevated temperature and sonication.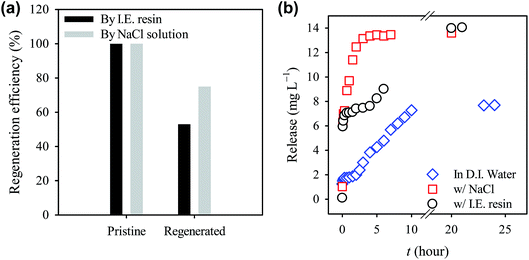 | ||
| Fig. 7 Effect of regeneration methods on (a) recyclability and (b) desorption behavior of diclofenac from CTAB-ZIF-67 at 30 °C. | ||
Although the XRD pattern of CTAB-ZIF-67 remained almost the same after the diclofenac adsorption, it is still essential to investigate whether Co2+ leached out from CTAB-ZIF-67. Fig. S7† shows the release of Co2+ from CTAB-ZIF-67 during adsorption. The amount of Co2+ released from CTAB-ZIF-67 was found to be only ∼0.08 wt%, indicating that the Co2+ leached out from CTAB-ZIF-67 was insignificant. This also validates that ZIF-67 was highly stable in aqueous environment under the testing condition. Fig. S7† also shows the release of Co2+ during the desorption process in the presence of 5 wt% of NaCl and 5 wt% of I.E. resin. It can be seen that even though with 5 wt% of NaCl, the release of Co2+ was still around 0.1 wt%, whereas it became 0.05 wt% in the presence of I.E. resin. This suggests that CTAB-ZIF-67 remained intact without significant decomposition during the desorption process.
4. Conclusion
In this study, ZIF-67 was successfully functionalized with CTAB. The resultant CTAB-ZIF-67, regardless of CTAB loading, still can exhibit similar crystallinity and chemical composition to the pristine ZIF-67. CTAB-ZIF-67 was found to exhibit more positive surface charge and therefore enhanced the diclofenac adsorption. Although the presence of CTAB enhanced the diclofenac adsorption up to 10 times, a certain loading of CTAB (0.274 mol-CTAB/mol-Co2+) could lead to the most efficient enhancement, probably because over loading of CTAB was not fully incorporated into ZIF-67. The adsorption kinetics and isotherm were also measured and analyzed using rate law and isotherm models. The diclofenac adsorption to CTAB-ZIF-67 was more preferable at the elevated temperatures. The adsorption was also considered to involve with a strong affinity between diclofenac and CTAB-ZIF-67, which might be the electrostatic effect. While the effect of pH was insignificant, the effect of co-existing compounds (e.g., salts) noticeably hindered the adsorption. However, CTAB-ZIF-67 was still able to remove diclofenac from urine. The desorption behaviors of diclofenac from the spent CTAB-ZIF-67 in the presence of NaCl and I.E. resin were also investigated and the concentrated NaCl solution was proven to be a more effective method to regenerate CTAB-ZIF-67, thereby improving its recyclability.Acknowledgements
The authors are grateful for the experimental assistance on the AA analysis provided by Mr Hsuan-Ang Chang.References
- J. L. Sotelo, G. Ovejero, A. Rodríguez, S. Álvarez, J. Galán and J. García, Chem. Eng. J., 2014, 240, 443–453 CrossRef CAS PubMed.
- C.-M. Dai, S.-U. Geissen, Y.-L. Zhang, Y.-J. Zhang and X.-F. Zhou, Environ. Pollut., 2011, 159, 1660–1666 CrossRef CAS PubMed.
- T. Heberer, Toxicol. Lett., 2002, 131, 5–17 CrossRef CAS.
- S. Mompelat, B. le Bot and O. Thomas, Environ. Int., 2009, 35, 803–814 CrossRef CAS PubMed.
- M. Letzel, G. Metzner and T. Letzel, Environ. Int., 2009, 35, 363–368 CrossRef CAS PubMed.
- S. Webb, T. Ternes, M. Gibert and K. Olejniczak, Toxicol. Lett., 2003, 142, 157–167 CrossRef CAS.
- T. Heberer, J. Hydrol., 2002, 266, 175–189 CrossRef CAS.
- J. Schwaiger, H. Ferling, U. Mallow, H. Wintermayr and R. D. Negele, Aquat. Toxicol., 2004, 68, 141–150 CrossRef CAS PubMed.
- J. L. Oaks, M. Gilbert, M. Z. Virani, R. T. Watson, C. U. Meteyer, B. A. Rideout, H. L. Shivaprasad, S. Ahmed, M. J. Iqbal Chaudhry, M. Arshad, S. Mahmood, A. Ali and A. Ahmed Khan, Nature, 2004, 427, 630–633 CrossRef CAS PubMed.
- J. Hofmann, U. Freier, M. Wecks and S. Hohmann, Appl. Catal., B, 2007, 70, 447–451 CrossRef CAS PubMed.
- D. Vogna, R. Marotta, A. Napolitano, R. Andreozzi and M. D'Ischia, Water Res., 2004, 38, 414–422 CrossRef CAS PubMed.
- F. J. Beltrán, P. Pocostales, P. Alvarez and A. Oropesa, J. Hazard. Mater., 2009, 163, 768–776 CrossRef PubMed.
- S. Kommineni, J. Zoeckler, A. Stocking, S. Liang, A. Flores and M. Kavanaugh, in Treatment technologies for removal of methyl tertiary butyl ether (MTBE) from drinking water: Air Stripping, Advanced Oxidation Proess, Granular Activated Carbon, Synthetic Resin Sorbents, ed. G. Melin, National Water Research Institute, Fountain Valley, 2nd edn, 2000, ch. 3, pp. 111–208 Search PubMed.
- M. N. Rashed, Adsorption Technique for the Removal of Organic Pollutants from Water and Wastewater, 2013 Search PubMed.
- J. W. Yoon, S. H. Jhung, Y. K. Hwang, S. M. Humphrey, P. T. Wood and J. S. Chang, Adv. Mater., 2007, 19, 1830–1834 CrossRef CAS PubMed.
- J.-R. Li, Y. Ma, M. C. McCarthy, J. Sculley, J. Yu, H.-K. Jeong, P. B. Balbuena and H.-C. Zhou, Coord. Chem. Rev., 2011, 255, 1791–1823 CrossRef CAS PubMed.
- J.-R. Li, R. J. Kuppler and H.-C. Zhou, Chem. Soc. Rev., 2009, 38, 1477–1504 RSC.
- N. L. Rosi, J. Eckert, M. Eddaoudi, D. T. Vodak, J. Kim, M. O'Keeffe and O. M. Yaghi, Science, 2003, 300, 1127–1129 CrossRef CAS PubMed.
- P. Horcajada, T. Chalati, C. Serre, B. Gillet, C. Sebrie, T. Baati, J. F. Eubank, D. Heurtaux, P. Clayette, C. Kreuz, J.-S. Chang, Y. K. Hwang, V. Marsaud, P.-N. Bories, L. Cynober, S. Gil, G. Ferey, P. Couvreur and R. Gref, Nat. Mater., 2010, 9, 172–178 CrossRef CAS PubMed.
- L.-G. Qiu, Z.-Q. Li, Y. Wu, W. Wang, T. Xu and X. Jiang, Chem. Commun., 2008, 3642–3644, 10.1039/b804126a.
- K.-Y. A. Lin, H. Yang, C. Petit and F.-K. Hsu, Chem. Eng. J., 2014, 249, 293–301 CrossRef CAS PubMed.
- N. A. Khan, B. K. Jung, Z. Hasan and S. H. Jhung, J. Hazard. Mater., 2015, 282, 194–200 CrossRef CAS PubMed.
- B. K. Jung, Z. Hasan and S. H. Jhung, Chem. Eng. J., 2013, 234, 99–105 CrossRef CAS PubMed.
- K.-Y. A. Lin and H.-A. Chang, Chemosphere, 2015, 139, 624–631 CrossRef CAS PubMed.
- K. S. Park, Z. Ni, A. P. Côté, J. Y. Choi, R. Huang, F. J. Uribe-Romo, H. K. Chae, M. O'Keeffe and O. M. Yaghi, Proc. Natl. Acad. Sci. U. S. A., 2006, 103, 10186–10191 CrossRef CAS PubMed.
- K.-Y. A. Lin and H.-A. Chang, Water, Air, Soil Pollut., 2015, 226, 10 CrossRef.
- X.-Z. Kang, Z.-W. Song, Q. Shi and J.-X. Dong, Asian J. Chem., 2013, 25, 8324–8328 CrossRef CAS.
- J. Yao, M. He, K. Wang, R. Chen, Z. Zhong and H. Wang, CrystEngComm, 2013, 15, 3601–3606 RSC.
- K. A. Landry and T. H. Boyer, Water Res., 2013, 47, 6432–6444 CrossRef CAS PubMed.
- A. A. Gouda, M. I. Kotb El-Sayed, A. S. Amin and R. El Sheikh, Arabian J. Chem., 2013, 6, 145–163 CrossRef CAS PubMed.
- J. Lienert, K. Güdel and B. I. Escher, Environ. Sci. Technol., 2007, 41, 4471–4478 CrossRef CAS.
- S.-H. Hsu, C.-T. Li, H.-T. Chien, R. R. Salunkhe, N. Suzuki, Y. Yamauchi, K.-C. Ho and K. C. W. Wu, Sci. Rep., 2014, 4, 6983 CrossRef CAS PubMed.
- A. F. Gross, E. Sherman and J. J. Vajo, Dalton Trans., 2012, 41, 5458–5460 RSC.
- M. He, J. Yao, Q. Liu, K. Wang, F. Chen and H. Wang, Microporous Mesoporous Mater., 2014, 184, 55–60 CrossRef CAS PubMed.
- J. Yao, R. Chen, K. Wang and H. Wang, Microporous Mesoporous Mater., 2013, 165, 200–204 CrossRef CAS PubMed.
- R. B. Viana, A. B. F. da Silva and A. S. Pimentel, Adv. Phys. Chem., 2012, 2012, 14 Search PubMed.
- I. B. Vasconcelos, T. G. D. Silva, G. C. G. Militao, T. A. Soares, N. M. Rodrigues, M. O. Rodrigues, N. B. D. Costa, R. O. Freire and S. A. Junior, RSC Adv., 2012, 2, 9437–9442 RSC.
- A. Schejn, L. Balan, V. Falk, L. Aranda, G. Medjahdi and R. Schneider, CrystEngComm, 2014, 16, 4493–4500 RSC.
- N. Wang, Q. Fang, E. Chen, J. Zhang and Y. Shao, Polym. Eng. Sci., 2009, 49, 2459–2466 CAS.
- K.-Y. Andrew Lin, Y. Park, C. Petit and A.-H. A. Park, RSC Adv., 2014, 4, 65195–65204 RSC.
- E.-X. Chen, H. Yang and J. Zhang, Inorg. Chem., 2014, 53, 5411–5413 CrossRef CAS PubMed.
- Z. Hasan and S. H. Jhung, J. Hazard. Mater., 2015, 283, 329–339 CrossRef CAS PubMed.
- N. Kannan and M. M. Sundaram, Dyes Pigm., 2001, 51, 25–40 CrossRef CAS.
- J. Chen, Y. Cai, M. Clark and Y. Yu, PLoS One, 2013, 8, e60243 CAS.
- F.-C. Wu, R.-L. Tseng and R.-S. Juang, Water Res., 2001, 35, 613–618 CrossRef CAS.
- I. D. Mall, V. C. Srivastava, N. K. Agarwal and I. M. Mishra, Chemosphere, 2005, 61, 492–501 CrossRef CAS PubMed.
- W. H. Cheung, Y. S. Szeto and G. McKay, Bioresour. Technol., 2007, 98, 2897–2904 CrossRef CAS PubMed.
- P. Luo, Y. Zhao, B. Zhang, J. Liu, Y. Yang and J. Liu, Water Res., 2010, 44, 1489–1497 CrossRef CAS PubMed.
- R. Han, P. Han, Z. Cai, Z. Zhao and M. Tang, J. Environ. Sci., 2008, 20, 1035–1041 CrossRef CAS.
- X. Yu, G. Zhang, C. Xie, Y. Yu, T. Cheng and Q. Zhou, BioResources, 2011, 6, 936–949 CAS.
- Z. Cheng, X. Liu, M. Han and W. Ma, J. Hazard. Mater., 2010, 182, 408–415 CrossRef CAS PubMed.
- J. Lin, Y. Zhan and Z. Zhu, Colloids Surf., A, 2011, 384, 9–16 CrossRef CAS PubMed.
- T. Zhang, H. Liu and H. H. P. Fang, J. Environ. Manage., 2003, 69, 149–156 CrossRef.
Footnote |
| † Electronic supplementary information (ESI) available. See DOI: 10.1039/c5ra08189k |
| This journal is © The Royal Society of Chemistry 2015 |

