Nanocomposites of graphene/polymers: a review

W. K. Cheea, H. N. Lim*ab, N. M. Huangc and I. Harrisond
aDepartment of Chemistry, Faculty of Science, Universiti Putra Malaysia, 43400 UPM Serdang, Selangor, Malaysia. E-mail: janetlimhn@gmail.com; Tel: +60 1 6330 1609
bFunctional Device Laboratory, Institute of Advanced Technology, Universiti Putra Malaysia, 43400 UPM Serdang, Selangor, Malaysia
cLow Dimension Materials Research Centre, Department of Physics, Faculty of Science, University of Malaya, Kuala Lumpur 50603, Malaysia
dFaculty of Engineering, The University of Nottingham Malaysia Campus, Jalan Broga, 43500 Semenyih, Selangor, Malaysia

Received 30th April 2015 , Accepted 30th July 2015

First published on 30th July 2015


Abstract

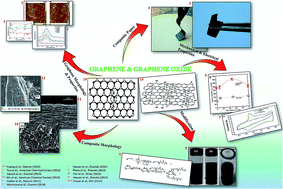
This paper essentially reviews the types of graphene-based nanofillers and the fabrication of graphene/polymer nanocomposites. Routes to produce graphene materials, along with the methods and modifications used to efficiently disperse graphene nanofillers within the polymer matrices are discussed. In addition, the mechanical properties, morphological, structural, electrical conductivities, electrochemical activities, thermal stabilities, and gas barrier properties are evaluated, along with the direct relationships of these properties with the graphene–polymer interactions and their dispersion in the polymer matrix. Finally, a brief summary of the practical applications of polymeric-graphene materials along with the current trends in the field is presented to progressively show future prospects for the development of these materials.

1. Introduction

Graphene and graphene oxide (GO) have been widely studied for use in a variety of applications because of their excellent electrical conductivity and superb mechanical properties.1 These properties arise from the two-dimensional crystallographic nature of graphene: a one-atom thick sheet of sp2 bonded carbon atoms packed in a honeycomb crystal structure (see Fig. 1a).2 The theoretical tensile strength and Young's modulus of graphene have been measured to be 130 GPa and 1.0 TPa, respectively.3 The tensile strength of graphene is therefore much higher than that of nano-sized steel or carbon nanotubes (CNT). The measured electrical and thermal conductivities are approximately 7200 S m−1 and4 1800 W m−1 K−1, respectively.5,6 Although individual CNT also possessed very high electrical and thermal conductivity (1[thin space (1/6-em)]000[thin space (1/6-em)]000 S m−1 and 2500 W m−1 K−1 specifically), the properties of bulk material heavily depended on how the CNTs are organized.7 The specific control over the position of CNT is often difficult due to intrinsic difficulties in handling individual nanotubes. Therefore, these properties along with the large specific area (2630 m2 g−1) and the ability to modify the behavior of the underlying graphene by the use of polymer composites, have integrated this material in energy storage systems, biological or physical sensors, and biomedical applications.8
image file: c5ra07989f-f1.tif
Fig. 1 (a) Schematic diagram of graphene crystal structure. Reproduced with permission from ref. 2 (Copyright (2010) Wiley) and (b) Lerf–Klinowski model of graphene oxide. Reproduced with permission from ref. 1 (Copyright (2010) RSC).

Generally, graphene oxide is produced using the method of Brodie,9 Staudenmaier,10 or Hummer.11 All three methods involve an oxidation reaction of graphite, followed by the exfoliation. The exact chemical form of graphite oxide is unknown, but it is widely accepted that graphite oxide has oxygen functional groups that are responsible for its hydrophilic characteristics and allow it to be exfoliated to form graphene oxide (Fig. 1b) in many polar solvents. The formation of graphene platelets, or more exactly reduced graphene oxide, requires a reduction process. Several methods have been reported in the literature, including chemical reduction using reducing agents,12,13 thermal treatment,14–16 and electro-chemical reduction.17,18 The oxygen function groups remaining on the graphene platelet after the reduction step will have a significant effect on its properties. Consequently, the process of forming graphene platelets is still an active research area.

Polymers are an important class of materials in today's society; they are relatively cheap and easy to process.19 Common synthetic polymers include polyolefin (polyethylene, polypropylene, etc.), polycarbonate, poly(methyl methacrylate), polyimide, poly(vinyl alcohol), and polyurethane. However, their physical properties limit their application in some areas. The incorporation of graphene into polymeric chains can improve the mechanical or electronic properties. For example, graphene has been used to enhance the mechanical strength12,20,21 of polymers, as well as to impart electrical conductivities,16,22,23 enhance their thermal stabilities,24,25 improve their electrochemical activity,26–28 as well as impart gas barrier properties29,30 whereby the significant impact of graphene addition was discussed in detail in a very recent review article by Xu et al.31 Although synthetic polymers are widely used, they have a significant negative environmental impact because they are not biodegradable, and often the base chemicals are derived from petroleum. For example, the worldwide use of polyolefin has been reported to produce a total of approximately 140 million tons of industrial waste products each year.32 To overcome these environmental concerns, natural polymers are now being investigated as replacements for synthetic non-degradable plastics. The common matrices used to manufacture natural polymers are polysaccharides, proteins, lipids such as fats and oils, polyesters from microorganisms (PHA), chitosan, cellulose, lignin, and those derived from natural monomers such as poly(lactic acid).33 However, these polymers often have inferior properties compared to synthetic polymers. Thus, the inclusion of graphene is able to achieve enhanced performance of the main polymer matrices.

The increased use of battery-operated appliances in both the commercial and industrial fields has resulted in the search for more effective ways of harvesting energy from the environment, storing energy for later use, delivering power, and improving energy efficiency. Besides being used as a replacement for the semiconductor diode in a solar cell, conducting polymers have specific applications in electrochemical cells, for both energy storage (batteries) and power delivery (supercapacitors).34,35 Common types of conducting polymers include polypyrrole (PPy), polyacetylene (PAC), polyaniline (PANI), and poly(3,4-ethylenedioxythiophene) (PEDOT).36–42 Although these are conducting polymers, their resistivity is too high for some applications. Graphene can be incorporated as an ideal conductive additive into the polymer matrix to further boost the conductivity, in addition to providing mechanical benefits towards the composite structure.

Furthermore, numerous articles also reported the incorporation of inorganic materials (mainly metal oxides) or direct synthesis of graphene-based composites with functional polymers and inorganic nanostructures. The development of such specific advanced composites materials were targeted in application of energy storage system including Li-ion batteries and supercapacitors, or even the energy system such as photovoltaic devices and photocatalysis. These scopes were well-addressed in the review articles by Huang et al.43 and Chen et al.,44 respectively from the standpoint of electrochemistry. It significantly discussed the up-to-date synthesis techniques, along with the electron transfer properties, involving the electronic structure and electron transport within the graphene/composites nanostructure.

Most of the literature published on polymer/graphene nanocomposites has reported significant improvements in the mechanical, thermal, and electrical activities, as well as the conductivities and gas barrier properties, compared to the neat polymer. This positive change even occurs with a small amount of graphene filler.21,29,45–48 However, the improvement relies heavily on the distribution of the graphene within the polymer matrix, as well as the interfacial bonding between the graphene and the host matrix. The distribution of the graphene within the polymer is significantly affected by the polarity of the polymeric backbone. A hydrophilic polymer may cause the graphene layers to aggregate because of the interactions between the graphene layers and the hydrophilic polymer chains. In contrast, graphene oxide sheets, which have oxygen functional groups heavily bonded to the surface, are more compatible with organic polymers.49–52 However, graphene oxide is not suitable for electrical applications because of its electrical insulating properties. Consequently, to enhance the electrical conductivity of polymers, surface modification of the graphene may be required to ensure a homogeneous dispersion of individual graphene sheets in the polymer matrix.

2. Polymeric-based graphene/graphene oxide nanocomposites

2.1 Preparation methods

2.1.1 Solution cast technique. Mainly because of its simplicity, the solution casting technique is one of the most commonly practiced methods used to manufacture uniformly dispersed nanocomposites. Prior to dissolving it in the polymer solution, the graphene is dispersed within a solvent by sonication. The solvent is then removed by evaporation at either an elevated or ambient temperature. The obtained nanocomposite film is washed with water to remove any residual solvent and further dried. The solvent chosen must be capable of dissolving the host polymer and be volatile to encourage fast evaporation. In the preparation of PLA/graphene nanocomposite,53 the host polymer matrix was dissolved in chloroform, while graphene was pre-dispersed in chloroform using sonication technique. Both the polymer and dispersed graphene was mixed via stirring and casted on polytetrafluoroethylene (PTFE) mold. Because of the volatility of chloroform, the solvent was left evaporated at room temperature, followed by vacuum dried at elevated temperature to remove any residual solvents. Additionally, other literatures which utilized similar technique were further reported in this article.13,54–56
2.1.2 Melt blending technique. Melt blending is another fast and common option used to prepare nanocomposite film. This technique relies heavily on the dis-entanglement of polymer structure during their molten phase. Therefore, the polymer chains are free moving and completely mixed during the melting phase of the polymer. However, the main shortcoming of this technique is on the introduction of solid organic/inorganic particles into the polymeric phase, particularly when the solid materials having opposite surface characteristic to that of the main matrix. Therefore, several attempts were focused on the surface functionalization (covalent/non-covalent bonding) towards the particles to achieve better compatibilization between the two-phase system.57 For instance, the poor distribution of graphene layers within the polymer matrix, caused by the strong force between graphene sheets and the high viscosity of polymers, is overcome by functionalizing graphene sheets with oxygen and hydroxyl functionalities to encourage better interactions between the components.23
2.1.3 In situ polymerization. Graphene/polymer nanocomposites are commonly synthesized using in situ polymerization. The monomer and graphene precursors are initially dissolved in a common solvent and ultrasonicated to achieve a uniform dispersion. An initiator is then added to the mixture to form the polymer. This particular technique can be expanded or varied to form a very wide range of categories and classifications, depending on the type of desired end product, as well as the selected synthesis routes. For instance, a free-radical initiator and reducing agent can be added simultaneously to induce polymerization and at the same time reduce GO to graphene, or achieve ordered layer structure of the desired composites.58–60 On the other hand, emulsion polymerization is another type of commonly applied in situ polymerization technique which differs only at the stage where the formation of the final desired product is in an emulsion form. The advantages of this strategy include its ease of manipulation, simplicity, scalability, low cost, and lower environmental concern.61 Even though various types of emulsion polymerization techniques have been reported and described elsewhere, the common approach is a microemulsion technique in which the final product produces thermodynamically stable polymer particles on the scale of tens of nanometers.62 Furthermore, additional additives such as surfactants are added to achieve enhanced dispersion of the dispersed components in the continuous matrix or solution, hence creating a fine and evenly dispersed graphene/polymer particles to form a stable microemulsion.
2.1.4 Electrospinning. Electrospinning can be used to prepare fine composite nano-fibers with average diameters from the nanometer to micrometer range.63 The preparation of the precursor mixture involves dissolving the polymer matrices and graphene in a solvent (commonly N,N-dimethylformamide, DMF). The mixture is then electrospun by applying a high positive voltage (5–20 kV) on a syringe needle. During the typical process, the polymer solution held by its surface tension at the end of the syringe needle is subjected to a high-voltage field, whereby a charge is induced on the liquid surface as a result of the high voltage applied, and the mutual charge repulsion induces a force directly opposite to the surface tension.64 As the voltage increases, the hemispherical surface at the tip of the needle eventually elongates and forms a Taylor cone.65 When a critical voltage value is reached, the repulsive force overcomes the surface tension of the solution, and a charged jet of the solution is ejected from the tip of the Taylor cone itself. The high-voltage application leads to the formation of ultra-fine composite fibers with diameters in the micrometer to nanometer range,66 which are electrospun as the solvent evaporates when the jet travels in air, leaving behind the polymer fibers on the collector. The electrospun fibers present interesting properties such as a high surface/volume ratio, leading to a low density and high pore volume, and outstanding mechanical strength. However, the process parameters, as well as the choice of system, including the type and molecular weight of the polymer, polymer viscosity, solvent used, voltage applied, needle to collector distance, and the polymer flow rate often play crucial roles in achieving the desired properties in the nanofibers produced.67,68
2.1.5 Electro-deposition. Electro-deposition is a simple and fast approach to prepare nanocomposites using electrochemical reactions. The process involves the electro-polymerization of a polymer/graphene composite from an aqueous precursor solution of the monomer, doping agent (if needed), and graphene oxide. Usually the electro-deposition cell has three electrodes: a working electrode onto which the layer is deposited, reference electrode, and counter electrode, which is usually made of platinum. The working electrode consists of an electrical conductive material or substrate (GCE or ITO glass). The electro-deposition of the polymer occurs at a specific potential and stops when an appropriate amount of charge has passed. As a result, a nanocomposite film is formed on the surface of the conductive material.

2.2 Modification techniques for graphene and graphene oxide

2.2.1 Grafting. In the preparation of graphene or graphene oxide-based nanocomposites, the interface of the graphene material and host polymer matrix plays a significant role in determining the final properties of the products formed. Therefore, grafting technique is commonly utilized to introduce functional groups on the surface of the graphene and graphene oxide, which then acted as a compatibilizing or anchoring agent to improve the interfacial adhesion of the immiscible components, and consequently increase the compatibility and dispersion of the graphene materials within the main matrix. Generally, numerous types of monomers have been utilized in grafting technique,52,55,69–71 with the selection of monomers based solely on the polarity and types of functional groups present on the surface of the polymer matrix.
2.2.2 Atom transfer radical polymerization (ATRP). Specifically, ATRP is one of the most utilized grafting techniques to achieve purely surface functionalization using a polymer-initiated technique. This is because the technique provides good control of the overall polymer molecular weight, polydispersity, and composition. In addition, the experiment is often straightforward.72 Classified as one of the controlled radical polymerization technique, it is an effective approach in achieving precise and well-controlled modification of GO or graphene with polymeric chains.73 In the preparation of polymer/graphene-based composites, the graphene material is pre-functionalized to provide active sites for surface polymerization to occur. The modified graphene material is then mixed with monomers, and the process is completed by stirring at room temperature for a certain amount of time to obtain the final yield. The final product obtained is rather different from that of a physical blending method, in which the mixed components cannot be physically separated via filtration or washing.74 However, this method is currently applied only for small-scale synthesis (in milligrams on a graphene material basis).
2.2.3 Other radical polymerization techniques. Other controlled radical polymerization techniques include reversible addition–fragmentation chain transfer polymerization (RAFT), single-electron transfer living radical polymerization (SET-LRP) and nitroxide-mediated radical polymerization (NMRP). RAFT polymerization technique relies mainly on the degenerative chain transfer, i.e. converting dormant chains to active propagating radicals during a free-radical reaction which depends on the high transfer coefficients of thiocarbonylthio compounds and trithiocarbonates.73 This technique is commonly utilized to functionalize GO with polymer chains via grafting-from approaches, at which the GO is pre-modified with a RAFT initiator in the polymerization step.75,76 SET-LRP is also referred to Cu(0)-mediated radical polymerization as the entire polymerization process feature the disproportionation of Cu(I) in a suitable solvent, resulting in the formation of Cu(0) and Cu(II). Cu(0) is responsible towards the activation process due to the effect of reaction with alkyl halide, whereas deactivation occurs via reaction with Cu(II). The high end group fidelity generated is a huge advantage when utilizing SET-LRP to grow chains on the GO surface77,78 as the polymerization process is complete with full monomer conversion (high efficiency). Unlike others, NMRP technique is not frequently used in modification of graphene/GO. It utilizes the use of free-radical initiator and a nitrone to pre-synthesize polymeric chains end-capped with nitroxide, which subsequently reacted with GO sheets under elevated temperature and stirring. This causes the dissociation of alkoxyamine C–O bonds and generates PMMA radicals towards the double bonds of GO sheets.
2.2.4 Condensation techniques. The condensation technique is one of the most common methods in the synthesis of polymeric chains. In the effort of GO functionalization, the choice of monomers is limited to the extent that a condensation reaction is possible to occur between the monomers and functional groups present on the surface of GO. In a mixture of GO/monomers dispersion, an initiator is added at elevated temperature for propagation of polymeric chains along with consumption of monomers.79 Simultaneously, part of the protonated polymeric chains are immobilized onto the GO sheets as the effect of condensation reactions occurred.80 The growth of polymeric chains continue as long as the monomers are available in the mixture.

2.3 Summary of previous works

As discussed in the previous sections, there are a variety of methods used to deposit polymeric-based graphene nanocomposites. The previous results are summarized in Table 1.
Table 1 Summary of polymer types, nanofiller, and preparation methods for graphene/polymer-based nanocomposites
Matrix polymer Filler type Method References
Natural polymers
Cellulose Graphene Solution cast 81
Chitosan/oxide GO Solution cast 51 and 82
[thin space (1/6-em)]
Starch
Starch RGO Solution mixing, filtration 83
Polysaccharide GO, keratin grafted GO Solution cast 52
PLA Graphene Solution cast 53 and 54
PLA PDLA grafted GO Solution cast 84
PLA Graphene Melt blending 21
Synthetic polymers PAN RGO Electrospinning 85
PAN GO Solution cast 86
PAN GO Electrospinning 49
PAN GO In situ polymerization 59
PC Graphene, functionalized Melt compounding 57
PC Graphene Emulsion/solution cast 87
PC Graphene Melt compounding, foamed 88
PCL Graphene Solution cast 89
PCL GO Electrospinning 90
PI GO In situ polymerization 91 and 92
PI Graphene In situ polymerization, spin casting 15
PI GO In situ polymerization, thermal treatment 93 and 94
PI GO, RGO, graphene Solution cast, thermal imidization 12, 30 and 95
PEO Graphene Melt blending 13 and 96
PEO Graphene Solution cast 13
PU MEGO Melt blending 20
PU Functionalized graphene Solution cast 22 and 97
PU Functionalized graphene Colloidal dispersion 98
PU GO In situ polymerization, solution cast 99 and 100
PU, epoxy GO In situ polymerization 101 and 102
PU/PVP Graphene Solution cast 16
PVDF RGO Solution cast 103
PVDF GO Solution cast 56
PVDF Graphene Solution cast, non-solvent diffusion 104
PMMA RGO In situ polymerization, bulk polymerization 105
PMMA RGO Solution cast 106
PMMA Graphene Sandwiched 107
PMMA GO Solution cast 108 and 109
PMMA Graphene, modified graphene In situ polymerization 24 and 110
PMMA Amine-modified graphene Dispersion polymerization/core–shell 111
PNIPAM Graphene In situ polymerization (frontal) 112
PNIPAM Graphene Polymer grafting 113
PET EG Melt compounding 114
PET Graphene Melt compounding 23 and 115
PE Graphene In situ polymerization 25
PE Functionalized RGO Solution cast 29
PE Solution cast 116
PP Graphene Solution cast 47
PS Graphene Melt blending 117 and 118
PS Graphene Solution cast 45, 117 and 119
PS Graphene In situ polymerization 62
PVA Functionalized graphene Solution cast 55
PVA PVA-grafted/sulfonated graphene Solution cast 46, 50 and 120–122
PVA GO Solvent cast/uniaxial drawing 123
[thin space (1/6-em)]
Conductive polymer
PPy Graphene In situ polymerization 58, 124 and 125
PPy GO In situ polymerization, filtration 126 and 127
PPy GO Interfacial polymerization 128
PPy RGO In situ polymerization 129
PPy GO/graphene Electro-deposition 18, 28 and 48
PANI Graphene In situ polymerization 27 and 130
PANI RGO In situ polymerization 129
PANI RGO Filtration 131
PANI RGO Micro-emulsion polymerization 132
PAC Graphene Solution cast 133
PAC Graphene In situ nitrene reaction 134
PEDOT GO Electro-deposition 135 and 136
PEDOT Graphene Chemical reduction/electro-deposition 26
PEDOT Graphene In situ polymerization/spin cast 60
PEDOT RGO In situ polymerization 129
PABS GO Amidation/chemical reduction 71


2.4 Interactions of graphene oxide and graphene with polymers

Commonly, the dispersion of fillers within the host polymer matrices is one of the most crucial parameter in determining the effectiveness of the fillers added as well as the final characteristics achieved.46 Graphene oxide, which is best known for its oxygen-rich functional groups (hydroxyl, carboxyl, epoxy, carbonyl) located on the basal plane and edges, is able to be dispersed into individual sheets in water. Therefore, a molecular level dispersion is able to be achieved, providing that a common solvent is used for both GO and the polymer matrix. In contrast, the overall performance of graphene-based composites depends heavily on the interfacial adhesion between graphene and the host matrix. While the most common interactions of graphene or graphene oxide with the polymers rely mainly on the physical bondings as the strongest possible interactions, various studies utilized the oxygen functional groups which are responsible for hydrogen bonding formation to react with polymeric molecules, as illustrated and summarized in Fig. 2.
image file: c5ra07989f-f2.tif
Fig. 2 Summary of possible interactions on the surface of (a) graphene oxide and (b) graphene.
2.4.1 Interactions of graphene oxide in polymer matrices. In hydrophilic polymers (e.g. PVA), GO easily achieves molecular dispersion due to the interactions of oxygen-containing functional groups towards the hydrophilic-based polymer chains. Additionally, the hydrogen bonding achieved between GO and the host matrix potentially enhanced the interfacial adhesion and the mechanical performance of the nanocomposite.137 Alternatively, the functional groups present on the surface of GO could be utilized by chemical functionalization and grafting to achieved maximum adhesion and compatibility by targeting towards a specific functional groups of the host polymer matrix. For instance, GO has been functionalized with keratin for specific interactions between the N–H groups from keratin and the O–H groups from chitosan.52

Nevertheless, dispersion of GO within hydrophobic polymers often made impossible due to the issue of polarity. Similar issues have been investigated in an attempt to disperse GO in non-polar organic solvents.11 The oxygenated groups tend to force GO layers to agglomerate as a result of the repelling forces between the hydrophilic and hydrophobic groups. Modifications have been attempted by introducing organic functional groups to enhance the compatibility of GO in a hydrophobic condition, such as functionalization of GO by introducing ethyl isocyanate via a ring opening mechanism of epoxy group on the surface of GO,95 in which the modified GO readily dispersed in a DMF solvent upon functionalization.

2.4.2 Interactions of graphene in polymer matrices. Unlike graphene oxide, graphene is a carbon-based sheets arranged in hexagonal planar rings without any functional groups present on the structure. The naturally hydrophobic graphene readily disperses within a hydrophobic polymer matrix through π–π stacking. Nevertheless, several polymers have unique surface characteristics which restrict graphene from dispersing evenly within the matrix, causing agglomeration of graphene sheets and subsequently gives rise to poor mechanical properties. The weak interactions of graphene with the host matrix have made the low stress transfer between the immiscible components even more pronounced, therefore often resulting in low tensile and elongation characteristics. Often the modifications are initiated mainly by utilizing the functional groups of GO, followed by the reduction of graphene oxide to form functionalized graphene. The lack of functionalities on the surface of graphene sheets limits the possibilities of modifications through chemical reactions.

The hydrophobic nature of graphene causes aggregation in most aqueous solvents due to the effect of π–π restacking of graphene layers. In order to fully utilize the potential of graphene in widespread applications, the limitation of inherent solubility of graphene has to be solved.74 Grafting of specific functionalities on graphene has been reported in various literatures with the aim to introduce functional groups on the surface of graphene in an effort to enhance its compatibility with various solvents, taking into account covalent or non-covalent functionalization with defects generated on the structure of graphene. While covalent bonding usually focuses on the formation and attachment of functional groups on the surface of graphene, a non-covalent approach relies heavily to the formation of π–π stacking of the group of interest to graphene. Besides that, hydrogen bonding and electrostatic forces138,139 are alternatives that are commonly practiced to adhere target molecule to graphene surfaces.

2.5 Natural polymers

2.5.1 Chitosan/graphene/graphene oxide nanocomposites. The first report on the use of a graphene–chitosan composite involved a Pt-based glucose biosensor.140 The composite was deposited by electro-deposition. The electrochemical sensing performance was investigated, and the detection limit for glucose was found to 0.6 μM. However, the mechanical properties were not reported, with the exception of noting the wrinkled nature of the graphene sheets in the TEM image. Subsequently, the mechanical properties of chitosan/graphene composites have been investigated.141,142 The tensile and Young's modulus increased by 122 MPa and 64 MPa, respectively, when 6 wt% of graphene was added, compared to the chitosan polymer reference.142 There is evidence that only a small amount of graphene (>0.1 wt%) is required to obtain these mechanical advantages.142 However, another study suggests that there is a maximum enhancement at 6 wt%.82 The differences could also attributed to the different processing routes, whereby first study used graphene produced by direct current discharge, while the latter utilizes reduced graphene oxide via chemical reduction of GO using hydrazine monohydrate. The later study also investigated electrical properties and found that the electrical conductivity also reached a maximum of 1.28 S m−1 when the amount of RGO was 6 wt%.82

Chitosan has also been blended with oxidized starch and graphene oxide using solution casting to prepare chitosan/oxidized starch/graphene oxide (COST/GO-n) nanocomposites.51 Upon the addition of GO at 6 wt%, the surface morphology had a rough surface caused by the high loading of GO, which resulted in the aggregation of the nanosheets and reduced the compatibility with the polymers. However, the fracture surface of chitosan/GO (4 wt%) and COST/GO (4 wt%) appeared to be much smoother than that of polymer blends without GO. The incorporation of GO could have formed a stronger interaction with the polymers and dispersed more homogeneously in the matrix. The interactions between GO and the matrix were also proven by the tensile strength result, where the COST/GO-n nanocomposites recorded an increase from 13.66 to 21.54 MPa. These results suggested that the carboxyl groups introduced to starch and the incorporation of GO effectively improved the properties of the nanocomposites, which could be attributed to the hydrogen bonding formed between the GO, CS, and oxide starch.

2.5.2 Cellulose/graphene/graphene oxide nanocomposites. Graphene was well-dispersed in a regenerated cellulose matrix synthesized using a solution mixing technique in a mixture of N,N-dimethylacetamide (DMAC) and lithium chloride (LiCl).81 This observation indicates a strong interaction between the two components, and the mechanical, thermal, and electrical properties of the composites were significantly enhanced. Besides using the conventional approach of blending, graphene has been chemically grafted on keratin to act as a functional filler to improve the compatibility between the starch and GO components,52 resulting in a remarkable improvement (929%) in the storage modulus (graphene 0.5 wt%). At higher temperatures, the inclusion of graphene-grafted keratin further improves the storage modulus, while decreasing the rigidity of the material.
2.5.3 Poly(lactic acid)/graphene/graphene oxide nanocomposites. In a modification approach for poly(lactic acid) (PLA) matrices, the pristine polymer was blended with graphene via the solution casting method and achieved a homogeneous distribution of graphene within the polymer matrix. The presence of graphene significantly affects the crystallization of the PLA. For cold crystallization, the graphene acts purely as an inert filler to decrease the cold crystallization rate of the PLA.54 However, under melt conditions, the graphene promotes crystallization. More recently, PLA has been mixed with liquid phase exfoliated graphene via solution blending using chloroform as a solvent. The incorporation of the graphene improved the thermal stability, and significantly increased the tensile strength up to 51.14 MPa with 1 wt% addition of graphene, that is approximately 40% as compared to the pure PLA (36.64 MPa).53 Moreover, the optimization of the tensile strength of PLA-based graphene nanocomposites was also evaluated in the literature and revealed the optimum addition of graphene nanoplatelets in a PLA matrix.21 The parameters involved in the processing included the graphene loading, blending temperature, blending time, and rotor speed of the melt mixer. Based on the result achieved, the maximum tensile strength of the PLA/graphene nanocomposite was recorded at 61.61 MPa, with the addition of graphene at 0.1 wt%, processing at 160 °C, and 10 min of blending at a rotor speed of 25 rpm. Meanwhile, GO was grafted to the backbone of poly(D-lactide), forming GO-g-PDLA, which was then blended with poly(L-lactide) before solution casting with GO using chloroform as the solvent. The utilization of GO in the polymer resulted in a lower crystallization activation energy, lower polymer chain mobility, and smaller crystal sizes. In another approach, graphene oxide was initially modified by introducing azide groups using the ring opening mechanism of sodium azide and the epoxide groups of GO.69 The N3 functionalized GO easily reacted with alkyne-terminated PLLA to form GO/PLLA composites. A schematic diagram illustrating the synthesis of PLLA-grafted GO sheets is shown in Fig. 3. Both the FT-IR characterization peaks responsible for alkyene and azido peaks diminished due to the successful grafting of PLLA chains onto the surface of GO (Fig. 4). However, the mechanical properties of the modified PLLA are not mentioned in this paper. GO–N3 was described as having a wrinkled structure due to the functionalization effect, as compared to the GO sheets, which had sharp edges and a flat surface. The average height of the GO sheets was said to be affected by the grafting ratio, with a higher grafting ratio producing a higher average height for the GO nanosheets (Fig. 5). An intercalated structure for the GO/PLLA composites was achieved when the grafting ratio was low, whereas an exfoliated structure was obtained at a high grafting ratio. It was concluded that GO, with OH–, O–, and –COOH functional groups at the edges of the honeycomb graphene layer, is much easier to disperse within polar polymer matrices because of the interactions between the oxygen functional groups on the GO and the polar polymer backbone chains.84
image file: c5ra07989f-f3.tif
Fig. 3 Schematic illustration on the synthesis of PLLA grafted GO sheets: (1) synthesis of the alkyne-terminated PLLA; (2) synthesis of GO–N3 and click reaction between GO–N3 and alkyne-terminated PLLA. Adopted with permission from ref. 69 (Copyright (2014) Elsevier).

image file: c5ra07989f-f4.tif
Fig. 4 FT-IR spectroscopy of GO, GO–N3, PLLA-1, GO-s-PLLA-1 and GO-c-PLLA-1. Reprinted with permission from ref. 69 (Copyright (2014) Elsevier).

image file: c5ra07989f-f5.tif
Fig. 5 AFM images and height profiles of (A) GO; (B) GO–N3; (C) GO-s-PLLA-1; (D) GO-c-PLLA-1. All the AFM samples were spin-coated on the silica surface. The concentrations of the samples were 0.1 mg mL−1 in DMF. Reprinted with permission from ref. 69 (Copyright (2014) Elsevier).
2.5.4 Starch/graphene/graphene oxide nanocomposites. Graphene oxide was introduced in a starch matrix to prepare a graphene oxide/starch nanocomposite film by means of solution casting.83 The mechanical strength was improved even at a low weight content of GO (2 wt%). Moreover, the GO could be well dispersed within the polymer matrix at a low content, and aggregations were formed only at a higher loading. The improvements in the mechanical properties and morphology with the addition of GO were mainly attributed to the strong hydrogen bonding formed between the GO and the functional groups of the starch backbone. Nanocomposites of oxidized starch, chitosan, and GO have also been reported to have good miscibility and a better tensile strength (36.6%).51 Again, it is believed that the hydrogen bonding between the functional groups of GO and the polymer backbone plays a key role in the improvement of the nanocomposite properties.
2.5.5 Contributions and challenges. The non-environment friendly characteristic of synthetic polymers has created serious issues in terms of biodegradability and impact on nature, therefore becoming one of the crucial goal in synthesizing natural polymers to replace the currently dominating synthetic polymers in various applications. Yet, the natural polymers commonly shared a mutual physical boundary by having low mechanical properties and adequate thermal stabilities, which limited their actual potential in replacing the synthetic one. The fascinating mechanical and thermal properties of graphene has successfully imparted into the polymeric backbones by various preparation techniques, with further fine-tuning on the desired properties of the final product could easily achieved by adjusting the ratio of graphene/polymer matrix. Nevertheless, the final main challenge is to tackle the issue of phase dispersion of graphene in the polymer matrix, as well as the interactions occurred between functional groups presence within the binary phase boundaries which heavily influenced the out coming characteristic of the composites produced.

2.6 Synthetic polymers

2.6.1 Polystyrene/graphene/graphene oxide nanocomposites. A comparison of graphene and carbon nanotube (CNT) polystyrene (PS) composites made using the solution casting method was performed,118 and polymers containing graphene were found to form a conductive polymer more easily than CNT composites. In fact, only a small amount of graphene (1 vol%) enhanced the conductivity of polystyrene to 3.49 S m−1, which is approximately 4 orders of magnitude higher than that achieved using multi-walled carbon-nanotube/PS composites.45

GO–polystyrene composites, formed using conventional solution blending, have also been reported, as summarized in Fig. 6.119 Go as synthesized via oxidation of exfoliation of graphite, was further treated with isocyanate monomers to obtained isocyanate–GO. Both functionalized GO and PS were then solution blended to achieve PS/GO nanocomposite. Most of the GO sheets are dispersed through the polymer as stacked layers. Only a small amount of the GO is exfoliated into single layer graphene oxide suspended within the PS matrix. This is attributed to the hydrophilic residual nature of the modified GO itself, which influences the compatibility between the GO sheets and the host matrix. To overcome this incompatibility, another facile approach using an in situ micro-emulsion polymerization technique has been introduced, as summarized in Fig. 7.62 Typically, the method utilizes dispersion of graphene in the presence of SDS, forming micro-emulsion within the suspension. Styrene monomers and initiators are then added into the mixture, forming PS functionalized graphene nanoparticles, which will be applied as a filler to prepare the PS film. The prepared graphene/styrene nanoparticles filler consists of thin, aggregated graphene flakes randomly associated with each other, while PS nanoparticles cover the surface forming a disordered solid. It appears that the emulsified monomer droplets increase the probability of having a collision between a nanoparticle and graphene sheet, which provides more anchoring sides for PS nanoparticles to attach to the graphene surface. A similar method was also used to prepare PS/graphene/carbon nanotube (CNT) nanocomposites.143


image file: c5ra07989f-f6.tif
Fig. 6 Schematic diagram of preparation of polystyrene/GO composite via solution blending. Adopted with permission from ref. 119 (Copyright (2011) Elsevier).

image file: c5ra07989f-f7.tif
Fig. 7 In situ microemulsion polymerization technique for polystyrene/graphene nanocomposites. Reprinted with permission from ref. 62 (Copyright (2010) Elsevier).

PS/graphene nanocomposites formed via melt blending have also been investigated117 since melt blending enhances the interactions between the PS chains and graphene through the high shear force applied during the melt blending process. The strong shear force stretches the PS chains, which then diffuse into the interlayer gap of the graphene sheets to form a π–π stack, effectively prevents the graphene sheets from aggregating (see Fig. 8). Moreover, the material obtained a homogenous dispersion with enhanced electrical properties.


image file: c5ra07989f-f8.tif
Fig. 8 Proposed mechanism of π–π stacking via melt blending. Adopted with permission from ref. 117 (Copyright (2011) ACS).

On the other hand, graphene nanosheets/polystyrene nanocomposites were prepared via a one pot synthesis method (emulsion polymerization).144 For instance, sodium dodecyl sulfate (SDS) was utilized to exfoliate the graphite with the aid of ultrasonication. UV-Vis indicated that with a 0.3 wt% SDS dispersion, a strong peak was detected at 270 nm, denoting the presence of sp2 pristine graphene nanosheets, and indirectly showing that the exfoliation was successful (see Fig. 9a). In addition, it has been explained that through ultrasonication for 60 min, the graphene nanoplatelets were dispersed evenly with an average length of 6–10 μm (Fig. 9b), indicating that the graphite flakes were exfoliated close to the monolayer graphene. In situ polymerization with large surface area graphene sheets provided good adhesion at the contact region between the graphene and PS matrix interface. Interestingly, the characteristic peaks of PS still remained prominent even after the formation of the nanocomposite. On the other hand, TEM revealed that the PS nanospheres formed were directly coated on the graphene sheets (Fig. 9c). The conductivity of the GNS–PS nanocomposite with 1.0 wt% of GNS was found to be 3.4 × 10⁻⁴ S m−1, which was an enhancement by a factor of 3 × 10⁶ compared to pure PS (10−10 S m−1). To confirm the validity of the result, cyclic voltammetry (CV) measurements were performed via a three-electrode configuration. A glassy electrode (GCE) was used as the working electrode, Ag/AgCl as a reference electrode, and platinum foil as a counter electrode in 0.1 M H2SO4. A larger current density was achieved with the PS/GNS-modified GCE, compared to the bare GCE (Fig. 10). The high electrochemical activities were credited to the dispersion of the conductive graphene nanosheets in the polymer matrix. This contributed an essential impact toward the modification of the insulating polymer to a conductive material by utilizing graphene.


image file: c5ra07989f-f9.tif
Fig. 9 UV-Vis spectra of aqueous dispersion of 0.1 wt% EG and 0.3% SDS as function of sonication time (a); TEM image of graphene sheets after 60 minutes sonication (b); TEM image of PS nanospheres coated on 3-layer graphene (c). Adopted with permission from ref. 144 (Copyright (2013) Elsevier).

image file: c5ra07989f-f10.tif
Fig. 10 CV profiles at 50 mV s−1 scan rate using: (a) bare GCE and (b) PS/graphene modified GCE. Adopted with permission from ref. 144 (Copyright (2013) Elsevier).
2.6.2 Poly(vinyl alcohol)/graphene nanocomposites. Nano-composites of polyvinyl alcohol (PVA) and graphene were prepared via simple solution mixing of PVA/GO, along with a post treatment involving the addition of hydrazine to the mixture to reduce the GO.122 The resulting film was a strong and ductile material with 16% and 32% improvements in the modulus and tensile stress, respectively, at a graphene content of 3.5 wt%. The thermal stability of the material was also improved by the incorporation of graphene. The enhancement was ascribed to the homogeneous dispersion of graphene in the PVA matrix and the positive interactions between the components. Similarly, a PVA/GO nanocomposite was reported to have improved the tensile strength and Young's modulus by 76% and 62%, respectively, by the addition of only 0.7 wt% of GO.46 The significant enhancement in the mechanical properties is closely related to the dispersion of GO in the main matrix, also attributed to the formation of strong hydrogen bonding at the GO–PVA interface, which efficiently transfers the external stress loads across the components. Similar explanations for the enhancement of mechanical properties have been reported elsewhere.50,120

GO is able to form a better dispersion and exfoliation within a polymer matrix than graphene due to the strong interactions between the PVA backbone chains and the oxygen functional groups of GO, whereas graphene causes greater property enhancements, including those for the mechanical strength, electric conductivity, and thermal stability, which are attributed to the enhancement of the crystallinity upon mixing.121 However, with the addition of an amphiphilic copolymer, significant improvements have been observed in the exfoliation/dispersion of the added graphene, because the ionic functional groups in the polymer backbone bind the graphene to the hydrophilic portion of the PVA matrix.55

A rather dissimilar attempt was utilized in PVA/GO nanocomposites via a uniaxial drawing method.123 The PVA/GO nanocomposite was initially solvent cast, which was followed by a uniaxial drawing technique with the drawing ratio fixed at three times. Increases in the crystallinities of both the PVA matrix and PVA/GO nanocomposite were detected via XRD, indicated by sharp peaks, as the effect of annealing (Fig. 11a). Equatorial arc patterns were recorded via XRD images for PVA/GO nanocomposites (see Fig. 11b), which indicated that the PVA crystallites were oriented parallel to the drawn direction. Based on the FESEM analysis (Fig. 11c and d), the orientation was observed as bright lines across the images. The GO platelets were observed to be almost fully aligned parallel to the film surface in the overall structure of the uniaxial drawn nanocomposites. In the study of the mechanical properties, Young's modulus of the PVA/GO nanocomposite increased with increasing GO content, with values as much as 160% higher than that of the drawn PVA film using just 1% w/w GO loading, as shown in Fig. 12a. However, in relation to the tensile strength (see Fig. 12b), the highest value of 392 MPa was achieved at a slightly lower GO content (0.5% w/w), which was 37 higher than that of the drawn PVA film. As expected for the filler effect, the elongation at break of the drawn nanocomposite moderately decreased with an increase in the GO content (Fig. 11c). The large improvements in the tensile strength and Young's modulus of the drawn nanocomposites compared to those of the as-cast nanocomposites were attributed to the highly oriented PVA crystallites and highly aligned GO as functions of the drawing process. Additionally, the random alignment of the GO in the as-cast nanocomposite affected the anisotropic morphology, therefore causing the large decrement in elongation at break. This scenario remained stable for the drawn nanocomposite, whereby with 1% w/w loading, the elongation at break was found to be higher than that of the as-cast nanocomposite. The incorporation of GO largely suppressed the swelling ratio of the uniaxially drawn PVA and PVA/GO nanocomposites. With only 1% w/w of GO added, the plateau swelling ratio was greatly suppressed (by 42%). The aligned GO platelets effectively suppressed the molecular motion of the PVA, and therefore retarded the swelling of the whole material itself.


image file: c5ra07989f-f11.tif
Fig. 11 (a) Equatorial X-ray diffraction profiles of the uniaxially drawn PVA film, PVA/GO nanocomposites and annealed GO (160 °C, 15 min); (b) X-ray diffraction images of the uniaxially drawn PVA film and PVA/GO nanocomposite with 1% w/w loading; FE-SEM image of cross section of (c) as-cast PVA/GO nanocomposite with 1% w/w loading and (d) uniaxially drawn PVA/GO nanocomposite with 1% w/w. Results for 2D fast Fourier transform are superimposed in lower left corners. Adopted with permission from ref. 123 (Copyright (2014) Elsevier).

image file: c5ra07989f-f12.tif
Fig. 12 (a) Young's modulus (E), (b) tensile strength (rmax), (c) elongation at break (σmax) and (d) toughness (K) of the uniaxially drawn PVA/GO nanocomposites and the as-cast PVA/GO nanocomposites as a function of GO content. Reprinted with permission from ref. 123 (Copyright (2014) Elsevier).
2.6.3 LDPE/graphene/graphene oxide nanocomposites. The fracture surface of a low density polyethylene (LDPE)/graphene nanocomposite, prepared via the in situ polymerization method,25 remained a fibrous-like structure even with the addition of 1.4 wt% of graphene, indicating that the polyethylene (PE) matrix was still undergoing deformation upon breaking. When a higher amount of graphene was added, it tended to agglomerate, which caused the weak interactions between the immiscible components to be more pronounced as a result of the non-polar polymer matrix and graphene surface, which lacked functionalities (Fig. 13). Thus, a slight decrease in the tensile strength of the composite was reported. The modification of graphene with vinyl triethoxysilane (VTES) successfully overcomes the strong interlayer cohesive energy and surface inertia of the material, resulting in a better compatibility between the polymer and graphene.29 The strong physical bond between VTES–graphene and LDPE enhanced the tensile strength of the nanocomposite up to 13.6 MPa, and the Young's modulus of the material was recorded at 225.4 MPa (pure PLA recorded a tensile strength of 10.7 MPa and Young's modulus of 116.9 MPa). In another attempt to enhance the lipophilicity of graphene, stearic acid (SA) was utilized as an additive.116 The graphene obtained as a function of the thermal reduction of GO was modified by the reaction of the epoxy groups on the graphene with SA. In addition, this method created only minimal damage to the pi-electronic structure of the graphene basal plane. The SA-modified graphene (SA-g-RGO) was blended into the LDPE matrix using a conventional solution casting method. Upon modification, the SA-g-RGO recorded an increase in weight to 35.3 parts per 100 parts of pristine graphene (35.3 phr), as compared to the pure RGO, which was recorded at 11.1 phr. This increase in weight was related to the reaction between the epoxy group of graphene and stearic acid, which resulted in a functionalization effect. In addition, the FT-IR analysis supported that an additional broad absorption band was recorded for SA-g-RGO at the region of 1690–1770 cm−1, having a peak at 1744 cm−1 attributed to the ester C[double bond, length as m-dash]O bond created by the reaction of SA and the epoxy groups on graphene. An evaluation of the dispersion of the modified graphene in the LDPE matrix was carried out by utilizing the morphology features of the samples. As the amount of SA bonded on the graphene sheets increased, the number of black particles (formed due to the nature of the agglomeration of graphene sheets toward each other) decreased significantly, which indicated that a fine dispersion of graphene in LDPE was achieved by the functionalization of the graphene surface with the SA addition. Moreover, the modulus and yield strength of SA-g-RGO/LDPE were both significantly enhanced by the reinforcing effect upon the addition of graphene, and the enhancement effect was further intensified by the lipophilization of graphene. The enhancement was correlated to the improved interfacial interaction, as well as the fine dispersion of the graphene in the LDPE matrix. In addition, the necking effect was absent in the nanocomposites, whereby the samples exhibited very low values for the elongation at break due to the molecular re-arrangement of the LDPE that occurred during the deformation process, which was strictly inhibited as a function of the dispersed graphene. Nevertheless, it was proven that the intrinsic epoxy groups on graphene could be utilized for modifications in order to achieve the characteristics of interest. Furthermore, the defects on graphene could be minimized by applying modification via the intrinsic groups. The addition of graphene successfully had a reinforcing effect in improving the tensile modulus and yield strength of the LDPE upon mixing, courtesy of the fine dispersion of functionalized graphene.
image file: c5ra07989f-f13.tif
Fig. 13 SEM images of broken tensile section for PE/graphene 6.6% at magnifications of (a) 250× and (b) 2000×. Reprinted with permission from ref. 25 (Copyright (2013) Wiley).
2.6.4 Poly(ethylene terephthalate)/graphene/graphene oxide nanocomposites. Poly(ethylene terephthalate) (PET)/graphene nanocomposites prepared via the melt compounding method23 exhibited a uniform dispersion of graphene throughout the PET matrix, with no large agglomerates forming. As expected, the electrical conductivity sharply improved as a result of the graphene incorporation. A value of 2.11 S cm−1 was obtained at a low graphene content of 3.0 vol%. Rather than using graphene directly, exfoliated graphite has been used instead.114 No aggregates were observed for quantities up to 7 wt%, and the thermal stability of the prepared composite was improved because of the well dispersed exfoliated graphite within the PET matrix, which served as a barrier in preventing further degradation of the polymer within. The prepared 7 wt% exfoliated graphite/PET composite recorded a volume electrical resistivity of approximately 10−6 S cm−1 while that of pure PET was 10−16 S cm−1. Another approach to prepare PET/graphene nanocomposites is injection molding.115 The graphene remains as platelets when dispersed within the PET matrix, with an exfoliated layer of graphene sheets (shown by red arrow) being observed (Fig. 14). The addition of the graphene content up to 15 wt% improves the Young's modulus of the nanocomposite to approximately 8 GPa, compared to the pure PET at around 2.8 GPa. Additionally, micromechanical model (Halphin-Tsai and Hui-Shia) was utilized to determine the theoretical elastic modulus of the PET and its nanocomposite. Unfortunately, the improvement in elastic modulus of PET upon of graphene addition was purely theoretical calculation.
image file: c5ra07989f-f14.tif
Fig. 14 SEM micrographs of (a) pristine PET and PET/nanocomposites with volume contents of (b) 2 wt%, (c) 5 wt%, (d) 10 wt%, (e) 10 wt% at 5k×, and (f) 15 wt%. Reprinted with permission from ref. 115 (Copyright (2012) Springer).
2.6.5 Poly(N-isopropylacrylamide)/graphene/graphene oxide nanocomposites. The addition of graphene can also be used to tune the hydrophilic/phobic properties of a polymer. Graphene sheets have been covalently functionalized by grafting up to 50 wt% onto the backbone chains of poly(N-isopropylacrylamide) (PNIPAM) (Fig. 15),113 and the hydrophilic/phobic properties were tuned. The synthesis of functionalized graphene sheets involved three processes: (i) synthesis of the PNIPAM–N3 homopolymer via the ATRP method through a series of steps, (ii) initial functionalization of GO sheets by propargyl amine through the acylation reaction, and (iii) grafting of the homopolymers onto GO sheets by the reaction between alkynyl-GO and the PNIPAM–N3 homopolymer under room temperature. Upon the incorporation of PNIPAM, which was covalently bonded to the surface of the graphene, the graphene-g-PNIPAM was found to be easily dissolved in water under the condition of phosphate-buffer saline and sonication. Although GO was also found to be uniformly dispersed in water to form a stable dispersion over a long time, it could not be well dispersed in PBS, and it precipitated after sonication was terminated. This change in behavior was attributed to the successful interaction between the graphene sheets and the PNIPAM polymer, whereby PNIPAM polymers were covalently bound on the surface of graphene sheets. Moreover, the modified polymer was able to absorb camptothecin, a water-insoluble anticancer drug, up to 15.6 wt%, as a result of the π–π stacking and hydrophobic interactions between the graphene sheets and the polymer chains.112
image file: c5ra07989f-f15.tif
Fig. 15 Synthesis route for PNIPAM/GS nanocomposites. Adopted with permission from ref. 113 (Copyright (2011) Wiley).
2.6.6 Poly(methyl methacrylate)/graphene/graphene oxide nanocomposites. Loading poly(methyl methacrylate) (PMMA) with 1 wt% of chemically reduced graphene oxide (CMG) improves the elastic modulus by as much as 28%. The dispersion of CMG within the polymer matrix was quantified using the Mori–Tanaka theory, suggesting that a better dispersion was achieved at a lower loading of CMG. An NMR study showed there is no change in the polymeric structure of a CMG polymer composite,24 which suggests that the CMG acts as an inert filler.

Using an in situ polymerization technique, graphite oxide was dispersed at the nano-level throughout the PMMA polymer matrices.110 Raman and FT-IR analyses showed that the suspended phase consisted of graphite oxide with the possibility of graphene. Moreover, the prepared nanocomposite also exhibited an improved storage modulus, with an electrical conductivity recorded at 1.5 S cm−1 upon the addition of 3 wt% graphite oxide.

A conventional solution blending approach was used to prepare PMMA/RGO nanocomposites.106 The electrical conductivity was increased to 3.7 S cm−1 with only 2 wt% of RGO. As indicated by using SEM on the fracture surface of the material, a “pull out” feature was observed and ascribed to the better interactions between the filler and polymer matrix (Fig. 16). The possible interaction involves the remaining oxygen-containing groups of RGO forming strong hydrogen bonds with the carbonyl functional groups of PMMA.


image file: c5ra07989f-f16.tif
Fig. 16 SEM images of PMMA/RGO nanocomposites. Reprinted with permission from ref. 106 (Copyright (2012) Elsevier).

Another reported method for preparing PMMA/graphene oxide nanocomposites involved mixing GO sheets and cationic PMMA emulsion particles.109 The GO sheets, which adhered tightly to the surface of the PMMA particles, were reduced using an in situ chemical method to produce graphene sheets without any aggregation. The SEM images (Fig. 17c and d) show that the GO sheets were exfoliated and bonded onto PMMA particles. The measured storage modulus of the material was enhanced by the addition of graphene. PMMA/GO nanocomposites have also been prepared using a similar method, but with the application of ultrasonication, rather than using surfactants.108 As shown by the SEM images (Fig. 17a and b), the PMMA particles were still covered by the GO sheets when using ultrasonication rather than a surfactant (as indicated by the arrows in Fig. 16b). The successfully exfoliated GO was sonicated into a much smaller size, which promoted the efficient wrapping of the hydrophobic particles. Furthermore, the GO sheets were flexible enough to bend and wrap around the spherical surface.


image file: c5ra07989f-f17.tif
Fig. 17 Comparison of FESEM images of PMMA/GO (a & b) without surfactant and with sonication (c & d) with surfactant and without sonication. (a & b) adopted with permission from ref. 108 (Copyright (2013) Springer), (c & d) reprinted with permission from ref. 109 (Copyright (2012) Elsevier).

GO was blended with amine-functionalized poly(glycidyl methacrylate) (PGMA), which was then utilized in the synthesis of a polymer core and graphene shell microspheres.111 PGMA was initially dispersed polymerized and further modified with ethylene diamine, forming amine-functionalized polymer microspheres (PGMA–ed). The pH of the mixture was found to significantly influence the surface of the nanocomposites, where the surface roughness increased as the pH decreased. Further, the fabrication process was initiated at pH 10, where the surface charges of both GO and PGMA–ed remained the same, which indicated that the reactions possibly occurred via reactions between the functional groups of GO and PMMA–ed. The reactions via electrostatic attraction were less likely to occur. Digital images of the RGO/PMMA powder showed that the color became darker as the pH decreased (inset of Fig. 18), suggesting that the layers of the RGO shell increased as the pH decreased because the transmittance of the graphene layer was linearly reduced with an increase in the number of layers. The RGO/PGMA–ed core–shell was uniform in size, without any aggregation between particles, except for that synthesized at pH 2, as indicated by SEM images (Fig. 18). This phenomenon explained why the self-assembly of GO sheets onto core particles was not favored at exceedingly high acidic conditions (below pH 3), as the carboxylic acid groups of the GO sheets were abruptly protonated, leading to instability. In addition, all of the samples, regardless of pH, showed that the PGMA–ed microspheres were completely covered with RGO shells without any voids noticed between the interfaces, as shown in TEM images in Fig. 19. The average shell thicknesses obtained at pH 10, 7, 5, 3, and 2 were approximately 24, 37, 55, 70, and 100 nm, respectively. The maximum electrical conductivity was recorded for the samples produced at pH 3, with the highest at 31.43 S m−1. An important point worth mentioning is that the electrical conductivity of the samples could be easily adjusted by varying the thickness of the shell.


image file: c5ra07989f-f18.tif
Fig. 18 SEM images of RGO/PGMA–ed core–shell microspheres produced at pH 10 (a), 7 (b), 5 (c), 3 (d), and 2 (e). The insets are the photograph images of powdered form of the core–shell particles. Adopted from ref. 111 (Copyright (2014) RSC).

image file: c5ra07989f-f19.tif
Fig. 19 Cross-sectional TEM images of RGO/PGMA–ed core–shell microspheres produced at pH 10 (a), 7 (b), 5 (c), 3 (d), and 2 (e). Adopted from ref. 111 (Copyright (2014) RSC).

In addition to depositing graphene nanosheets onto PMMA particles, research has also been conducted on physically sandwiching graphene between two insulating PMMA layers to prepare an organic bistable device (OBD),107 which has potential applications for transparent flexible non-volatile memory devices. The fabricated device demonstrated an electrical bistable behavior, even after bending, indicating the memory stability of the material. For comparison purposes, PMMA/RGO nanocomposites were prepared via three different methods: the in situ polymerization of MMA in the presence of RGO, bulk polymerization of MMA in the presence of PMMA beads/RGO, and in situ polymerization of MMA in the presence of RGO followed by sheet casting.105 Interestingly, the electric conductivity of the prepared composites was critically dependent on the amount of RGO, as well as the method of fabrication. At 2 wt%, the electric conductivity of the material was increased by a factor of 107 by means of the in situ polymerization of RGO/PMMA in the presence of PMMA beads, whereas the conductivity was recorded at 108 for the composite at the same weight content prepared via the casting method. Furthermore, the sheet casting method provided better exfoliation of the RGO within the PMMA matrix among the three methods, thus providing a better dispersion and adhesion of RGO toward the PMMA matrix, and significantly improving the electrical conductivity. Along with the physical modification efforts, graphene was also covalently functionalized74 with phenol groups, followed by the polymerization of PMMA at room temperature. This process was carried out using N-methylglycine and 3,4-dihydroxybenzaldehyde, whereby graphene was functionalized by two hydroxyl groups without altering the electronic properties. Unlike physical blending, the two components of the functionalized graphene/PMMA nanocomposites could not be separated from one another even via extensive washing and filtration. As shown in Fig. 20a, the surface of the graphene was heavily covered by PMMA. Additionally, the prepared functionalized graphene/PMMA nanocomposites were readily soluble in organic solvents, which occurred because the PMMA was covalently bonded onto the graphene surface. The functionalization was also proven by the 1H NMR spectrum shown in Fig. 20b.


image file: c5ra07989f-f20.tif
Fig. 20 (a) FESEM image of the PMMA-functionalized graphene and (b) 1H NMR spectrum of PMMA-functionalized graphene in CdCl3. Adopted from ref. 74 (Copyright (2012) RSC).
2.6.7 Poly(caprolactone)/graphene oxide biocomposites. Research conducted on the incorporation of GO in a poly(caprolactone) (PCL) matrix has not been widely reported. The initial results obtained from PCL/GO nanocomposites prepared via a typical electrospinning method90 were encouraging, with dramatic increases (at 0.3 wt%) of the tensile strength, modulus, and energy at break of 95%, 66%, and 415%, respectively. Moreover, the porosity of electrospun nanocomposites was still retained at 94.1%, as compared to the neat PCL polymer (96.9%). The increase in the mechanical strength of the nanocomposites was directly related to the changes in the fiber morphology by the incorporation of GO. Thermally reduced graphene has also being incorporated in a PCL matrix via the conventional solution casting method.89 The prepared nanocomposites achieved a fine dispersion of graphene throughout the PCL matrix, with some graphene being embedded in the matrix, indicating a strong interfacial adhesion between the components. The addition of very small amounts of graphene (0.5 and 2.0 wt%) results in significant improvements in the storage modulus of the nanocomposites by about 203% and 292%, respectively, at −80 °C, as compared with the neat PCL.
2.6.8 Polyvinylidene fluoride/graphene/graphene oxide nanocomposites. Like most fluorinated hydrocarbons, polyvinylidene fluoride (PVDF) is hydrophilic, but the dense skin-layers of PVDF membranes make it difficult to manufacture super-hydrophilic surfaces.104 The addition of graphene, which is also hydrophilic, to the PVDF should make it possible to tune the physical properties of the polymercomposite. Indeed, super-hydrophilic surfaces based on PVDF/graphene nanocomposites have been reported in the literature.104 Nano-composites were formed by the diffusion of a non-solvent vapor, either methanol or water, into a PVDF/graphene/DMF suspension, followed by freeze drying, to form porous materials.104 The addition of graphene influences the crystallization of the PVDF, resulting in a surface roughness on the nanometer scale and a surface that is super-hydrophobic.

PVDF/GO nanocomposites, fabricated via solution mixing followed by either hot press molding or solution casting, have also been reported.56 The strong interaction between the carboxyl functional groups on the surface of the GO and the fluorine group on the PDVF backbone ensures a homogeneous dispersion of GO nano-sheets within the PVDF matrix. At the percolation threshold, the electrical conductivity of the polymer is expected to increase. For the PVDF/GO material, this occurs between 0.1 wt% and 0.5 wt% of GO, which appears to be lower than previously reported measurements on graphene/PVDF nanocomposites.145,146 A comparison of the PVDF/GO synthesis routes using FTIR shows that solution casting is more efficient at inducing the α-PVDF to β-PVDF phase transition than hot press molding. This observation could be significant technologically since β-PVDF is a common piezoelectric material, while α-PVDF is non-piezoelectric. There have been multiple reports about adding graphene-related materials to PVDF to enhance its piezoelectric performance103 and thus improve the performance of devices, like energy harvesters, based on this material. However, adding too much graphene/rGO to the nanocomposites obstructs the formation of the piezoelectric β-phase crystals, because the space for β elongation becomes smaller.

2.6.9 Polyurethane/graphene/graphene oxide nanocomposites. The enhancement of the mechanical properties of polyurethane (PU) nanocomposite films as a function of graphene and graphene oxide has been investigated, and the results were similar to those for other polymer composites.100 Namely, there was an exponential increase in Young's modulus, but an exponential decrease in toughness with the graphene content. In this study, a nanocomposite was synthesized by first dispersing the graphene in DMF, followed by mixing with Pu-dissolved tetrahydrofuran (THF). The mixture was then drop-cast to prepare the free-standing PU/graphene nanocomposite film. As previously mentioned, there is an exponential increase in the Young's modulus with the amount of graphene. However, above 50 wt% of graphene, there is no longer any increase, and the Young's modulus saturates at 1 GPa. There is also a corresponding saturation in the stress at a 3% strain (25 MPa).

The electrical conduction of a polymer/graphene nanocomposite can be significantly increased (by approximately 6 orders of magnitude) by the inclusion of graphene.16 Waterborne polyurethane (WPU)/graphene nanocomposites were prepared by initially mixing a graphene suspension and monomers, followed by chemical polymerization.16 The mixed graphene solution and WPU emulsion was dried to obtain the composite film. The electrical conductivity of the composite increased exponentially when the amount of graphene in the composite was below 1 wt%. Above this amount of graphene, the rate of increase in the electrical conductivity was significantly smaller, and there is evidence from the published figures that the conductivity could saturate. The maximum conductivity of 8.30 × 10⁻⁴ S cm−1 occurred at a graphene content of 4 wt%. No information on the mechanical properties was given in the paper. A very much similar study was performed by Sang et al.98 to prepare graphene/waterbone polyurethane nanocomposites, however dissimilar method of colloidal dispersion mixtures. The tensile strength and elongation at break recorded a decrease with increasing functionalized graphene nanosheets (FGS) due to inhibiting effects of molecular arrangements of PU as a function of FGS addition. Nevertheless, the conductivity was recorded at 1.04 × 10⁻⁷ S cm−1 with 2 wt% content of FGS within the nanocomposite matrix that is approximately 103 folds as compared to the nanocomposite with 1 wt% FGS content. It can be concluded that the FGS could be finely dispersed within the polymer matrix via physical mixing of colloidal dispersion of FGS and a colloidal dispersion of a polymer.

PU/epoxy/GO nanosheet composites were reported to have a uniform morphology, indicating that the GO nanosheets (GONS) were well-dispersed throughout the polymer matrix as a result of the effective chemical bonding between the PU/epoxy and functional groups on the GONS surface.101 The mechanical strength of the polymer increased (218 to 257 MPa), but not to the same extent as graphene in pure PU. In addition, the elongation at break increased by more than 52%. The enhancing mechanism is illustrated in Fig. 21, where the urethane bonds(–NH–CO–) could form to serve as covalent bonds, which resulted from the reaction between the hydroxyl groups on the GO surface and the –NCO groups of the PU chains, respectively. Additionally, the ability of epoxy to intercalates into the layered structure of GO was also reported in literature.102


image file: c5ra07989f-f21.tif
Fig. 21 Solidification mechanism for PU/GO/EP nanocomposites. Reprinted with permission from ref. 101 (Copyright (2013) Elsevier).

Significant improvements in mechanical properties have also been reported in hyper-branched polyurethane (HPU)/GO nanocomposites.99 The HPU was initially chemically polymerized147 and mixed with graphene to form a dispersed solution. This mixture was then solution cast on an inert substrate to obtain the desired nanocomposites. The tensile strength increased from 7 to 16 MPa, and the elongation at break increased from 695% to 810% when 2 wt% of GO was added. Furthermore, the HPU/GO nanocomposites exhibited excellent shape memory behavior, at which the photographs of the nanocomposite film prior and after stretching force applied are illustrated in Fig. 22a. This is because of the increase in stored energy caused by the π–π interaction between the GO sheets and the hard backbone chains of the HPU as shown in Fig. 22b. GO created high quantity of stored elastic strain energy which aids the nanocomposites to gain high recovery stress. Moreover, addition of GO increased the degree of crystallinity of the nanocomposite, which improved the shape recovery.


image file: c5ra07989f-f22.tif
Fig. 22 (a) Shape memory performance of HPU and HPU/GO nanocomposites and (b) possible mechanisms of graphene-enhanced shape memory. Reprinted with permission from ref. 99 (Copyright (2013) Elsevier).

Other methods for synthesizing PU/graphene nanocomposites obtained similar results. For example, Rana et al.22 functionalized graphene sheets and incorporated them into a PU matrix to act as cross-linkers. In this experiment, ultra-sonicated graphene nano-sheets were added to a pre-loaded mixture of 4,4-methylene bis(phenyl isocyanate) and poly(e-caprolactone)diol. Upon completion of the reaction, the mixture was cast onto a Petri dish and dried to obtain the nanocomposite film. Covalent cross-linking effectively controlled the re-stacking of graphene sheets within the polymer matrix, thereby creating a uniform morphology. The mechanical properties of the nanocomposites were again enhanced. Interestingly, at 4 wt%, the enhancement of Young's modulus and the shape recovery of the graphene nanocomposite was larger than that for a sample containing carbon nanotubes. Blending microwave-exfoliated graphite oxide (MEGO) into the polyurethane matrix via injection molding also achieved a nanocomposite with a uniform morphology, whereby the MEGO layers were uniformly dispersed throughout the matrix.20 The strong interactions between MEGO and polyurethane are related to the formation of hydrogen bonding between the N–H group of PU and the oxygen functional groups of the MEGO layers (Fig. 23). The mechanical strength of the nanocomposites did not increase as much as with the other methods discussed earlier. However, the enhancement of the electrical conductivity was similar to the work discussed earlier. A conductivity of 10−4 S cm−1 was achieved at 4.0 wt% of MEGO. Similar results were obtained for nanocomposites synthesized by introducing functionalized graphene sheets (FGS) into waterbone polyurethane (WPS) using a chemical polymerization method.


image file: c5ra07989f-f23.tif
Fig. 23 Predicted interactions between polyurethane and MEGO layers. Reprinted with permission from ref. 20 (Copyright (2013) Elsevier).

Finally, it should be noted that the reports of an exponential increase in the mechanical strength of PU/graphene nanocomposites were obtained at very high levels of graphene inclusion (20–60 wt%). This could explain the differences in the mechanical enhancements of the different studies.

To improve the interfacial adhesion within the RGO/PU nanocomposite, the RGO was functionalized with PCL by the esterification functionalization of GO, followed by a reduction process.148 The PCL-modified RGO (PCL–RGO) was blended with PU in a DMF solution and subjected to electrospinning. FT-IR indicated a peak shift in the carbonyl group from 1724 to 1720 cm−1, which was assigned to the change that occurred to the carboxylic acid of the ester group (Fig. 24). In addition, the peak of the C–H stretching was prominent, as the effect of grafting long-chain C–C groups of PCL onto GO. Generally, the addition of GO, f-GO, and r-GO increased the breaking stress of PU nanocomposites (Table 2). The addition of 0.1 wt% of f-GO improved the breaking stress up to 9.3 MPa, which was 1.2 times higher than that of the pure PU nanofiber itself (7.8 MPa). Moreover, the modulus also increased to 41.4 MPa by the addition of 1 wt% of f-GO (pure PU nanofibers recorded a modulus of 31.5 MPa). Interestingly, the f-GO nanofibers had an improved breaking stress and modulus compared to those of the GO and rGO-loaded nanofibers at the same loading. The improvement was closely related to the improved dispersion of functionalized graphene in the PU polymer matrix compared to GO and r-GO. Nevertheless, the elongation at break values of the GO, f-GO, and r-GO composite nanofibers were also higher than that of the pure PU nanofibers. However, the increase in the elasto-plastic behavior of graphene requires additional characterizations because the addition of fillers commonly tends to cause a decrease in the elastic behavior of the main matrix itself. The crucial shape memory properties of PU were also discussed in this study. PU/graphene nanofibers recorded shape recoveries higher than 90% in the first cycle, while the pure PU nanofiber web was 88.3%, as plotted in Fig. 25. However, the trend decreased with increasing cycles, although the values achieved remained higher than 80%. Particularly, the shape recovery time decreased significantly when graphene was incorporated into the nanofibers matrix, similar to the GO, f-GO, and RGO samples. The properties were ascribed to the increase in graphene content, which significantly disrupted the polymer flexibility, therefore resulting in the decrease in shape recovery. The overall shape retention results are listed in Table 3.


image file: c5ra07989f-f24.tif
Fig. 24 FT-IR Spectra of (i) PCL, (ii) GO, (iii) f-GO and (iv) RGO. Reprinted with permission from ref. 148 (Copyright (2014) American Chemical Society).
Table 2 Tensile properties of PU/graphene nanofiber webs. Adopted with permission from ref. 148 (Copyright (2014) American Chemical Society)
Sample Graphene content (wt%) Tensile strength (MPa) Modulus (MPa) Elongation-at-break (%)
PU 0 7.8 31.5 406.7
PU/GO 0.1 7.4 32.9 299.5
0.5 8.3 33.7 412.9
1.0 7.9 35.7 422.8
PU/f-GO 0.1 9.3 35.9 429.2
0.5 8.5 36.9 515.4
1.0 8.9 41.4 515.6
PU/r-GO 0.1 8.6 31.3 350.6
0.5 9.1 33.1 553.6
1.0 8.0 32.4 450.6


image file: c5ra07989f-f25.tif
Fig. 25 Shape recovery of the pure PU and PU/graphene nanofiber webs with different cycles (red and solid symbols, first cycle; blue and open symbols, fifth cycles; ●, PU; ■, PU/GO; ▲, PU/f-GO; and ▼, PU/r-GO). Reprinted with permission from ref. 148 (Copyright (2014) American Chemical Society).
Table 3 Shape retention (%) of PU/graphene nanofiber webs. Adopted with permission from ref. 148 (Copyright (2014) American Chemical Society)
Cycle PU PU/GO PU/f-GO PU/r-GO
0.1 0.5 1.0 0.1 0.5 1.0 0.1 0.5 1.0
1st 98.1 99.8 97.8 96.2 95.1 97.1 99.4 94.9 96.8 95.0
2nd 99.9 99.2 96.8 96.7 96.1 97.0 98.0 95.1 96.8 97.5
3rd 97.8 98.5 99.6 97.2 95.1 98.1 99.9 97.7 96.2 96.7
4th 97.3 98.3 98.9 97.9 98.2 97.5 98.7 96.9 95.9 96.9
5th 98.9 99.3 97.0 97.6 96.9 97.1 98.7 95.9 96.6 97.3


2.6.10 Poly(ethylene oxide) (PEO)/graphene/graphene oxide nanocomposites. The reinforcement effects of graphene in a PEO nanocomposite matrix have been demonstrated using13 two types of blending methods. Solution casting method showed a parallel distribution of graphene compared to the nanocomposite surface, while the graphene platelets were randomly distributed in melt blended nanocomposites (Fig. 26). The two different synthesis routes alter the thickness of the foliated graphene sheets. In the solution casting method, the graphene sheets consist of two layers (thickness ∼0.7 nm), while the melt blended possessed 4 layers (thickness ∼1.4 nm). There is also a difference in the transparency of the solvent casted films compared to those manufactured using the melt blended method, in which the former exhibited a higher transparency (87.6%) compared to the latter (66%). This observation can be explained by the different arrangements of the graphene sheets. In the melt blended sample, the graphene sheets are randomly oriented, which causes the light to be randomly scattered, and thus reducing the transparency. There was also a significant improvement in the mechanical properties. The performance improvement was again the greatest for the solution casting method. The improvement in Young's modulus at 2 vol% graphene was approximately 400% over the pristine polymer. This compares with 100% for the melt blended sample. The large increase in the mechanical properties was attributed to the well-dispersed state of the graphene sheets in the nanocomposites, and a strong interfacial interaction between the graphene and PEO matrix due to the high aspect ratio of graphene.149 The inclusion of graphene also increased the conductivity of the sample, and the percolation limits for both the solution and melt blended samples were approximately 0.4 vol% and 1 vol% of graphene, respectively. This result could be explained by the orientation of graphene sheets in the two nano-composites: in the solution casting sample, the graphene sheets are aligned with the surface, whereas for the melt blended sample they are randomly oriented. Another approach for the formation of a PEO/graphene nanocomposite is to cause the PEO polymer chains to penetrate into the interlayers of graphene by heating blends of the two materials at a weight ratio of 20[thin space (1/6-em)]:[thin space (1/6-em)]80 (PEO[thin space (1/6-em)]:[thin space (1/6-em)]graphene).96 After heating for 12 h at 100 °C, the XRD peak attributed to crystalline PEO almost disappeared, suggesting that many chains of the PEO polymer were constrained to such an extent that crystallization was no longer possible. Moreover, an AFM analysis of the sample surface confirmed that only parts of the PEO chains were absorbed onto the graphene surface. Therefore, both XRD and AFM findings support the conclusion that only small amounts of the PEO chains were absorbed on the surface of the graphene surfaces, while the remaining larger portions penetrated into the graphene nanosheets. However, the effect on the electrical and mechanical properties of the film cannot be determined since the paper did not present any results.
image file: c5ra07989f-f26.tif
Fig. 26 Schematic diagram of graphene sheets incorporated into polymer by (a) solvent blending method and (b) melt blending method. Reprinted with permission from ref. 13 (Copyright (2011) Elsevier).
2.6.11 Polyimide/graphene/graphene oxide nanocomposites. High-performance polyimide (PI) is widely used in aerospace, optics, and microelectronics because of its excellent properties, including a high mechanical strength, high thermal resistance, and good chemical resistance. However, pristine PI is generally electrically insulating in nature. Therefore, there is significant potential for the build-up of an electrostatic charge on the surface of the material, which can cause damage to the component containing the film. To overcome this imperfection, GO can be introduced into the PI matrix as a filler to improve the electrical conductivity, which the additional benefit of improving the mechanical properties.95 In this study, nanocomposites were fabricated by initially modifying GO with ethyl isocyanate, which was then dispersed in a DMF solvent before the nanocomposites were formed by in situ polymerization. The electrical conductivities of the 0.3 wt% and 0.75 wt% graphene films were over 8 orders of magnitude higher than the neat PI film. The 0.75 wt% graphene film had the highest conductivity of 8.9 × 10⁻⁵ S m−1. The Young's modulus and tensile strength of the composite film appeared to also slightly improve, but the errors in the measured parameters make a definitive statement difficult.

As well as increasing the electrical conductivity, the addition of graphene also improves the thermal conductivity but not by the same amount as the electrical conductivity. In this work, the film made using 2.5 wt% of graphene had a thermal conductivity 25% greater than a PI film.15 However, the films were characterized using different methods. Graphene was initially prepared via a thermal treatment of GO at 1000 °C in an inert atmosphere. An appropriate amount of graphene (5–2.5 wt%) was dispersed in an N-methyl-2-pyrrolidone solution, following by PI. The prepared mixture was subjected to spin casting to obtain the composite sheet.

The nanocomposites of PI/GO, prepared via in situ polymerization, were used to improve the friction and wear of the PI films.94 The addition of graphene resulted in a 25% reduction in the coefficient of friction to ∼0.29 and was not dependent, within the experimental error, on the amount of graphene in the sample (over the range of 1–5 wt%). There is also strong evidence that the wear rate was reduced by 23% when the amount of GO added was 3.0 wt%. This reduction was attributed to the efficient formation of a graphene/PI film (transfer film) on the metal “rubbing” contact. The GO-filled nanocomposite transfer films were more uniform than the PI films, resulting in additional protection.

Ultra-low weight content GO (0.001 wt%)/PI nanocomposites, prepared by solution mixing, exhibited superior moisture barrier properties (an approximately 83% improvement) over a pure PI film, while retaining the visible light transmission of the film (Fig. 27a and b).30 Even at these small amounts of GO, there was significant improvement in the mechanical properties: the storage modulus of PI/GO was recorded as high as 2474 MPa, with a 60% improvement compared to pristine PI with an addition of only 0.01 wt% of GO. The improvement was attributed to the fine dispersion and high orientation of GO within the PI matrix (Fig. 27c and d), which resulted in an increase in the reinforcement effect efficiency. Furthermore, the wide distribution of GO with a high aspect ratio and high specific area effectively extended the path the water vapor needed to take to pass through the film. This seems to disagree with the results discussed earlier for films fabricated using isocyanated GO, but the synthesis route was significantly different.


image file: c5ra07989f-f27.tif
Fig. 27 (a) UV-Vis spectra in visible light region of pure PI and PI/GO nanocomposite films, (b) effect of GO content on water-vapor transmission rate (WVTR) of pure PI and PI/GO films, FESEM images of (c) cross section of PI/GO-0.01 nanocomposites film (arrow indicates dispersed GO in matrix, and (d) magnified image of cross section shown in (c)). Reproduced with permission from ref. 30 (Copyright (2012) Elsevier).

As a comparison, PI/RGO was prepared by using an in situ polymerization technique, and the investigation included the electrical and gas barrier properties of the nanocomposites.91 As expected, the incorporation of RGO greatly improved the electrical properties of the nanocomposites as a result of the electrical percolation networks of RGO within the PI matrix. The conductivity of the RGO/PI film (70[thin space (1/6-em)]:[thin space (1/6-em)]30) prepared using the in situ polymerization technique was approximately 1014 times higher (1.1 × 101 S m−1) than that of a pure PI film and even larger than the GO/PI composite prepared via the ioscyanate route discussed earlier. Furthermore, the oxygen transfer rate (OTR) was reduced by ∼93% (375 cm3 m−2 24 h−1 atm−1) compared to the pristine one (25 cm3 m−2 24 h−1 atm−1). However, it had a higher weight content of RGO (30 wt%) compared to the previous literature.

2.6.12 Polyacrylonitrile/graphene/graphene oxide composites. Polyacrylonitrile (PAN) is used as a precursor in the manufacture of carbon fiber, which is extensively used in the aerospace industry. Therefore, the effect of adding GO to PAN on the yield of carbon fiber has been investigated.59 In this study, the GO was prepared using the method of Hummers and Offman, and the polymerization was performed using an aqueous mixture of acrylonitrile, acrylamide, and GO at 60 °C for 3 h in a nitrogen atmosphere. Several samples with different GO weight contents (0, 0.05, 0.5, and 2.5 wt%) were prepared and squeezed into thin membranes. As indicated by an FT-IR analysis, the GO sheets were interconnected with the PAN matrix by means of hydrogen bonds. However, the addition of GO slightly decreased the molecular weight. For the sample with the highest GO content (2.5 wt%), this decrease was approximately 12%. Below 300 °C, the GO/PAN composites were stable, while the PAN sample saw a 5% drop in weight. However, above this temperature, the sample with 2.5 wt% showed a higher weight loss than the 0.5 wt% sample. By 350 °C, the weight loss of the 2.5 wt% sample was very similar to that of the pure PAN sample. However, the weight loss of the 0.5 wt% sample was always less than either the pure PAN sample or the 2.5 wt% sample, even up to 900 °C. Further evidence for this improved stability was the observation of a 5% increase in the carbon fiber yield for this sample.

In a similar attempt, nanofibers of a GO/PAN composite were prepared using a compounding and electrospinning process.49 The precursor for the electrospinning solution was prepared by initially dispersing the GO powder in an N,N-dimethylformamide (DMF) solution using sonication, followed by the PAN powder. The structure of the electrospun PAN/GO nanofibers was significantly affected by the addition of GO; the average diameter of the composite nano-fibers decreased as the GO loading increased (Fig. 28), and the nanofibers were uniform in diameter. However, a beaded structure was found upon GO loading (see Fig. 28d), which was due to the poor dispersion of GO in the DMF, causing an instability in the liquid jet formed during the electrospinning process. The smooth surface and clear fibril structure with the wrinkled morphology of pure PAN was altered to a coarser and irregular morphology with an increase in the GO content (Fig. 29). Interestingly, it was also reported that at a low GO content (0.1 and 0.5 wt%), the nanofibers became “adhesive” and would collapse into each other at the meeting point. The FT-IR spectra of the samples showed no significant new peaks, indicating there was no chemical bonds between the PAN chains and GO.


image file: c5ra07989f-f28.tif
Fig. 28 SEM images of (a) PAN, (b) PAN/GO-0.05, (c) PAN/GO-0.1, and (d) PAN/GO 0.5. Reprinted with permission from ref. 49 (Copyright (2013) Wiley).

image file: c5ra07989f-f29.tif
Fig. 29 AFM images of (a) PAN, (b) PAN/GO-0.05, (c) PAN/GO-0.1, and (d) PAN/GO 0.5. Reprinted with permission from ref. 49 (Copyright (2013) Wiley).

In another study,85 electrospun PAN/GO nanofibers were prepared using a dimethylformamide solvent, carbonized at 1200 °C, and then activated under air at 325 °C to produce a textured and porous structure. Interestingly, the samples containing GO at 10 wt% or less had a narrow diameter (140–165 nm) and a relatively smooth surface (Fig. 30a, b, d and e). However, at 15 wt% of GO, the diameter was larger (235 nm), with a rough surface morphology (Fig. 30c and f). These observations provide evidence that excess GO in the fiber will lead to a rougher surface and larger diameter as a result of the entanglement and protrusion of GO. However, further work needs to be performed to verify this conclusion. It is worth noting that electrochemical capacitors made using the 15 wt% GO sample had the highest specific surface area and specific capacitance of 613 m2 g−1 and 191.2 F g−1, respectively, of all the samples made in this study.


image file: c5ra07989f-f30.tif
Fig. 30 SEM images of morphology of nanofibers electrospun from PAN before (a–c) and after activation at 300 °C. The GO contents of the samples were 0 wt% GO for (a and d), 10 wt% for (b and e), and 15 wt% for (c and f). Reproduced with permission from ref. 85 (Copyright (2014) Elsevier).

A PAN/RGO composite was prepared via a conventional solution casting method with dimethyl sulfoxide (DMSO) as the solvent.86 The prepared composite recorded a significant increase in electrical conductivity, attributed to the incorporation of partially reduced GO as a conducting filler within the matrix.

2.6.13 Polycarbonate/graphene/graphene oxide nanocomposites. Polycarbonate (PC) was reinforced with thermally treated graphene oxide (GO) by using a melt compounding technique.57 A comparison of the TEM micrographs of the platelets edge on and face on indicates that the GO platelets were exfoliated after the melt process. Unlike many other polymer/graphene composites discussed earlier, the incorporation of the GO did not improve the tensile modulus, whereas the use of graphite did. However, there was an improvement in the gas barrier properties of the nanocomposite. The gas permeability of He on pure PC was reduced from 12.5 Barrer to 8.8 Barrer at 3 wt% of GO. Similarly, for N2 gas, the value also decreased from 0.36 Barrer to 0.20 Barrer. The percolation threshold, where the electrical conductivity increases drastically, was approximately 0.1 wt% GO.

Another study of the electrical conductivity of PC/graphene nanocomposites was undertaken by Yoonessi and Gaier.87 In their study, PC/graphene nanocomposites were prepared by the emulsion mixing and solution blending methods, and the nanocomposites bearing 1.1 and 2.2 vol% of graphene recorded high conductivities. Samples bearing 2.2 vol% of GO prepared by emulsion and solution mixing recorded conductivities of 0.512 and 0.226 S cm−1, respectively. The morphologies of these samples were slightly different; conductive graphene nanosheets were wrapped around the PC microspheres (Fig. 31), providing a conductive path for electron transport. Furthermore, the graphene sheets had a wrinkling and irregular lateral shape.


image file: c5ra07989f-f31.tif
Fig. 31 SEM images of 0.55 vol% (a & b) and 1.1 vol% emulsion blended PC–G microspheres covered with graphene. Reprinted with permission from ref. 87 (Copyright (2010) ACS).

The thermal stabilities of both solid and foamed PC/graphene nanocomposites have been evaluated at a fixed graphene content (5 wt%).88 A nanocomposite was prepared via melt compounding of PC and graphene, and to make the PC/graphene foam a one-step foaming process with CO2 was used. Both the foamed and solid nanocomposites were subjected to thermogravimetric analysis. For the solid sample, the maximum degradation temperature (Tmax) of the composite increased compared to the sample containing only PC, indicating that the presence of graphene platelets within the PC matrix aids the thermal stability. In addition, the diffusion barrier effects of well-dispersed graphene nanofillers delay the escape of volatile degradation products from the regions below the surface, thus improving the thermal stability of PC/graphene nanocomposites.150 A very similar three-stage degradation was also observed for the foam PC/graphene nanocomposites. However, there was a slight improvement in thermal stability. The cellular structure of the foam composite decreased the thermal conductivity, and so the inner parts of the sample were slightly cooler than the outside.

2.6.14 Contributions and challenges. Unlike natural polymers, most of the synthetic polymers possessed decent properties such as high mechanical strength with high thermal stability. The addition of graphene successfully imparted additional characteristic including electrical conductivity, high gas and moisture barrier effect. Moreover, high mechanical strength and thermal stability of graphene still contributed into the main matrix as an extra benefit towards the final properties of the end products. Similarly for a polymer/additive system, the characteristic of the binary system could easily fine-tuned by tackling the ratio of each components, taking into accounts the possible interactions within the dual phase system. Various literatures have reported in graphene functionalization so as to achieve a better dispersion/mixing of graphene in the main matrix, which eventually could be the most promising way in achieving an efficient graphene/polymer system.

2.7 Conductive polymers

The findings in relation to conductive polymers have made possible the substitution of non-metallic components for the metallic components used for conductors and semiconductors, and extensive efforts have been made by numerous research groups to produce polymers with various electrical, mechanical, and optical properties.151,152 Generally, a conductive polymer possesses the unique properties of being able to conduct electricity in its solid state, high processability, and low cost to synthesize compared to other conductive inorganic materials. It also has high mechanical flexibility.153 Often, these conductive polymers were added with additives to increase its electrical conductivity in order to achieve a benchmark for specific applications. The use of graphene to enhance the electrical properties of conducting polymers is an obvious choice because graphene has good chemical stability,154 high electric conductivity,155 and a large specific surface area.34 The driving force to develop conducting polymer fibers is the optimization of super-capacitors. These devices supplement advanced Li ion batteries, which have high energy storage but poor power delivery.156
2.7.1 Polypyrrole/graphene/graphene oxide nanocomposites. Polypyrrole (PPy) is the most common conductive polymer, especially in energy storage applications, because of its ease of synthesis, high conductivity, and, when used in a super-capacitor, its relatively high capacitance.127 However, the main drawback of PPy is the poor cycling stability caused by a mechanical rupture of the polymer fibers as a direct result of their swelling and shrinkage during capacitor charging/discharging.157,158 Evidence from other polymer/graphene polymers indicates that the presence of graphene nanosheets in the polymer matrix leads to a significant improvement in the mechanical properties. Therefore, by synthesizing PPy/graphene composites, the mechanical rupturing of the polymer should be reduced, resulting in an improvement in the cycling stability. Therefore, a combination of PPy with GO or graphene has been reported in various articles.17,159,160

Polypyrrole/graphene nanocomposites were prepared via the in situ polymerization of graphite oxide (GO) and a pyrrole monomer, followed by the chemical reduction of GO to graphene using hydrazine monohydrate.58 The GO sheets were surrounded by PPy in a typical curved, layer-like orientation. However, upon reduction, the graphene sheets appeared to have a wrinkled form. The magnitude of the conductivity of GO/PPy nanocomposites was increased compared to the pure PPy sample, and this has been attributed to the π–π stacking between the layers of GO and PPy. The conductivity increased even further after the chemical reduction was performed, as a consequence of the large specific surface area and the excellent conductive structure provided by graphene. A similar attempt was carried out to prepare PPy/GO nanocomposites, without further chemical reduction of the GO.127 The electrical conductivity of the nanocomposite film increased from 41.2 S cm−1 to 75.8 S cm−1 with an increase in GO from 5 to 10 wt%, much higher than that of pure PPy film (1.18 S cm−1). Previous attempts to use PPy coating on carbon nanotubes (PPy–MWCNT) only managed to achieve a conductivity of 2.40 S cm−1, even with a loading of 50 wt% MWCNT.161 Similarly, in the previous report on the synthesis of PPy/functionalized MWCNT nanocomposites via interfacial polymerization, the electrical conductivity recorded was approximately 10 S cm−1.162 In another attempt to improve the conductivity of PPy–MWCNT, the nanocomposite was coated with Fe3O4 nanoparticles.163 The addition of 2.4 wt% of the nanoparticles boosted the conductivity to 68 S cm−1, which was still slightly lower than the value achieved by PPy/rGO composites. Therefore, this finding significantly illustrates the excellent conductivity imparted by graphene. It was also reported that the specific capacitance increased to 421.42 F g−1 at a GO loading of 10 wt%, which indicated that the presence of GO in the PPy matrix efficiently facilitates the formation of a charged electrostatic interface layer responsible for the capacitance. Similar improvements in electrical conductivity have been observed with significantly less graphene (1 wt%) using a different synthesis method.124 The in situ polymerization of PPy/graphene was modified by cationic polystyrenesulfonate (PSS). By the addition of only 1 wt% of graphene and 0.4 wt% of PSS, the nanocomposite film exhibited a conductivity as high as 32.55 S cm−1. This significant improvement was attributed to PSS, which served as a dopant incorporated into the PPy structure and efficiently improved the conductivity of the fabricated nanocomposites.

In another approach, polypyrrole/graphene nanosheets were synthesized via an in situ polymerization method with a pyrrole monomer and graphene nanosheets in an acidic condition.125 Graphene was initially prepared via the chemical reduction of graphene oxide with hydrazine hydrate. The nanocomposites were then prepared by polymerizing the pyrrole monomer in the presence of the graphene suspension. The PPy molecules surrounded the graphene in an entangled structure, probably bonding via the hydrogen bonding interaction and π–π stacking. The nanocomposites had a better capacitive performance and a better cycling stability even when the amount of graphene was low (6.7 wt%). The inference of the latter observation is that the addition of the graphene improved the mechanical properties of the fibers, preventing them from breaking during the charging and discharging.

Nanocomposites of PPy/GO have also been prepared using an electrochemical method,18,28 where the PPy was electro-oxidized in a suspension containing GO, and the anionic GO flakes were incorporated into the PPy/GO nanocomposites during growth. During this process, the GO was reduced electrochemically to form the PPy/RGO composite. The electrodeposited PPy/GO nanocomposites were highly porous, with a uniform PPy coating on the surface of two-dimensional GO sheets (Fig. 32a and b). The nanocomposites obtained by this method were flexible and freestanding (Fig. 32c). The films exhibited good electrochemical performance as well as improved cycle stability.


image file: c5ra07989f-f32.tif
Fig. 32 (a & b) FESEM images of PPy/RGO nanocomposites, (c) photograph of free-standing flexible PPy/GO nanocomposites. Reproduced with permission from ref. 18 (Copyright (2012) Elsevier).

The commercial adoption of this technology in supercapacitors will require the films to be economically viable but also in a form that can be easily used in a manufacturing process. The manufacture of a PPy/GO free standing nanocomposite paper18,28 addressed these issues.126 A precursor solution containing 0.1 g of GO and 1 mmol of pyrrole monomer were ultrasonicated and then oxidized by the addition of ammonium persulfate. The resultant mixture was filtered through a millipore filter and subjected to washing and drying to form the nanocomposite paper. The free-standing paper had a high specific capacitance (330 F g−1) measured with a high scan rate of 100 mV s−1. Furthermore, the nanocomposite paper showed only a 9% decrease in capacitance after 700 cycles at 100 mV s−1, indicating a superior electrochemical stability. For comparison purposes, a PPy/GO nanocomposite (20 wt%) prepared by liquid/liquid interfacial polymerization had a specific capacitance, at a 100 mV s−1 scan rate, of only 92.2 F g−1, with a high weight content of 20 wt%. Morphological analysis showed that the GO sheets were uniformly dispersed within the PPy matrix.128

2.7.2 Polyaniline/graphene/graphene oxide nanocomposites. PANI is one of the common yet unique conductive polymers mainly due to its electronic,164 thermoelectronic and good optical properties. However, less thermal stability and the stiffness of its polymer backbone limits its application in industrial field.165,166 Thus, numerous approach had been conducted in order to alter its characteristic. As reported in literature, a PANI/chemically converted graphene (CCG) composite film was prepared using a simple vacuum filtration method for a mixed suspension containing PANI nanofibers (PNF) and CCG.131 The prepared nanocomposite film possessed a layered sandwich morphology, with the PANI nanofibers sandwiched between the CCG layers. The unique arrangement was probably caused by the flow assembly of graphene sheets during the filtration process (Fig. 33a and b). As a result, the layered structure provided additional surface area, which is crucial for super-capacitor applications. Moreover, the fabricated PANI/CCG nanocomposite films possessed a free-standing property and were highly flexible, as shown in Fig. 33e. The electrochemical characterization on CCG/PNF30 wt% (PNF30) showed a conductivity of 5.5 × 10² S m−1, which was one order higher than pristine PANI nanofibers. Additionally, this value was much higher than previously reported literature which utilized carbon black (CB) nanoparticles/PANI nanocomposites.167 The electrical conductivity achieved was only up to 1.38 S cm−1 even with loading of CB (23 wt%). Similarly, the electrical conductivity of multiwalled carbon nanotube (MWCNT)/PANI nanocomposite was only 1.75 × 10⁻² S m−1 even with reinforcement of metallic components.168 Meanwhile, non-covalent coating of MWCNT with PANI nanosphere achieved 2.63 S cm−1 but with very high amount of CNT added (30 wt%).169 Using the films as electrodes in a double electrode supercapacitor cell, the measured specific capacitance was 210 F g−1 at a current density of 0.3 A g−1. Even after 800 charging/discharging cycles, the capacitance value remained at 155 F g−1.
image file: c5ra07989f-f33.tif
Fig. 33 Cross sectional SEM images of (a & b) CCG/PNF30, (c) pure CCG, (d) PANI-NF film; (e) photograph of flexible CCG/PNF30 film; (f) two-electrode configuration. Reprinted with permission from ref. 131 (Copyright (2010) American Chemical Society).

Another approach was attempted to prepare PANI/graphene nanocomposites by the oxidative polymerization of aniline monomers using ammonium peroxydisulfate as the solvent.130 The nanocomposite surface achieved an inter-penetrating network structure of PANI/graphene. At the aniline to graphene ratio of 1[thin space (1/6-em)]:[thin space (1/6-em)]2, the specific capacitance was recorded to be between 300 and 500 F g−1, with good cycling stability when measured over 100 cycles. These measurements were made at a lower current density of 0.1 A g−1 compared to the work discussed in the previous paragraph.

RGO sheets directly coated with PANI using an in situ polymerization technique were reported to have a worm-like morphology, with the paper and wrinkle structure of RGO but thickened as a result of the PANI coating on the surface.129 The specific capacitance was measured to be as high as 361 F g−1 at a current density of 0.3 A g−1, with the capacitance falling to 82% of its original value after 1000 cycles.

Layered graphene spray dried into porous microspheres was used as a substrate for the growth of polyaniline nanowire arrays using in situ polymerization.27 The crucial point of this technique was the formation of graphene microspheres within the nanocomposites, which were interconnected with few structural defects. These microspheres formed a highly conductive network that facilitated the electrical conductivity of the PANI. The PANI attached to the graphene sheets had a nanowire-like morphology; the diameter and length depended on the concentration of the aniline monomer (Fig. 34a and b). Furthermore, the specific capacitance only decreased to 87.4% of its original value after 10[thin space (1/6-em)]000 cycles at a current density of 3 A g−1 (Fig. 34c and d).


image file: c5ra07989f-f34.tif
Fig. 34 SEM images of PANI/GMS nanocomposites at different aniline concentrations of (a) 0.05 M, (b) 0.06 M; (c) graphs of specific capacitances of PANI, PANI, GNS, and PANI/GMS measured at different current densities; and (d) cycling profiles of PANI, PANI/GNS, and PANI/GMS measured at current density of 3 A g−1. Reproduced with permission from ref. 27 (Copyright (2013) Elsevier).

The post in situ reduction of graphene oxide/PANI nanocomposites was achieved and reported.132 PANI was synthesized via micro-emulsion polymerization, where nanosphere-scaled PANI was obtained. By utilizing the electrostatic attraction between the oppositely charged species (PANI was positively charged and GO was negatively charged), the species were attracted to each other. The resulting layer-by-layer PANI nanosphere coating on the GO was confirmed by SEM images, with porous channels observed within the nanostructure (Fig. 35). The composition of the nanocomposites was fixed by controlling the volume of the suspensions added. It was reported that the best composition of GO[thin space (1/6-em)]:[thin space (1/6-em)]PANI was 60/40, whereby the nanocomposites possessed both desirable morphological and electrochemical properties. The GO/PANI nanocomposites were further treated with hydrogen iodide (HI) to reduce the graphene oxide to graphene. As expected, the UV-Vis spectra indicated the major characteristic peaks of PANI. However, a new characteristic peak was detected at 268 nm, which corresponded to graphene. In addition, the absorption peaks of the nanocomposite were also reported to be broader, smaller, and recorded at higher wavelengths, therefore confirming the strong π–π conjugation between PANI and graphene.170 The unique morphology acquired was related to the vacuum-assisted self-assembly (VASA) and in situ reduction process applied. In order to relate the porous nanostructure to the capability of allowing penetration of electrolyte ions into the interior, an electrochemical performance test was conducted using the PANI/graphene nanocomposite as an electrode material. Both PANI and PANI/graphene showed typical pseudo-capacitance behaviors in the CV profiles (Fig. 36). However, the higher current density achieved for the nanocomposites indicated a higher specific capacitance. Similarly, the specific capacitance calculated for the PANI/graphene via the discharge curves at 0.5 A g−1 was 448 F g−1, which was much higher than that of a graphene film (133 F g−1) and PANI film on an SSE electrode (241 F g−1). The capacitance retention remained at 81% even after 5000 cycles of the charging/discharging process. This was attributed to the protection of the PANI nanospheres by sandwiching them between the graphene layers, which was realized through a layer-by-layer approach. This improved the mechanical properties and increased the cycling performance of the as-synthesized material.


image file: c5ra07989f-f35.tif
Fig. 35 SEM image of graphene/PANI film. The green arrow illustrates the porous structure of graphene/PANI film and the agglomerated PANI spheres on graphene sheets (red circle). Reprinted with permission from ref. 132 (Copyright (2014) Elsevier).

image file: c5ra07989f-f36.tif
Fig. 36 CV profiles of graphene/PANI, PANI on SSE and graphene (a); and cyclic stability of graphene/PANI and PANI measured at 2 A g−1. Reprinted with permission from ref. 132 (Copyright (2014) Elsevier).
2.7.3 Polyacetylene/graphene/graphene oxide nanocomposites. Graphene was covalently functionalized with polyacetylene (PAC) through a simple nitrene chemistry reaction.134 The reaction took place between reactive azido groups of the PAC backbone chains and graphene. The prepared PAC/graphene nanocomposites became soluble in different organic solvents, therefore providing a new alternative way to make graphene soluble in organic solvents. Another method to prepare water soluble graphene sheets133 was initiating the chemical reduction of GO in the presence of polyacetylene and a quaternary ammonium pendant (Pac) at a ratio of 1[thin space (1/6-em)]:[thin space (1/6-em)]3 (Pac/GO). The adsorption of Pac onto the graphene sheet was attributed to the π–π interaction and electrostatic interactions between the materials, resulting in an enhanced solubility of Pac/Go in water.
2.7.4 Poly(3,4-ethylenedioxythiophene)/graphene/graphene oxide nanocomposites. Poly(3,4-ethylenedioxythiophene) (PEDOT) is another popular type of conductive polymer due to its high flexibility, processability, and lower production cost compared to other conventional conductive inorganic materials. However, the application of this material in electronic devices is limited by its relatively low conductivity and poor mechanical features. Various methods have been tried to enhance the electrical properties such as in situ polymerization171–173 and vapor phase polymerization.174,175 Both methods improve the electrical conductivity. However, they fail to enhance the mechanical strength. In a recent attempt, graphene sheets were incorporated into a PEDOT matrix using the spin-coating method.60 The graphene was obtained by the reduction of a GO precursor using hydrazine hydrate. PEDOT was then spin-coated onto the graphene layer to produce a two-layer PEDOT/graphene composite film. For a three-layer graphene/PEDOT/graphene film, GO was initially spin-coated on a substrate, followed by a reduction process using hydrazine hydrate. The consecutively layer of PEDOT was spin-coated, whereby the surface of the PEDOT layer was treated with ozone to introduce hydrophilicity. Lastly, another layer of GO was spin-coated again before the reduction process in hydrazine vapor (Fig. 37). The two-layer composite film exhibited a smoother morphology than the initial PEDOT film, which consisted of many protruding surfaces with irregular shapes (Fig. 38). The formation of a uniform surface was attributed to the hydrophobicity of the graphene sheets. Interestingly, the morphology of the graphene/PEDOT/graphene composite was more uniform than the two-layer composite due to the stacking of graphene sheets onto the PEDOT layer. Furthermore, the conductivity of the graphene/PEDOT film was measured to be as high as 13 S cm−1, which is an improvement of over 100% compared to the conductivity of a pristine PEDOT film (6 S cm−1) (Fig. 39a). This value was also among the highest in electrical conductivity achieved for PEDOT, where previous works in modifying PEDOT achieved the conductivity of only 2.93 S cm−1 with addition of 27% of MWCNT.176 However, the three-layer film recorded a slightly lower conductivity of 12 S cm−1, which was caused by the insulating layer of GO found underneath the reduced graphene. The reduction process for the GO only occurred on the top side of the graphene layer. Mechanically, the double-layer composite film recorded a stress of 60 MPa at a 1.0% strain, whereas the three-layer film showed a stress of 65 MPa at a 1.0% strain (Fig. 39b).
image file: c5ra07989f-f37.tif
Fig. 37 Schematic diagram of fabrication process for graphene/PEDOT/graphene composite film. Adopted with permission from ref. 60 (Copyright (2010) ACS).

image file: c5ra07989f-f38.tif
Fig. 38 SEM images of (a) pristine PEDOT, (b) graphene, (c) graphene/PEDOT film, and (d) graphene/PEDOT/graphene film. Adopted with permission from ref. 60 (Copyright (2010) ACS).

image file: c5ra07989f-f39.tif
Fig. 39 Graphs of (a) conductivity and (b) stress–strain curves of pristine PEDOT, graphene/PEDOT, and graphene/PEDOT/graphene composite films. Adopted with permission from ref. 60 (Copyright (2010) ACS).

An alternative route for the fabrication of PEDOT/graphene oxide films for electrochemical sensing was attempted via electrodeposition from an aqueous solution containing a dispersion of GO and EDOT monomer.136 The electrochemical deposition was performed by cyclic voltammetry (CV) with the potential scanning fixed between −0.2 and 1.2 V vs. an Ag/AgCl electrode at a scan rate of 100 mV s−1, under the conditions of magnetic stirring and continuous nitrogen gas bubbling. The deposited film was described as uniformly deposited on the surface of the glassy carbon electrode (GCE), showing high roughness and a loose structure formed by wrinkle-like sheets. The composite film exhibited good electrical performance, with a much lower charge transfer resistance (Rct). This was attributed to the higher specific surface area, which facilitated the electron transfer between the solution and electrode interface.

The effect of varying the process parameters has been studied for a PEDOT/GO composite films synthesized by electrochemical reduction reactions.135 A two-step process was performed. First, a PEDOT/GO film was electrodeposited on GCE or tin-oxide glass (TO glass) from an aqueous mixture of GO/EDOT at constant potentials of 0.94, 0.97, and 1.05 V. Then, an electrochemical reduction was carried under an inert atmosphere in 0.1 M KCl solution at a fixed potential of −0.85 V vs. an Ag/AgCl electrode for 10, 20, or 30 min. The negative surface charges on the GO were able to serve as the counter ions in the electropolymerization of the PEDOT. As shown in Fig. 40a and c, the surface morphology of the PEDOT/GO film became more wrinkled, and there was an increase in surface roughness as the reduction reaction time increased (Fig. 40e and f). In addition, the cross-sectional views of the composite films indicated that they exhibited a layered structure in a compact and well-ordered form (Fig. 40b and d). Although XPS analysis confirmed that the reduction reaction removed the epoxy and hydroxyl groups from the GO surface, the electrical conductivity of the polymer matrix increased only marginally from 9.8 × 10⁻⁵ S cm−1 to 1.0 × 10⁻⁴ S cm−1 when the reduction time of the PEDOT/GO on TO was increased from 0 to 30 min.


image file: c5ra07989f-f40.tif
Fig. 40 SEM micrographs of PEDOT/GO films electrochemically reduced at −0.85 V for (a & b) 0 min and (c & d) 20 min, where (b) and (d) show cross sections. AFM images of PEDOT–GO films reduced at −0.85 V for (e) 0 min and (f) 20 min. Reproduced with permission from ref. 135 (Copyright (2013) Elsevier).

Electrochemical polymerization has also been utilized to fabricate PEDOT/modified graphene composites for energy storage applications.26 Prior to electro-polymerization, the graphene was chemically functionalized in a sulphuric/nitric acid mixture (3[thin space (1/6-em)]:[thin space (1/6-em)]1) and sonicated for 6 h. The suspension was filtered on a carbon cloth to form a graphene paper layer (GP/CC). The GP/CC was used as a substrate for the electro-deposition to occur, at a fixed potential of 1.2 V versus Ag/AgCl electrode in acetonitrile. The prepared composites were immersed in Pt solution for 24 h. After coating the CC with the graphene layer, a sheet-like structure with wrinkles was observed. PEDOT particulates on the GP/CC were observed, and they had a higher density than the PEDOT deposited on CC. Interestingly, the capacitive performance of the PEDOT/GP/CC measured in a three-electrode configuration using a Ag/AgCl reference cell was as high as 714.93 F g−1, which is approximately 6 orders of magnitude higher than that of PEDOT/CC. This effect was attributed to the high specific surface area of graphene.

2.7.5 Poly(3-aminobenzene sulfonic acid)/graphene nanocomposites. The application of poly(3-aminobenzene sulfonic acid) (PABS) conducting polymers in electronic fields has rarely been reported elsewhere in the literature. However, Pham et al. reported on the fabrication of water-dispersible GNS functionalized with PABS to induce hydrophilicity.71 The modification was performed via the covalent bonding of PABS on GO, based on the amidation reaction between the acyl chloride groups present on the GO surface after modification with the amino group present on the polymers, as shown in the illustration in Fig. 41a. The GO eventually reduced to graphene via a chemical reduction method using sodium borohydride (NaBH4). The presence of sulfur and nitrogen elements on PABS-grafted-GNS (PABS-g-GNS) was confirmed via an EDX spectrum, which showed the successful chemical grafting of PABS on the GNS surface through amide bonds. Furthermore, the molar ratio of O to C decreased from 0.387 to 0.197, indicating that the reduction process converted GO to graphene. Moreover, the surface modification was observed and confirmed via FESEM, as shown in Fig. 41b and c. The electrical conductivity of PABS-g-GNS was recorded at 29.4 S m−1, which was better than that of pristine GO (3.1 × 10⁻⁶ S m−1). However, the result was not sufficient to prove the improvement by the hybrid functionalization, as the increase in conductivity might be due to the reduction of graphene oxide species to graphene. In order to examine the hydrophilicity, the prepared PABS-g-GNS (0.5 mg mL−1) was dispersed into distilled water, followed by ultrasonication for 30 min. The dispersibility of the PABS-functionalized GNS dramatically increased compared to graphene oxide, as shown in Fig. 42, indicating the presence of covalently bonded PABS, which served as hydrophilic groups.
image file: c5ra07989f-f41.tif
Fig. 41 The schematic illustration in functionalization of graphene oxide by PABS and FESEM images of (b) GO and (c) PABS-g-GNS. Reproduced with permission from ref. 71 (Copyright (2012) Elsevier).

image file: c5ra07989f-f42.tif
Fig. 42 Digital images of dispersed states in distilled water of GO (a) and PABS-g-GNS (b). The image of dispersed state of PABS-g-GNS (c) shows a negligible aggregation at the bottom of vial. The images were taken after 2 weeks of storage at room temperature. Adopted with permission from ref. 71 (Copyright (2012) Elsevier).
2.7.6 Contributions and challenges. Electronically conductive polymers have received so much attention mainly because they generally conduct electricity, as well as highly desirable polymer properties such as flexibility, low density and ease of structural modifications. The introduction of graphene has successfully contributed a large area, highly conductive template with beneficial tensile strength towards the overall composites structure. Especially in the field of energy storage/conversion system, graphene provides mechanical strength which stabilize the composites structure, allowing continuous infuse/outflow of electrolytes ions without suffering mechanical degradation/rupture. Additionally, the high conductivity of graphene template indirectly minimize the resistance occurred throughout the transfer of electrons between the electrode/electrolyte boundaries. Despite all the advantages, the critical challenge relies on designing an efficient composite structure with proper spacing of individual graphene layers. The appropriate graphene spacing effectively prevents restacking and retaining high surface area of graphene, while providing empty spaces for molecules or ions to intercalate. These issues encourage more future works worth for uptake as the current potential of graphene in conductive polymers is highly promising.

3. Summary and perspectives

There is no doubt that polymeric-based graphene nanocomposites are some of the most scientifically promising advancements in graphene-based materials and polymeric components. Despite the rapid developments, there are still numerous challenges that must be tackled and considered in order to unleash their full performance. For example, although it has been reported that pristine graphene is capable of being homogenously dispersed within the polymer matrix of some organic polymers, the π–π stacking interactions often result in the agglomeration of graphene sheets within the polymer matrix, which results in non-homogeneous morphologies and inferior properties. In order to improve the properties, the dispersion of graphene within the polymer components needs to be enhanced, which has been attempted by the surface modification of graphene sheets with functional groups. The surface modification of graphene involves a wide range of techniques that have been carried out by numerous researchers with various modifying agents, including amphiphilic copolymers,55 organo-modifying agents such as phenylisocyanate,70 and polyacetylene,133,134 for which it was reported that the functionalized graphene sheets were soluble in water. The solvent dispersible properties of graphene play an important role in facilitating the preparation of polymer-based graphene composites.

The preparation methods, characterizations, and properties of polymer composites filled with different graphene-based nanofillers were discussed thoroughly in this review. Generally, the majority of the properties of polymer/graphene nanocomposites were shown to be much greater than the pristine matrix. These improvements were obtained mainly at a minute amount of graphene loading (approx. 1–5 wt%),22,53,91,101,105,148 while higher graphene loading (>20 wt%)91 mostly resulted in adverse effects. However, the input amount of the graphene is closely related to the final properties of the polymer matrix. The following enhancements in the properties of polymer-based graphene composites were discussed:

(i) Graphene/polymer nanocomposites exhibited significant enhancements in mechanical properties compared to the pristine polymer. However, different preparation methods eventually affected the properties achieved. For example, PEO/graphene nanocomposites13 prepared by solution casting recorded a remarkable enhancement in tensile strength as high as 189% compared to 104% for melt blending, which was attributed to the high aspect ratio of graphene and its better dispersion throughout the polymer matrix by solution mixing.

(ii) Thermal stability enhancement is another interesting feature offered by using a graphene nanofiller in the preparation of thermally stable nanocomposites. Graphene/polymer nanocomposites often showed better thermal stability than that of the neat polymer matrix. In some cases, the material showed a 30 °C improvement in the onset degradation temperature with the addition of only 1.4 wt% of graphene. This distinctive feature of a graphene nanofiller was attributed to the large specific area of the graphene sheets, which covered and hindered the escape of volatile components within the polymer matrix, therefore increasing the thermal degradation temperature.

(iii) The electrical conductivity of graphene-filled polymer nanocomposites was enhanced by several orders of magnitude compared to the neat polymer. The remarkable enhancement in electrical conductivity was due to the formation of a conducting network by graphene sheets within the polymer matrix. However, the conductivities highly depended on the type of host polymer matrix, the dispersion of the filler within the matrix, and the type of graphene-based filler added. Most of the several-fold conductivity enhancements could be achieved even at a low graphene content (<5 wt%).12,20,22

(iv) A homogenous distribution of graphene within the polymer matrix also enhanced the gas barrier properties. The vapor permeation rate decreased significantly (up to six fold) compared to the neat polymer30 due to the high specific area of graphene within the polymer matrix, which effectively extended the path of the water vapor passing through the film.

(v) The addition of graphene significantly enhanced the electrochemical activity of conductive polymers. Both PANI/graphene130 and PPy/graphene films28 showed remarkable enhancements in the capacitance performance (by up to several times).

This review of conductive polymer/graphene nanocomposites emphasized their potential applications in energy storage and electrical devices in the future, including electrodes for supercapacitors, fuel-cells, and lithium-ion batteries. Furthermore, the implementation of graphene nanofillers in conductive polymer matrices has opened up a whole new area of research on the fabrication of low-cost, lightweight, and excellent-performance nanocomposite materials for a wide range of applications.

An excellent combination of graphene and polymer depended heavily on the dispersion of the two components within the composite structure. Numerous efforts had been reported in literatures, each trying to achieve improved interfacial by focusing on functional groups interactions between graphene and polymeric chains. Furthermore, graphene functionalization had been proven to effectively improve the dispersion of graphene within the polymer matrices by displaying significant enhancement in the properties of the prepared composites. Nevertheless, the main challenge is to ensure the effective separation of graphene layers, in which proper spacing dimension is ensured to maximize the surface area of graphene while maintaining nano-engineered space for polymeric chains to intercalate effectively.

List of Abbreviations

ATRPAtom transfer radical polymerization
LDPELow density poly(ethylene)
GOGraphene oxide
CNTCarbon nanotubes
PHAPolyhydroxyalkanoates
PPyPolypyrrole
PACPolyacetylene
PANIPolyaniline
PEDOTPoly(3,4-ethylenedioxythiophene)
PTFEPolytetrafluoroethylene
DMFN,N-Dimethylformamide
GCEGlassy carbon electrode
ITOIndium-doped tin oxide glass
RAFTReversible addition–fragmentation chain transfer polymerization
SET-LRPSingle-electron transfer living radical polymerization
NMRPNitroxide-mediated radical polymerization
PLAPoly(lactic acid)
PDLAPoly(D-lactide)
RGOReduced graphene oxide
PANPolyacrylonitrile
PVAPolyvinylalcohol
PtPlatinum
TEMTransmission electrode microscope
COST/GO-nChitosan/oxidized starch/graphene oxide
DMACN,N-Dimethylacetamide
LiClLithium chloride
GO-g-PDLAGraphene oxide-grafted-PDLA
PLLAPoly(L-lactide)
FT-IRFourier-transform infrared spectroscopy
PSPolystyrene
SDSSodium dodecyl sulfate
UV-VisUV-visible spectroscopy
GNSGraphene nanosheets
Ag/AgClSilver/silver chloride reference electrode
H2SO4Sulphuric acid
VTESVinyl triethoxysilane
SAStearic acid
SA-g-RGOStearic acid-grafted-RGO
PETPoly(ethylene terephthalate)
PEPoly(ethylene)
PNIPAMPoly(N-isopropylacrylamide)
PMMAPoly(methyl methacrylate)
CMGChemically reduced graphene oxide
NMRNuclear magnetic resonance spectroscopy
PGMAPoly(glycidyl methacrylate)
TEMTransmission electron microscopy
OBDOrganic bistable device
PCLPoly(caprolactone)
PVDFPolyvinylidene fluoride
PUPolyurethane
THFTetrahydrofuran
WPUWaterborne polyurethane
FGSFunctionalized graphene nanosheets
GONSGO nanosheets
HPUHyper-branched polyurethane
MEGOMicrowave-exfoliated graphite oxide
f-GOFunctionalized graphene oxide
PEOPoly(ethylene oxide)
XRDX-ray diffraction spectroscopy
AFMAtomic force microscopy
PIPolyimide
OTROxygen transfer rate
WVTRWater-vapor transmission rate
DMSODimethyl sulfoxide
PCPolycarbonate
VASAVacuum-assisted self-assembly
CVCyclic voltammetry
SSESilver/silver sulfate electrode
PABSPoly(3-aminobenzene sulfonic acid)
wt%Weight percentage

Acknowledgements

This work was supported by a Newton-Ungku Omar Fund.

References

  1. D. R. Dreyer, S. Park, C. W. Bielawski and R. S. Ruoff, Chem. Soc. Rev., 2010, 39, 228–240 RSC.
  2. Y. Zhu, S. Murali, W. Cai, X. Li, J. W. Suk, J. R. Potts and R. S. Ruoff, Adv. Mater., 2010, 22, 3906–3924 CrossRef CAS PubMed.
  3. C. Lee, X. Wei, J. W. Kysar and J. Hone, Science, 2008, 321, 385–388 CrossRef CAS PubMed.
  4. T. Kuilla, S. Bhadra, D. Yao, N. H. Kim, S. Bose and J. H. Lee, Prog. Polym. Sci., 2010, 35, 1350–1375 CrossRef CAS PubMed.
  5. D. Li, M. B. Müller, S. Gilje, R. B. Kaner and G. G. Wallace, Nat. Nanotechnol., 2008, 3, 101–105 CrossRef CAS PubMed.
  6. J.-U. Lee, D. Yoon, H. Kim, S. W. Lee and H. Cheong, Phys. Rev. B: Condens. Matter Mater. Phys., 2011, 83, 081419 CrossRef.
  7. A. Saha, C. Jiang and A. A. Martí, Carbon, 2014, 79, 1–18 CrossRef CAS PubMed.
  8. M. Liang, B. Luo and L. Zhi, Int. J. Energy Res., 2009, 33, 1161–1170 CrossRef CAS PubMed.
  9. B. Brodie, Ann. Chim. Phys., 1860, 59, 466–472 Search PubMed.
  10. L. Staudenmaier, Ber. Dtsch. Chem. Ges., 1898, 31, 1481–1487 CrossRef CAS PubMed.
  11. W. S. Hummers Jr and R. E. Offeman, J. Am. Chem. Soc., 1958, 80, 1339 CrossRef.
  12. H. W. Ha, A. Choudhury, T. Kamal, D.-H. Kim and S.-Y. Park, ACS Appl. Mater. Interface, 2012, 4, 4623–4630 CrossRef CAS PubMed.
  13. W. E. Mahmoud, Eur. Polym. J., 2011, 47, 1534–1540 CrossRef CAS PubMed.
  14. K.-C. Chang, H.-I. Lu, M.-C. Lai, C.-H. Hsu, Y.-R. Hsiao, K.-Y. Huang, T.-L. Chuang, J.-M. Yeh and W.-R. Liu, Polym. Int., 2013, 63, 1011–1017 CrossRef PubMed.
  15. M. Koo, J.-S. Bae, S. Shim, D. Kim, D.-G. Nam, J.-W. Lee, G.-W. Lee, J. Yeum and W. Oh, Colloid Polym. Sci., 2011, 289, 1503–1509 CAS.
  16. J. N. Ding, Y. Fan, C. X. Zhao, Y. B. Liu, C. T. Yu and N. Y. Yuan, J. Compos. Mater., 2012, 46, 747–752 CrossRef CAS PubMed.
  17. Y. S. Lim, Y. P. Tan, H. N. Lim, W. T. Tan, M. A. Mahnaz, Z. A. Talib, N. M. Huang, A. Kassim and M. A. Yarmo, J. Appl. Polym. Sci., 2013, 128, 224–229 CrossRef CAS PubMed.
  18. C. Zhu, J. Zhai, D. Wen and S. Dong, J. Mater. Chem., 2012, 22, 6300–6306 RSC.
  19. G. Natta and P. Corradini, Nuovo Cimento, 1960, 15, 40–51 CrossRef CAS.
  20. J. Bian, H. L. Lin, F. X. He, X. W. Wei, I. T. Chang and E. Sancaktar, Composites, Part A, 2013, 47, 72–82 CrossRef CAS PubMed.
  21. B. W. Chieng, N. A. Ibrahim and W. M. Z. W. Yunus, Polym.-Plast. Technol. Eng., 2012, 51, 791–799 CrossRef CAS PubMed.
  22. S. Rana, J. W. Cho and L. P. Tan, RSC Adv., 2013, 3, 13796–13803 RSC.
  23. H.-B. Zhang, W.-G. Zheng, Q. Yan, Y. Yang, J.-W. Wang, Z.-H. Lu, G.-Y. Ji and Z.-Z. Yu, Polymer, 2010, 51, 1191–1196 CrossRef CAS PubMed.
  24. J. R. Potts, S. H. Lee, T. M. Alam, J. An, M. D. Stoller, R. D. Piner and R. S. Ruoff, Carbon, 2011, 49, 2615–2623 CrossRef CAS PubMed.
  25. F. D. C. Fim, N. R. S. Basso, A. P. Graebin, D. S. Azambuja and G. B. Galland, J. Appl. Polym. Sci., 2013, 128, 2630–2637 CrossRef CAS PubMed.
  26. C.-Y. Chu, J.-T. Tsai and C.-L. Sun, Int. J. Hydrogen Energy, 2012, 37, 13880–13886 CrossRef CAS PubMed.
  27. H. Cao, X. Zhou, Y. Zhang, L. Chen and Z. Liu, J. Power Sources, 2013, 243, 715–720 CrossRef CAS PubMed.
  28. Y. S. Lim, Y. P. Tan, H. N. Lim, N. M. Huang and W. T. Tan, J. Polym. Res., 2013, 20, 1–10 CAS.
  29. J. Wang, C. Xu, H. Hu, L. Wan, R. Chen, H. Zheng, F. Liu, M. Zhang, X. Shang and X. Wang, J. Nanopart. Res., 2011, 13, 869–878 CrossRef CAS.
  30. I. H. Tseng, Y.-F. Liao, J.-C. Chiang and M.-H. Tsai, Mater. Chem. Phys., 2012, 136, 247–253 CrossRef CAS PubMed.
  31. Q. Xu, H. Xu, J. Chen, Y. Lv, C. Dong and T. S. Sreeprasad, Inorg. Chem. Front., 2015, 2, 417–424 RSC.
  32. A. A. Shah, F. Hasan, A. Hameed and S. Ahmed, Biotechnol. Adv., 2008, 26, 246–265 CrossRef CAS PubMed.
  33. K. Madhavan Nampoothiri, N. R. Nair and R. P. John, Bioresour. Technol., 2010, 101, 8493–8501 CrossRef CAS PubMed.
  34. Y. Wang, Z. Shi, Y. Huang, Y. Ma, C. Wang, M. Chen and Y. Chen, J. Phys. Chem. C, 2009, 113, 13103–13107 CAS.
  35. B. F. Cvetko, M. P. Brungs, R. P. Burford and M. Skyllas-Kazacos, J. Appl. Electrochem., 1987, 17, 1198–1202 CrossRef CAS.
  36. K. Ehinger, S. Summerfield and S. Roth, Colloid Polym. Sci., 1985, 263, 714–719 CAS.
  37. N. Basescu, J. Chiang, S. Rughooputh, T. Kubo, C. Fite and A. J. Heeger, Synth. Met., 1989, 28, D43–D50 CrossRef CAS.
  38. E. K. Sichel, M. Knowles, M. Rubner and J. Georger Jr, Phys. Rev. B: Condens. Matter Mater. Phys., 1982, 25, 5574–5577 CrossRef CAS.
  39. Y. W. Park, C. Park, Y. S. Lee, C. O. Yoon, H. Shirakawa, Y. Suezaki and K. Akagi, Solid State Commun., 1988, 65, 147–150 CrossRef CAS.
  40. Y. W. Park, C. O. Yoon, C. H. Lee, H. Shirakawa, Y. Suezaki and K. Akagi, Synth. Met., 1989, 28, D27–D34 CrossRef CAS.
  41. W.-S. Huang, B. D. Humphrey and A. G. MacDiarmid, J. Chem. Soc., Faraday Trans. 1, 1986, 82, 2385–2400 RSC.
  42. X. Crispin, F. L. E. Jakobsson, A. Crispin, P. C. M. Grim, P. Andersson, A. Volodin, C. van Haesendonck, M. van der Auweraer, W. R. Salaneck and M. Berggren, Chem. Mater., 2006, 18, 4354–4360 CrossRef CAS.
  43. X. Huang, X. Qi, F. Boey and H. Zhang, Chem. Soc. Rev., 2012, 41, 666–686 RSC.
  44. D. Chen, L. Tang and J. Li, Chem. Soc. Rev., 2010, 39, 3157–3180 RSC.
  45. X.-Y. Qi, D. Yan, Z. Jiang, Y.-K. Cao, Z.-Z. Yu, F. Yavari and N. Koratkar, ACS Appl. Mater. Interface, 2011, 3, 3130–3133 CrossRef CAS PubMed.
  46. J. Liang, Y. Huang, L. Zhang, Y. Wang, Y. Ma, T. Guo and Y. Chen, Adv. Funct. Mater., 2009, 19, 2297–2302 CrossRef CAS PubMed.
  47. P. Song, Z. Cao, Y. Cai, L. Zhao, Z. Fang and S. Fu, Polymer, 2011, 52, 4001–4010 CrossRef CAS PubMed.
  48. H.-H. Chang, C.-K. Chang, Y.-C. Tsai and C.-S. Liao, Carbon, 2012, 50, 2331–2336 CrossRef CAS PubMed.
  49. Q. Wang, Y. Du, Q. Feng, F. Huang, K. Lu, J. Liu and Q. Wei, J. Appl. Polym. Sci., 2013, 128, 1152–1157 CrossRef CAS PubMed.
  50. H. K. F. Cheng, N. G. Sahoo, Y. P. Tan, Y. Pan, H. Bao, L. Li, S. H. Chan and J. Zhao, ACS Appl. Mater. Interface, 2012, 4, 2387–2394 CrossRef CAS PubMed.
  51. J. Ma, C. Liu, R. Li and J. Wang, J. Appl. Polym. Sci., 2012, 123, 2933–2944 CrossRef CAS PubMed.
  52. C. Rodríguez-González, A. L. Martínez-Hernández, V. M. Castaño, O. V. Kharissova, R. S. Ruoff and C. Velasco-Santos, Ind. Eng. Chem. Res., 2012, 51, 3619–3629 CrossRef.
  53. X. Li, Y. Xiao, A. Bergeret, M. Longerey and J. Che, Polym. Compos., 2014, 35, 396–403 CrossRef CAS PubMed.
  54. D. Wu, Y. Cheng, S. Feng, Z. Yao and M. Zhang, Ind. Eng. Chem. Res., 2013, 52, 6731–6739 CrossRef CAS.
  55. I. Tantis, G. C. Psarras and D. Tasis, eXPRESS Polym. Lett., 2012, 6, 283–292 CrossRef CAS.
  56. L. Fei, H. Ruimei, H. Xingyi and J. Pingkai, Solid Dielectrics (ICSD), 2013 IEEE International Conference on Solid Dielectrics, Bologna, Italy, 2013, pp. 919–922 Search PubMed.
  57. H. Kim and C. W. Macosko, Polymer, 2009, 50, 3797–3809 CrossRef CAS PubMed.
  58. S. Bose, T. Kuila, M. E. Uddin, N. H. Kim, A. K. T. Lau and J. H. Lee, Polymer, 2010, 51, 5921–5928 CrossRef CAS PubMed.
  59. F. Wu, Y. Lu, G. Shao, F. Zeng and Q. Wu, Polym. Int., 2012, 61, 1394–1399 CrossRef CAS PubMed.
  60. K. S. Choi, F. Liu, J. S. Choi and T. S. Seo, Langmuir, 2010, 26, 12902–12908 CrossRef CAS PubMed.
  61. C. Yu, Y. S. Kim, D. Kim and J. C. Grunlan, Nano Lett., 2008, 8, 4428–4432 CrossRef CAS PubMed.
  62. A. S. Patole, S. P. Patole, H. Kang, J.-B. Yoo, T.-H. Kim and J.-H. Ahn, J. Colloid Interface Sci., 2010, 350, 530–537 CrossRef CAS PubMed.
  63. H. Park, S. J. Lee, S. Kim, H. W. Ryu, S. H. Lee, H. H. Choi, I. W. Cheong and J.-H. Kim, Polymer, 2013, 54, 4155–4160 CrossRef CAS PubMed.
  64. J. Doshi and D. H. Reneker, J. Electrost., 1995, 35, 151–160 CrossRef CAS.
  65. G. Taylor, Proc. R. Soc. London, Ser. A, 1969, 313, 453–475 CrossRef.
  66. N. Bhardwaj and S. C. Kundu, Biotechnol. Adv., 2010, 28, 325–347 CrossRef CAS PubMed.
  67. A. Greiner and J. H. Wendorff, Angew. Chem., Int. Ed., 2007, 46, 5670–5703 CrossRef CAS PubMed.
  68. T. Subbiah, G. S. Bhat, R. W. Tock, S. Parameswaran and S. S. Ramkumar, J. Appl. Polym. Sci., 2005, 96, 557–569 CrossRef CAS PubMed.
  69. W. Huang, S. Wang, C. Guo, X. Yang, Y. Li and Y. Tu, Polymer, 2014, 55, 4619–4626 CrossRef CAS PubMed.
  70. E. Thangavel, S. Ramasundaram, S. Pitchaimuthu, S. W. Hong, S. Y. Lee, S.-S. Yoo, D.-E. Kim, E. Ito and Y. S. Kang, Compos. Sci. Technol., 2014, 90, 187–192 CrossRef CAS PubMed.
  71. T. A. Pham, J. S. Kim, D. Kim and Y. T. Jeong, Polym. Eng. Sci., 2012, 52, 1854–1861 CAS.
  72. K. Matyjaszewski, Macromolecules, 2012, 45, 4015–4039 CrossRef CAS.
  73. A. Badri, M. R. Whittaker and P. B. Zetterlund, J. Polym. Sci., Part A: Polym. Chem., 2012, 50, 2981–2992 CrossRef CAS PubMed.
  74. B. Ou, Z. Zhou, Q. Liu, B. Liao, S. Yi, Y. Ou, X. Zhang and D. Li, Polym. Chem., 2012, 3, 2768–2775 RSC.
  75. B. Zhang, Y. Chen, L. Xu, L. Zeng, Y. He, E.-T. Kang and J. Zhang, J. Polym. Sci., Part A: Polym. Chem., 2011, 49, 2043–2050 CrossRef CAS PubMed.
  76. H. M. Etmimi, M. P. Tonge and R. D. Sanderson, J. Polym. Sci., Part A: Polym. Chem., 2011, 49, 1621–1632 CrossRef CAS PubMed.
  77. Y. Deng, Y. Li, J. Dai, M. Lang and X. Huang, J. Polym. Sci., Part A: Polym. Chem., 2011, 49, 4747–4755 CrossRef CAS PubMed.
  78. X. Chen, L. Yuan, P. Yang, J. Hu and D. Yang, J. Polym. Sci., Part A: Polym. Chem., 2011, 49, 4977–4986 CrossRef CAS PubMed.
  79. H. Zeng, C. Gao, Y. Wang, P. C. P. Watts, H. Kong, X. Cui and D. Yan, Polymer, 2006, 47, 113–122 CrossRef CAS PubMed.
  80. Z. Xu and C. Gao, Macromolecules, 2010, 43, 6716–6723 CrossRef CAS.
  81. X. Zhang, X. Liu, W. Zheng and J. Zhu, Carbohydr. Polym., 2012, 88, 26–30 CrossRef CAS PubMed.
  82. X. Wang, H. Bai, Z. Yao, A. Liu and G. Shi, J. Mater. Chem., 2010, 20, 9032–9036 RSC.
  83. R. Li, C. Liu and J. Ma, Carbohydr. Polym., 2011, 84, 631–637 CrossRef CAS PubMed.
  84. Y. Sun and C. He, ACS Macro Lett., 2012, 1, 709–713 CrossRef CAS.
  85. H. I. Joh, H. K. Song, C. H. Lee, J. M. Yun, S. M. Jo, S. H. Lee, S. I. Na, A. T. Chien and S. Kumar, Carbon, 2014, 70, 308–312 CrossRef CAS PubMed.
  86. S. Lee, Y.-J. Kim, D.-H. Kim, B.-C. Ku and H.-I. Joh, J. Phys. Chem. Solids, 2012, 73, 741–743 CrossRef CAS PubMed.
  87. M. Yoonessi and J. R. Gaier, ACS Nano, 2010, 4, 7211–7220 CrossRef CAS PubMed.
  88. G. Gedler, M. Antunes, V. Realinho and J. I. Velasco, Polym. Degrad. Stab., 2012, 97, 1297–1304 CrossRef CAS PubMed.
  89. J. Zhang and Z. Qiu, Ind. Eng. Chem. Res., 2011, 50, 13885–13891 CrossRef CAS.
  90. C. Wan and B. Chen, Biomed. Mater., 2011, 6, 055010 CrossRef PubMed.
  91. J. Zhu, J. Lim, C.-H. Lee, H.-I. Joh, H. C. Kim, B. Park, N.-H. You and S. Lee, J. Appl. Polym. Sci., 2014, 131 DOI:10.1002/app.40177.
  92. L. Ma, H. Niu, J. Cai, P. Zhao, C. Wang, X. Bai, Y. Lian and W. Wang, Carbon, 2014, 67, 488–499 CrossRef CAS PubMed.
  93. K. P. Pramoda, K. Y. Mya, T. T. Lin, X. Lu and C. He, Polym. Eng. Sci., 2012, 52, 2530–2536 CAS.
  94. H. Liu, Y. Li, T. Wang and Q. Wang, J. Mater. Sci., 2012, 47, 1867–1874 CrossRef CAS.
  95. N. D. Luong, U. Hippi, J. T. Korhonen, A. J. Soininen, J. Ruokolainen, L.-S. Johansson, J.-D. Nam, L. H. Sinh and J. Seppälä, Polymer, 2011, 52, 5237–5242 CrossRef PubMed.
  96. D. Li and G. S. Sur, Macromol. Res., 2014, 22, 113–116 CrossRef CAS.
  97. A. V. Raghu, Y. R. Lee, H. M. Jeong and C. M. Shin, Macromol. Chem. Phys., 2008, 209, 2487–2493 CrossRef CAS PubMed.
  98. S. H. Choi, D. H. Kim, A. V. Raghu, K. R. Reddy, H.-I. Lee, K. S. Yoon, H. M. Jeong and B. K. Kim, J. Macromol. Sci., Part B: Phys., 2012, 51, 197–207 CrossRef CAS PubMed.
  99. S. Thakur and N. Karak, RSC Adv., 2013, 3, 9476–9482 RSC.
  100. U. Khan, P. May, A. O'Neill and J. N. Coleman, Carbon, 2010, 48, 4035–4041 CrossRef CAS PubMed.
  101. Y. Li, D. Pan, S. Chen, Q. Wang, G. Pan and T. Wang, Mater. Des., 2013, 47, 850–856 CrossRef CAS PubMed.
  102. Y. R. Lee, S. C. Kim, H.-i. Lee, H. M. Jeong, A. V. Raghu, K. R. Reddy and B. K. Kim, Macromol. Res., 2011, 19, 66–71 CrossRef CAS.
  103. L. Wu, Alamusi, J. Xue, T. Itoi, N. Hu, Y. Li, C. Yan, J. Qiu, H. Ning, W. Yuan and B. Gu, J. Intell. Mater. Syst. Struct., 2014, 25, 1813–1824 CrossRef CAS PubMed.
  104. D. A. Zha, S. Mei, Z. Wang, H. Li, Z. Shi and Z. Jin, Carbon, 2011, 49, 5166–5172 CrossRef CAS PubMed.
  105. S. Tripathi, P. Saini, D. Gupta and V. Choudhary, J. Mater. Sci., 2013, 48, 6223–6232 CrossRef CAS.
  106. X. Zeng, J. Yang and W. Yuan, Eur. Polym. J., 2012, 48, 1674–1682 CrossRef CAS PubMed.
  107. D. I. Son, T. W. Kim, J. H. Shim, J. H. Jung, D. U. Lee, J. M. Lee, W. I. Park and W. K. Choi, Nano Lett., 2010, 10, 2441–2447 CrossRef CAS PubMed.
  108. K. Zhang, W. Zhang and H. Choi, Colloid Polym. Sci., 2013, 291, 955–962 CAS.
  109. J. Yang, X. Yan, M. Wu, F. Chen, Z. Fei and M. Zhong, J. Nanopart. Res., 2012, 14, 1–9 Search PubMed.
  110. T. Kuila, S. Bose, P. Khanra, N. H. Kim, K. Y. Rhee and J. H. Lee, Composites, Part A, 2011, 42, 1856–1861 CrossRef PubMed.
  111. S. Kim, J.-B. Yoo, G.-R. Yi, Y. Lee, H. R. Choi, J. C. Koo, J.-S. Oh and J.-D. Nam, J. Mater. Chem. C, 2014, 2, 6462–6466 RSC.
  112. V. Alzari, D. Nuvoli, S. Scognamillo, M. Piccinini, E. Gioffredi, G. Malucelli, S. Marceddu, M. Sechi, V. Sanna and A. Mariani, J. Mater. Chem., 2011, 21, 8727–8733 RSC.
  113. Y. Pan, H. Bao, N. G. Sahoo, T. Wu and L. Li, Adv. Funct. Mater., 2011, 21, 2754–2763 CrossRef CAS PubMed.
  114. M. Li and Y. G. Jeong, Composites, Part A, 2011, 42, 560–566 CrossRef PubMed.
  115. S. Bandla and J. Hanan, J. Mater. Sci., 2012, 47, 876–882 CrossRef CAS.
  116. S. J. Han, H.-I. Lee, H. Mo Jeong, B. K. Kim, A. V. Raghu and K. R. Reddy, J. Macromol. Sci., Part B: Phys., 2014, 53, 1193–1204 CrossRef CAS PubMed.
  117. B. Shen, W. Zhai, C. Chen, D. Lu, J. Wang and W. Zheng, ACS Appl. Mater. Interface, 2011, 3, 3103–3109 CrossRef CAS PubMed.
  118. H. Pang, C. Chen, Y.-C. Zhang, P.-G. Ren, D.-X. Yan and Z.-M. Li, Carbon, 2011, 49, 1980–1988 CrossRef CAS PubMed.
  119. J. Yang, M. Wu, F. Chen, Z. Fei and M. Zhong, J. Supercrit. Fluids, 2011, 56, 201–207 CrossRef CAS PubMed.
  120. R. K. Layek, S. Samanta and A. K. Nandi, Carbon, 2012, 50, 815–827 CrossRef CAS PubMed.
  121. C. Bao, Y. Guo, L. Song and Y. Hu, J. Mater. Chem., 2011, 21, 13942–13950 RSC.
  122. X. Yang, L. Li, S. Shang and X. M. Tao, Polymer, 2010, 51, 3431–3435 CrossRef CAS PubMed.
  123. S. Morimune, M. Kotera, T. Nishino and T. Goto, Carbon, 2014, 70, 38–45 CrossRef CAS PubMed.
  124. F.-H. Hsu and T.-M. Wu, Synth. Met., 2012, 162, 682–687 CrossRef CAS PubMed.
  125. D. Zhang, X. Zhang, Y. Chen, P. Yu, C. Wang and Y. Ma, J. Power Sources, 2011, 196, 5990–5996 CrossRef CAS PubMed.
  126. L. Li, K. Xia, L. Li, S. Shang, Q. Guo and G. Yan, J. Nanopart. Res., 2012, 14, 1–8 CAS.
  127. S. Konwer, R. Boruah and S. Dolui, J. Electron. Mater., 2011, 40, 2248–2255 CrossRef CAS.
  128. C. Bora and S. K. Dolui, Polymer, 2012, 53, 923–932 CrossRef CAS PubMed.
  129. J. Zhang and X. S. Zhao, J. Phys. Chem. C, 2012, 116, 5420–5426 CAS.
  130. H. Gómez, M. K. Ram, F. Alvi, P. Villalba, E. Stefanakos and A. Kumar, J. Power Sources, 2011, 196, 4102–4108 CrossRef PubMed.
  131. Q. Wu, Y. Xu, Z. Yao, A. Liu and G. Shi, ACS Nano, 2010, 4, 1963–1970 CrossRef CAS PubMed.
  132. M. Hassan, K. R. Reddy, E. Haque, S. N. Faisal, S. Ghasemi, A. I. Minett and V. G. Gomes, Compos. Sci. Technol., 2014, 98, 1–8 CrossRef CAS PubMed.
  133. X. Xu, D. Ou, X. Luo, J. Chen, J. Lu, H. Zhan, Y. Dong, J. Qin and Z. Li, J. Mater. Chem., 2012, 22, 22624–22630 RSC.
  134. X. Xu, Q. Luo, W. Lv, Y. Dong, Y. Lin, Q. Yang, A. Shen, D. Pang, J. Hu, J. Qin and Z. Li, Macromol. Chem. Phys., 2011, 212, 768–773 CrossRef CAS PubMed.
  135. T. Lindfors, A. Österholm, J. Kauppila and M. Pesonen, Electrochim. Acta, 2013, 110, 428–436 CrossRef CAS PubMed.
  136. W. Si, W. Lei, Y. Zhang, M. Xia, F. Wang and Q. Hao, Electrochim. Acta, 2012, 85, 295–301 CrossRef CAS PubMed.
  137. L. Liu, A. H. Barber, S. Nuriel and H. D. Wagner, Adv. Funct. Mater., 2005, 15, 975–980 CrossRef CAS PubMed.
  138. J. Zhang, J. Lei, R. Pan, Y. Xue and H. Ju, Biosens. Bioelectron., 2010, 26, 371–376 CrossRef PubMed.
  139. J. Liu, L. Tao, W. Yang, D. Li, C. Boyer, R. Wuhrer, F. Braet and T. P. Davis, Langmuir, 2010, 26, 10068–10075 CrossRef CAS PubMed.
  140. H. Wu, J. Wang, X. Kang, C. Wang, D. Wang, J. Liu, I. A. Aksay and Y. Lin, Talanta, 2009, 80, 403–406 CrossRef CAS PubMed.
  141. X. Yang, Y. Tu, L. Li, S. Shang and X. M. Tao, ACS Appl. Mater. Interface, 2010, 2, 1707–1713 CrossRef CAS PubMed.
  142. H. Fan, L. Wang, K. Zhao, N. Li, Z. Shi, Z. Ge and Z. Jin, Biomacromolecules, 2010, 11, 2345–2351 CrossRef CAS PubMed.
  143. A. S. Patole, S. P. Patole, S.-Y. Jung, J.-B. Yoo, J.-H. An and T.-H. Kim, Eur. Polym. J., 2012, 48, 252–259 CrossRef CAS PubMed.
  144. M. Hassan, K. R. Reddy, E. Haque, A. I. Minett and V. G. Gomes, J. Colloid Interface Sci., 2013, 410, 43–51 CrossRef CAS PubMed.
  145. F. He, S. Lau, H. L. Chan and J. Fan, Adv. Mater., 2009, 21, 710–715 CrossRef CAS PubMed.
  146. J. Yu, X. Huang, C. Wu and P. Jiang, IEEE Trans. Dielectr. Electr. Insul., 2011, 18, 478–484 CrossRef CAS.
  147. S. Thakur and N. Karak, Prog. Org. Coat., 2013, 76, 157–164 CrossRef CAS PubMed.
  148. H. J. Yoo, S. S. Mahapatra and J. W. Cho, J. Phys. Chem. C, 2014, 118, 10408–10415 CAS.
  149. W. E. Mahmoud, E. H. El-Mossalamy and H. M. Arafa, J. Appl. Polym. Sci., 2011, 121, 502–507 CrossRef CAS PubMed.
  150. X. Wang, H. Yang, L. Song, Y. Hu, W. Xing and H. Lu, Compos. Sci. Technol., 2011, 72, 1–6 CrossRef CAS PubMed.
  151. D. Kumar and R. C. Sharma, Eur. Polym. J., 1998, 34, 1053–1060 CrossRef CAS.
  152. S. S. Jeon, H. H. An, C. S. Yoon and S. S. Im, Polymer, 2011, 52, 652–657 CrossRef CAS PubMed.
  153. G. Yu, L. Hu, N. Liu, H. Wang, M. Vosgueritchian, Y. Yang, Y. Cui and Z. Bao, Nano Lett., 2011, 11, 4438–4442 CrossRef CAS PubMed.
  154. A. K. Geim and K. S. Novoselov, Nat. Mater., 2007, 6, 183–191 CrossRef CAS PubMed.
  155. M. D. Stoller, S. Park, Y. Zhu, J. An and R. S. Ruoff, Nano Lett., 2008, 8, 3498–3502 CrossRef CAS PubMed.
  156. H. Liu, P. Gao, J. Fang and G. Yang, Chem. Commun., 2011, 47, 9110–9112 RSC.
  157. L. Z. Fan, Y. S. Hu, J. Maier, P. Adelhelm, B. Smarsly and M. Antonietti, Adv. Funct. Mater., 2007, 17, 3083–3087 CrossRef CAS PubMed.
  158. L. Li, H. Song, Q. Zhang, J. Yao and X. Chen, J. Power Sources, 2009, 187, 268–274 CrossRef CAS PubMed.
  159. X. Wang, C. Yang and P. Liu, Synth. Met., 2012, 162, 2349–2354 CrossRef CAS PubMed.
  160. H. Pham, V. Pham, E.-S. Oh, J. Chung and S. Kim, Korean J. Chem. Eng., 2012, 29, 125–129 CrossRef CAS.
  161. N. G. Sahoo, Y. C. Jung, H. H. So and J. W. Cho, Synth. Met., 2007, 157, 374–379 CrossRef CAS PubMed.
  162. V. Georgakilas, P. Dallas, D. Niarchos, N. Boukos and C. Trapalis, Synth. Met., 2009, 159, 632–636 CrossRef CAS PubMed.
  163. T.-M. Wu, S.-J. Yen, E.-C. Chen and R.-K. Chiang, J. Polym. Sci., Part B: Polym. Phys., 2008, 46, 727–733 CrossRef CAS PubMed.
  164. K. R. Reddy, K.-P. Lee, A. I. Gopalan and H.-D. Kang, React. Funct. Polym., 2007, 67, 943–954 CrossRef CAS PubMed.
  165. K. R. Reddy, K.-P. Lee, Y. Lee and A. I. Gopalan, Mater. Lett., 2008, 62, 1815–1818 CrossRef CAS PubMed.
  166. X. Zhang, J. Zhu, N. Haldolaarachchige, J. Ryu, D. P. Young, S. Wei and Z. Guo, Polymer, 2012, 53, 2109–2120 CrossRef CAS PubMed.
  167. K. R. Reddy, B. C. Sin, K. S. Ryu, J. Noh and Y. Lee, Synth. Met., 2009, 159, 1934–1939 CrossRef CAS PubMed.
  168. K. R. Reddy, K.-P. Lee, A. I. Gopalan, M. S. Kim, A. M. Showkat and Y. C. Nho, J. Polym. Sci., Part A: Polym. Chem., 2006, 44, 3355–3364 CrossRef CAS PubMed.
  169. K. R. Reddy, B. C. Sin, C. H. Yoo, D. Sohn and Y. Lee, J. Colloid Interface Sci., 2009, 340, 160–165 CrossRef CAS PubMed.
  170. X.-M. Feng, R.-M. Li, Y.-W. Ma, R.-F. Chen, N.-E. Shi, Q.-L. Fan and W. Huang, Adv. Funct. Mater., 2011, 21, 2989–2996 CrossRef CAS PubMed.
  171. D. M. de Leeuw, P. A. Kraakman, P. F. G. Bongaerts, C. M. J. Mutsaers and D. B. M. Klaassen, Synth. Met., 1994, 66, 263–273 CrossRef CAS.
  172. Y. H. Ha, N. Nikolov, S. K. Pollack, J. Mastrangelo, B. D. Martin and R. Shashidhar, Adv. Funct. Mater., 2004, 14, 615–622 CrossRef CAS PubMed.
  173. S. Kirchmeyer and K. Reuter, J. Mater. Chem., 2005, 15, 2077–2088 RSC.
  174. B. Winther-Jensen and K. West, Macromolecules, 2004, 37, 4538–4543 CrossRef CAS.
  175. J. Kim, E. Kim, Y. Won, H. Lee and K. Suh, Synth. Met., 2003, 139, 485–489 CrossRef CAS.
  176. K. R. Reddy, H. M. Jeong, Y. Lee and A. V. Raghu, J. Polym. Sci., Part A: Polym. Chem., 2010, 48, 1477–1484 CrossRef CAS PubMed.

This journal is © The Royal Society of Chemistry 2015
Click here to see how this site uses Cookies. View our privacy policy here.