Poly(acrylonitrile-co-styrene sodium sulfonate-co-n-butyl acrylate) terpolymer based cation exchange membrane for water desalination via electrodialysis

Vaibhavee Bhadjaac, Uma Chatterjee*ac and Suresh K. Jewrajkabc
aElectromembrane Processes Division, CSIR-Central Salt & Marine Chemical Research Institute, Bhavnagar, Gujarat, India. E-mail: umac@csmcri.org
bReverse Osmosis Division, CSIR-Central Salt & Marine Chemical Research Institute, Bhavnagar, Gujarat, India
cAcSIR-Central Salt & Marine Chemicals Research Institute, Bhavnagar, Gujarat, India

Received 4th February 2015 , Accepted 23rd April 2015

First published on 23rd April 2015


Abstract

A process for the preparation of cation exchange membranes (CEMs) by avoiding the commonly used post sulfonation reaction of aromatic rings is reported. Films were fabricated from terpolymers of polyacrylonitrile (PAN), polystyrene sodium sulfonate (PStSO3Na) and polyn-butyl acrylate (PnBA) for use as CEMs for water desalination via electrodialysis. Initially, efforts were directed to obtain CEMs with suitable mechanical properties and stability in aqueous medium by adjusting the terpolymer composition. Terpolymer composition was adjusted by optimizing the AN[thin space (1/6-em)]:[thin space (1/6-em)]StSO3Na[thin space (1/6-em)]:[thin space (1/6-em)]nBA (w/w) ratio in the copolymerization feed. The terpolymer synthesized by the copolymerization of 75% (w/w) AN, 15% (w/w) StSO3Na and 10% (w/w) nBA in the feed mixture yielded a CEM (containing 31.7% w/w PStSO3Na) which exhibited 8.7 MPa tensile stress and 34% strain at rupture under water wet state and is suitable for use in an electrodialysis unit. This CEM also shows 1.50 meq. g−1 ion exchange capacity, 1.37 mS cm−1 ionic conductivity and 0.87 transport number. The power consumption and current efficiency of the membrane were 1.06 kW h kg−1 and 86% respectively at an applied potential of 2 volt/cell pair during desalination of diluted sea water (total dissolved solid 2000 mg L−1). The CEM was stable at pH range 3–12 and temperature up to 70 °C and also exhibited stability even after exposure to Fenton's reagent at 70 °C for 9 h.

Introduction

Cation exchange membranes (CEMs) are widely used in fuel cells,1,2 water desalination via electrodialysis (ED),3,4 reverse electrodialysis (RO)5 and recovery of valuable metals such as zinc and nickel from effluents.6–8 The advantages of ED over RO during brackish water desalination (containing 5000 mg L−1 total dissolved species) includes lower energy required for desalination, minimal requirement for pre-treatment, easier and lower cost of maintenance, higher membrane life due to no bacterial/pathogenic fouling and higher recovery of water. The CEM should possess high selectivity, high ionic conductivity and appropriate mechanical and chemical stability for applications in desalination and fuel cells. The suitability of any desalination process via ED mainly depends on the value of power consumption (W) and current efficiency (CE). The W and CE values largely influenced by the water uptake, ion exchange capacity, membrane conductivity and transport number.

Most of the CEMs contain SO3Na groups as cation exchange moiety. CEMs containing –SO3Na moiety are generally prepared through grafting of fluorinated ethylene–propylene copolymer, polytetrafluoroethylene, polyethylene, polyvinyl fluoride films by polystyrene, followed by sulfonation using chlorosulfonic acid.9–13 Upon extrusion of polyethylene/polystyrene-co-polydivinyl benzene interpolymer produced flat film. The sulfonation of aromatic ring of the interpolymer film produced CEM for direct use in ED unit.4 The W and CE values for the interpolymer-based CEM were 0.808 kW h kg−1 and 85% respectively at applied potential 2 volt/cell pair.4

Apart from the interpolymer-based CEM, preparation of heterogeneous CEM by dispersion of cation exchange resin into the polyvinyl chloride (PVC) matrix followed by surface modification by grafting the CEM by poly(acrylic acid-co-methyl methacrylate) has been reported.14 The prepared CEM was used for water desalination via ED.14 CEMs have also been prepared from poly(ether ether ketone), poly(ether sulfone) or their blends or block copolymers by sulfonation using chlorosulfonic acid.15–19 The CEMs prepared from these polymers exhibited desired ion exchange capacity, ionic conductivity, mechanical property and chemical stability. The water uptake of these CEMs was moderate to high (around 20–40%). The structure–property evaluation of sulfonated polyether sulfone (SPES) based CEM has been reported.20 Terpolymer based CEM has been prepared from copolymerization of styrene (St), hydroxyethyl acrylate and lauryl methacrylate followed by sulfonation of PSt block.21 Terpolymer based CEM without post sulfonation has been prepared from the copolymerization of methyl methacrylate, methacrylic acid and styrene sodium sulfonate (StSO3Na) and this CEM has been used for membrane capacitive deionization.22 Composite CEMs by incorporation of silica, zeolite, graphene oxide or sulfonated graphene oxide nanoparticle in the polymer matrix have been prepared. These nanoparticles were used to enhance the electrochemical properties of the membranes. Xu et al. reported the preparation of polyvinyl alcohol (PVA)/3-trihydroxysilyl-1-propanesulfonic acid and PVA/sodium allylsulfonate + vinyltrimethoxysilane based hybrid CEMs by sol gel process and used it for alkali recovery.23,24 This author also reported the preparation of sulfonated polyphenylene oxide (SPPO) based CEM for alkali recovery by electrospinning of SPPO nanofibers followed by hot press treatment.25 Heterogeneous composite CEM based on PVC matrix containing dispersed cation exchange resin and finely powdered zeolite nanoparticles exhibited water desalination via the ED process.26 Similarly, graphene oxide/SPES composite CEM also exhibited water desalination.27 The SPES-based CEM exhibited 5.4 kW h kg−1 W and 87.1% CE respectively during water desalination at applied potential 2 volt/cell pair. The W value decreased to 4.30 kW h kg−1 and CE value increased to 97.4% after incorporation of 10 wt% of graphene oxide into SPES polymer.27 Porous SPES/silica nanocomposite-based CEM was prepared by dispersion of silica nanoparticles in SPES solution followed by casting the solution and evaporation of solvent. The W and CE values during desalination were 3.82 kW h kg−1 and 84% respectively at an applied potential 7 volt/cell pair with this composite membrane.28 The improved desalination efficiency of the composite membranes is ascribed to the lowering of water up take compared to that of neat SPES CEMs. This is due to the enhanced diffusion of water molecules through the membrane with increasing water uptake which prolongs the total desalination time. As a result, W value increase and CE value decreases.

Our earlier publication reported the preparation of polyacrylonitrile (PAN)-co-poly2-(dimethylamino)ethyl methacrylate (PDMA) copolymer (PAN-co-PDMA) network-based anion exchange membrane (AEM) for water desalination.29 We demonstrated that presence of moderate amount (18%, w/w) of hydrophobic polyn-butyl acrylate (PnBA) in the terpolymer remarkably enhanced the rate of water desalination which in turn influenced the W and CE values.30 The superior performance of PnBA containing AEM was attributed to the nanophase separation between PnBA and PAN-co-PDMA matrices and absence of freezing bound water. Importantly, the water uptake could be reduced without compromising in the amount of ion exchange moiety in the AEM.30 Akin to PAN-co-PnBA-co-PDMA based AEM, it is highly desirable to prepare PnBA containing CEM for water desalination.

Herein, a process for the preparation of terpolymer-based CEM by avoiding post sulfonation reaction is reported. We demonstrate that a terpolymer synthesized by the copolymerization of 75% (w/w) AN, 15% (w/w) StSO3Na and 10% (w/w) nBA in feed mixture yielded CEM which exhibited suitable properties such as 8.7 MPa tensile stress, 34% strain under water wet state, 1.50 meq. g−1 ion exchange capacity, 1.37 mS cm−1 ionic conductivity and 0.87 transport number. The CEM exhibited 1.06 kW h kg−1 W and 86% CE during diluted sea water desalination (containing total dissolved solid 2000 mg L−1) at an applied potential 2 volt/cell pair.

Experimental

Materials

Acrylonitrile (AN, 99%), n-butyl acrylate (nBA, 99%), were purchased from TCI and purified by passing through basic alumina column. Styrene sodium sulfonate (StSO3Na, 93%) was purchased from TCI and used as received. Azobisisobutyronitrile (AIBN, 97%) (SD Fine Chemicals, India) was recrystallized from methanol (MeOH). N,N-Dimethyl formamide (DMF), hydrochloric acid (HCl, 35%), sodium hydroxide (NaOH), sodium chloride (NaCl), potassium nitrate (KNO3), all AR grade reagents, were obtained from SD fine chemicals and used without further purification. In all experiments, double distilled water was used. Commercial CEM (IONSEP-HC-C) and AEM (IONSEP-HC-A) were purchased from Iontech, China. Polyethylene–polystyrene based anion exchange membrane (PE–PSt–A) was prepared using literature procedure.4 Sea water was collected from Ghogha sea, of Bhavnagar, Gujarat, India and was diluted to total dissolved solid (TDS) 2000 mg L−1 before use. The diluted sea water of TDS 2000 mg L−1 contains 0.1% chloride (Cl), 0.064% sodium (Na+), 0.006% magnesium (Mg+2), 0.002% calcium (Ca+2).

Synthesis of PAN-co-PStSO3Na-co-PnBA terpolymers

A series of terpolymers (PAN-co-PStSO3Na-co-PnBA) containing different amount of PAN, PnBA and PStSO3Na were synthesized by free radical copolymerization. A typical copolymerization process is as follows. AN (46.3 mL, 0.707 mol), nBA (5.5 mL, 0.039 mol) StSO3Na (7.5 g, 0.036 mol), DMF (25 mL) and H2O (25 mL) were taken in a 1 L round bottom flask fitted with a condenser. AIBN (0.5 g 9.14 × 10⁻³ mol) was then added to the admixture. The reaction mixture was purged with N2 for 10 min before placing the flask into oil bath. The polymerization was carried out at 85 °C. The reaction was continued for 4 h. The polymer was precipitated in MeOH and dried under vacuum at 80 °C for 48 h. The conversion was 80%. Similar procedure was used for the preparation of other copolymers by varying AN, nBA and StSO3Na ratios.

Preparation of CEM

Copolymer (40 g) was dissolved in DMF (120 mL) which gave clear solution. The copolymer solution was then cast on a thin glass plate by doctor knife and was kept at 50 °C for 3 h. The membrane was peeled off and submerged in water to remove the trapped DMF inside the membrane. All the membranes were prepared using same procedure. The final thickness of all the membranes was 0.2 mm.

Characterization

FT-IR, ATR-IR and CHN analyses

FT-IR spectra of the different terpolymer based CEMs were recorded with FTIR (Perkin-Elmer Instrument) at room temperature from 4000 to 600 cm−1. The samples were grinded with KBr and pellets were then made for the analyses.

ATR-IR spectra of CEM-3 before and after subjected to exposure with Fentons reagent were recorded on an Agilent instrument (Agilent Cary 600 series FTIR) at room temperature. A Germanium crystal was used for recording ATR-IR spectra. ATR-IR spectra on 3 different positions were recorded.

Sulphur (S) to nitrogen (N) ratio in the CEMs was determined in an Elemental CHN analyser of model Vario Micro Cube using acetanilide and sulphanilamide as standards. Table 1, summarizes the concentrations of monomers in the copolymerization feeds for the synthesis of different terpolymers and abbreviations of the corresponding membranes. Table 1 also shows the PStSO3Na (%, w/w) content and S to N ratio in the prepared CEMs.

Table 1 Compositions of feed solutions for the synthesis of terpolymers, abbreviations of the prepared membranes, actual amount of PStSO3Na (%, w/w) and S to N ratios of the CEMs
CEM Copolymer PAN[thin space (1/6-em)]:[thin space (1/6-em)]PStSO3Na[thin space (1/6-em)]:[thin space (1/6-em)]PnBA (w/w) (feed) PStSO3Na (%, w/w) presenta S/Nb
a From titration.b From CHN analysis.
CEM-1 PAN-co-PStSO3Na-1 85[thin space (1/6-em)]:[thin space (1/6-em)]15[thin space (1/6-em)]:[thin space (1/6-em)]0 42.4 0.35
CEM-2 PAN-co-PStSO3Na-co-PnBA-2 80[thin space (1/6-em)]:[thin space (1/6-em)]15[thin space (1/6-em)]:[thin space (1/6-em)]5 34.6 0.30
CEM-3 PAN-co-PStSO3Na-co-PnBA-3 75[thin space (1/6-em)]:[thin space (1/6-em)]15[thin space (1/6-em)]:[thin space (1/6-em)]10 31.7 0.28
CEM-4 PAN-co-PStSO3Na-co-PnBA-4 70[thin space (1/6-em)]:[thin space (1/6-em)]15[thin space (1/6-em)]:[thin space (1/6-em)]15 29.8 0.26


Equilibrium water uptake by thermogravimetric analysis (TGA), tensile stress–strain, differential scanning calorimetric (DSC) analyses and dynamic mechanical analyser (DMA) study

TGA analysis was carried out in a Netzsch TGA (TG209 F1 Libra) system to determine the water uptake and to obtain thermograms of the membranes. Samples were kept in distilled water (48 h) until they attained equilibrium water uptake and then the weight of the membranes was taken after removing surface water. Samples were heated from 30 °C to 500 °C under nitrogen atmosphere at a heating rate of 10 °C min−1. Water uptake was measured from the change of weight after heating at 150 °C.

Stress–strain property (stress and elongation at break) of the water wet membrane samples (2.5 cm long, 0.35 cm width 0.18 mm thick) was determined using ISO 527 S2 method in a Zwick Roell Z2.5 tester at elongation speed 20 mm min−1. Average of 5 measurements of each type of samples was taken.

DSC measurement was carried out in a Netzsch DSC 204 F1 Phoenix instrument. Vacuum dried samples (20 mg) were heated from −80 °C to +200 °C at the rate 10 °C min−1. The samples were then cooled to −80 °C at a rate 10 °C min−1 and kept at −80 °C for 5 min and then the second heating was performed at a heating rate 5 °C min−1. Glass transition temperature (Tg) was recorded as the inflection point of the heat-capacity change from the second heating curve. Additional DSC experiments of water adsorbed samples were carried out at temperature range −30 to 30 °C at 10 °C min−1 heating rate to observe the state of water inside the membrane matrix. The surface water of the samples was gently removed by rubbing with tissue paper before preparing the DSC pans.

DMA analysis was performed in a Netzsch DMA system. Samples (rectangular films of thickness 0.18 to 0.2 mm, length 30 mm and width 10 mm) were heated from −80 °C to 180 °C at a heating rate 3 °C min−1 at a frequency 1 Hz under tension mode.

Electrochemical properties of the CEMs

The ion-exchange capacity (IEC) was determined by the classical titration method as reported earlier.20,21 The membrane resistance (Rm) and membrane conductivity (Km) were determined in an in house made cell, composed of two black graphite electrodes fixed on acrylic plates as reported earlier.29,30 The Rm and Km was estimated from the following equation:4,29,30
 
Km = Δx/ARm (1)
where Δx is the thickness of the membrane, A is the effective membrane area.

Determination of transport number (t+) of the CEM

The membrane potential (Em) was measured in a two compartment cell made of acrylic sheet of effective membrane area 9.0 cm2 using our earlier method.28–30 The concentrations of NaCl in the two compartments were 0.1 M and 0.01 M respectively. The t+ was calculated from the following equation:28–30
 
image file: c5ra07191g-t1.tif(2)
where R is the gas constant, F is the Faraday constant, T is the absolute temperature (298 K), C1 and C2 are the concentration of NaCl solutions in the testing cell.

ED performance

The water desalination experiment was carried out in an in-house prepared ED cell (size 13 cm × 5 cm) under recirculation mode using three compartments (diluted, concentrated and electrode wash). 5 pieces of each kind of membrane (CEM-3 and commercial AEM, IONSEP-HC-A) were used.4,29,30 The results were compared with commercial membranes (IONSEP-HC-C/IONSEP-HC-A).

Flux (J), defined as the removal of ions from diluted to concentrated compartment during desalination was measured from the following equation:4,29,30

 
image file: c5ra07191g-t2.tif(3)
C0 and Ct are the initial (0.034 M) and final concentration (0.009 M) of NaCl in the diluted compartment; dt is the time allowed for ED (s); Vt is the total volume of diluted compartment (0.80 × 10⁻³ m3); and A is the effective membrane area (6.5 × 10⁻³ m2).

Power consumption (W in kW h kg−1) during ED process is defined as the amount of energy needed to transport one kg of NaCl from diluted compartment to concentrated compartment. W has been calculated using the following equation:4,29,30

 
image file: c5ra07191g-t3.tif(4)
where V is the applied voltage; I is the current (amp); dt is the time (h) allowed for the desalination process; and w is the weight of salt (kg) removed.

The current efficiency (CE) is defined as the fraction of the current transported by the specific ion and has been calculated using the following equation:4,29,30

 
image file: c5ra07191g-t4.tif(5)
where F is the Faraday constant (26.8 amp h mole−1); M is the molecular weight of NaCl (58.5 g mol−1), N is the number of cell pairs used in the ED unit (5 pairs), Q is the amount of electricity passed throughout the system (amp h).

Determination of pH, temperature and oxidative stability of CEM-3

pH, temperature and oxidative stability of CEM-3 were determined using the same procedure as reported by us.29,30 For example, for the determination of pH stability, pieces of CEM-3 of known thickness was immersed in diluted sea water of TDS 2000 mg L−1 at different pH for 24 h and Km value was determined. For example, for the determination of temperature stability, piece of CEM-3 was kept in diluted sea water of TDS 2000 mg L−1 and the solution was heated at 70 °C for up to 9 h. After certain time intervals Km value was measured. Oxidative stability was determined by keeping the piece of CEM-3 in diluted sea water of TDS 2000 mg L−1 3%, v/v H2O2 aqueous solution containing 3 mg L−1 FeSO4 was added in to the solution. The solution was kept at 70 °C for 9 h. After 9 h Km, IEC and weight were measured.

Results and discussions

Synthesis and characterization of PAN-co-PStSO3Na-co-PnBA terpolymers and preparation of CEMs

PAN-co-PStSO3Na-co-PnBA terpolymers (Table 1, entries 2–4) containing ca. 29–42% (w/w) PStSO3Na were synthesized by free radical copolymerization of mixture of AN, nBA and StSO3Na in DMF–water (1[thin space (1/6-em)]:[thin space (1/6-em)]1 v/v) mixture using AIBN as initiator. The above ratio of mixed solvents maintained the homogeneous copolymerization condition. The amount of PStSO3Na (%, w/w) in the terpolymers was estimated from standard titration method.20 Unfortunately, the amount of PnBA and PAN in the terpolymers could not be determined by 1H NMR due to lack of common solvent in which each components of the terpolymer are soluble. PAN-co-PStSO3Na-1 (Table 1, entry 1) copolymer containing 57.6% (w/w) PAN and 42.4% (w/w) PStSO3Na was also synthesized.

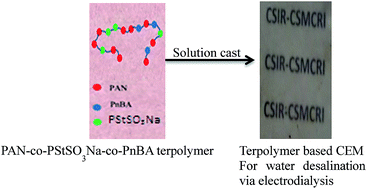
Scheme 1 shows the preparation of terpolymer-based CEM. The advantage of use of PAN-co-PStSO3Na-co-PnBA copolymer for the preparation of CEM are (i) the PAN-co-PStSO3Na-co-PnBA copolymers can easily be synthesized by conventional free radical polymerization, (ii) the copolymer contains negatively charged –SO3Na functional group which avoids the requirement of post sulfonation and (iii) the composition of the terpolymer for obtaining required stress–strain property was achieved by adjusting AN, nBA and StSO3Na concentrations in the feed mixture. Fig. 1 shows the IR spectra of CEM-1 to CEM-4.


image file: c5ra07191g-s1.tif
Scheme 1 Preparation of PAN-co-PStSO3Na-co-PnBA terpolymer based CEM. Picture shows transparent CEM film.

image file: c5ra07191g-f1.tif
Fig. 1 FT-IR spectra of CEM-1, CEM-2, CEM-3 and CEM-4.

The band at 2964 cm−1 is assigned to the stretching vibrations of C–H bonds due to aromatic protons of PStSO3Na part. The bands appeared at 1244–1177 cm−1 and 1043 cm−1 are assigned to the stretching vibrations for S[double bond, length as m-dash]O and O[double bond, length as m-dash]S[double bond, length as m-dash]O, respectively.31 Appearance of absorption bands at 2241 cm−1, 1445 cm−1, 1244 cm−1 are due to –CN, –CH2, –CH stretching vibrations of PAN part.32 The absorption band appeared at 1730 cm−1 is ascribed to the ester carbonyl (–C[double bond, length as m-dash]O) stretching vibration and the absorption bands appeared at 2876–2930 cm−1 and 1448–1513 cm−1 are due to C–H stretching vibration and C–H in-plane bending vibration of PnBA part of CEM-2 to CEM-4.33

Determination of water uptake by TGA

Fig. 2 shows the TGA thermograms of water wet CEM-1 to CEM-4 (curves 1–4) respectively. The membranes were contacted with water for 48 h to ensure attaining equilibrium water uptake for TGA experiments. TGA thermogram (3′) of fully dried CEM-3 is also included in the Fig. 2. The water wet CEM-1 to CEM-4 show ca. 35%, 24%, 12% and 6.5% weight loss respectively up to temperature 160 °C corresponding to evaporation of absorbed water. This wet loss is therefore equilibrium water uptake by the membranes since the fully dried CEM-3 showed negligible weight loss (<0.5%) up to 160 °C. Determination of extent of water uptake by the ionic membrane was determined after measuring the weight loss by heating up to 150 °C.29,30,34 After total water loss, the membranes again exhibited one step degradation e.g. from 310 °C to 450 °C steeply. The lowering of water uptake (Table 2) from CEM-1 to CEM-4 is ascribed to the lowering amount of hydrophilic PStSO3Na and increasing amount of hydrophobic PnBA present in the respective membrane.
image file: c5ra07191g-f2.tif
Fig. 2 Curves 1–4 are the stress–strain profiles of CEM-1, CEM-2, CEM-3 and CEM-4 respectively.
Table 2 Water uptake, stress, and strain values of prepared CEMs
CEM Water uptake by TGA (%) Stress at failure (MPa) Strain at failure (%)
CEM-1 35 1.6 (±0.3) 6 (±1.1)
CEM-2 24 2.5 (±0.5) 20 (±2.5)
CEM-3 12 8.7 (±1) 34 (±2)
CEM-4 6.5 2.9 (±0.7) 40 (±5)


Tensile properties of the CEMs

Fig. 3 shows the tensile stress–strain curves of CEM-1 to CEM-4. Presence of moderate amounts of PnBA in the membranes improves both tensile stress (at break) and strain (at break). Along with water uptake, Table 2 also summarizes the values of stress (at break) and strain (at break) of the water wet CEMs.
image file: c5ra07191g-f3.tif
Fig. 3 Curves 1–4 are the stress–strain profiles of CEM-1, CEM-2, CEM-3 and CEM-4 respectively showing failure of the samples.

The water wet CEM-3 exhibited best mechanical property (8.7 MPa stress and 34% strain at break) (curve 3). This is due to lowering of water uptake and enhancement of rubbery property of the membrane. CEM-1 (curve 1) and CEM-2 (curve 2) show poor stress–strain property in water wet state due to high degree of water uptake by these membranes (Fig. 2, TGA thermograms 1 and 2). Although, the water uptake by CEM-4 was lowest, its tensile stress is ca. 3 times lower than that of CEM-3 due to lowering of hard PAN and increase of soft PnBA in the CEM-4 as the corresponding copolymer was synthesized by lowering the amount of AN and enhancing the amount of nBA in the feed.

Phase separation behaviour by DSC and DMA analyses

Phase behaviour of the membranes was studied by DSC and DMA analyses. Fig. 4 shows the DSC thermograms of CEM-1 to CEM-4. CEM-1 (contains no PnBA) and CEM-2 (containing PnBA) showing drifting towards endothermic direction indicates typical nature of phase separation. Both CEM-1 and CEM-2 shows Tg at around 70 °C. Interestingly, CEM-3 and CEM-4 (containing higher amount of PnBA than that of CEM-2) exhibited similar drifting towards endo-thermic direction with transition at about 80–85 °C which is due to the appearance of Tg for PAN part. The appearance of Tg at higher temperature side for CEM-3 and CEM-4 compared to CEM-1 and CEM-2 indicates that moderate to high amount of PnBA in the CEMs causes greater degree of phase separation. This type of phase separation induced by PnBA might be useful for lowering the amount of freezing bound water in the membrane (vide infra).30
image file: c5ra07191g-f4.tif
Fig. 4 DSC profiles of CEM-1, CEM-2, CEM-3 and CEM-4.

The PnBA induced phase separation can clearly be visualized from the DMA analyses. Fig. 5 shows, the storage modulus–temperature plots (Fig. 5A), loss modulus–temperature plots (Fig. 5B) and tandelta–temperature plots (Fig. 5C) of CEM-3 and CEM-1. CEM-3 exhibited two distinct Tgs at −44 °C and 36 °C (from loss modulus–temperature plot) and at −44 °C and 76 °C (from tandelta–temperature plot) respectively due to soft PnBA part and hard PAN part. On the other hand, CEM-1 exhibited only one Tg at 88 °C (from loss modulus–temperature plot) and at 62 °C (from tandelta–temperature plot). The Tg due to PnBA is not visible in the DSC thermograms probably due to lower amount of PnBA in the CEMs (5–15% in the feed for preparation of copolymers).


image file: c5ra07191g-f5.tif
Fig. 5 (A) Storage modulus–temperature, (B) loss modulus–temperature and (C) tandelta–temperature plots for CEM-1 and CEM-3.

The state of adsorbed water in the CEMs was studied by DSC (heating the samples from −30 °C to 30 °C) analyses (Fig. 6). The adsorbed water may present in three states (1) nonfreezing bound water which forms the primary hydrating shell of the hydrophilic polymer chains, (2) freezing bound water which forms the secondary hydration shell and (3) freezing (free) water which does not interact with the polymer. Fig. 6 shows significantly broad transition (from −17.4 °C to 12.8 °C) for CEM-1 whereas in case of CEM-2, CEM-3 and CEM-4 the broadening as well as the intensity of the transition decreased. Therefore, the content of freezing bound water reduces from CEM-1 to CEM-4 with the decrease of water uptake and increase of hydrophobic PnBA content in the membrane.30 The endothermic peak minima was appeared at ca. −5.5 °C for CEM-2 and CEM-3 whereas this peak minima for CEM-1 appears at ca. 0 °C. Hence, it may be stated that in addition to non-freezing bound water state, freezing bound water state also present in the CEM-2 to CEM-4. On the other hand, non-freezing bound water, freezing bound water and freezing free may also be present in CEM-1. This behaviour was reflected in the t+ value of the CEMs (vide infra).


image file: c5ra07191g-f6.tif
Fig. 6 DSC profiles of water wet CEM-1, CEM-2, CEM-3 and CEM-4.

Electrochemical properties of the CEMs

IEC, Km and t+ parameters of a CEM are crucial for further application in ED unit. Higher the values higher will be desalination rate. Table 3 Summarizes IEC, Km and t+ values of the prepared CEM-1, CEM-2, CEM-3, CEM-4 and commercially available IONSEP-HC-C respectively.
Table 3 Electrochemical properties of different CEMs
Membranes IEC (meq. g−1) Km (mS cm−1) in 0.1 M NaCl t+
CEM-1 2.08 2.22 0.72
CEM-2 1.68 2.03 0.80
CEM-3 1.50 1.37 0.87
CEM-4 1.47 1.34 0.89
IONSEP-HC-C 2.2 3.2 0.92


Among the prepared membranes, IEC and Km values are highest for CEM-1 and lowest for CEM-4. This is simply due to presence of higher amount of –SO3Na in CEM-1. t+ of the CEMs follows the trend for the membranes CEM-4 ∼ CEM-3 > CEM-2 > CEM-1. This may be attributed to increasing amount of water uptake from CEM-4 to CEM-1. Back diffusion of ions becomes favourable with increasing water uptake by the membranes. This is because the mobility of ions through the membranes increases with increase of water uptake by the membranes. The enhanced mobility of ions through the membranes reduces the t+ values.

Current–voltage (IV) studies and ED performance of CEM-3

CEM-1, CEM-2 and CEM-4 were not tested in ED unit due to their inferior mechanical property than that of CEM-3. CEM-3 was tested in ED unit for water desalination, since, this membrane exhibited best mechanical property and possessed comparable or higher electrochemical property among the prepared membranes. Fig. 7 shows the variation of current density with the variation of applied voltage (volt/cell pair) for 5 cells of CEM-3 and 5 cells of IONSEP-HC-A after equilibrating with diluted sea water (TDS 2000 mg L−1) under single pass mode in ED unit. Voltage was varied from 1 to 6 volt/cell pair. Additionally, the plots of variation of current density with applied potential for CEM-3/PE–PSt–A and commercial IONSEP-HC-C/IONSEP-HC-A under similar experimental conditions are also shown in Fig. 7. The additional experiments were carried out to verify the effect of AEM on limiting current density. All the three types of membrane combinations show distinct Ohmic, plateau length and over limiting regions which signify the ion transport behaviour and concentration polarization across the membranes.35 In the Ohmic region the current density increases linearly with the applied potential due to the presence of a large number of ions. In the plateau region the current density remains constant with applied potential and in the over-limiting region current density again increases because of production of H+ and OH ion due to water splitting. All the three types of membrane combination gave limiting current density at ca. 2.5 volt/cell pair. This indicates that the water desalination may effectively be performed up to applied voltage 2.5 volt/cell pair. On the other hand, current passing through the different membrane combinations is different. The current density value obtained with CEM-3/IONSEP-HC-A membrane combination was higher than IONSEP-HC-C/IONSEP-HC-A and CEM-3/PE–PSt–A combination.
image file: c5ra07191g-f7.tif
Fig. 7 Variation of current density with applied volt/cell pair for different membranes in diluted sea water (TDS 2000 mg L−1) under single pass.

Fig. 8a (initial TDS of diluted sea water 2000 mg L−1) and 8b (initial TDS of diluted sea water 5000 mg L−1) show decrease of concentrations of salt with time during desalination of water by the use of CEM-3 at two different applied potential (1.5 and 2 volt/cell pair). Two different voltages were selected to find out an optimum condition at which the desalination is faster, W is less and CE is high. The initial I value was usually less and hence the initial rate of desalination was slower for the sea water of TDS 2000 mg L−1 than that of sea water of TDS 5000 mg L−1. This is due to the much lower concentration of moving ions at both the applied potential when desalination was carried out with sea water of 2000 mg L−1 (Fig. S1, I vs. desalination time plots ESI). The decrease of current with time is due to increase in total ED unit resistance which subsequently means the removal of salts.4,29,30 At higher applied potential (2 volt/cell pair) for both high and low concentration of ions, the value of initial current (I) was higher. The decrease of TDS and I were faster at 2 volt/cell pair indicates faster desalination at 2 volt/cell pair compared to 1.5 volt/cell pair. Therefore, CE value increases at higher applied potential for both the cases (vide infra). The final composition of water in diluted compartments were 0.03% Cl, 0.02% Na+, 0.0008% Mg+2 and 0.00025% Ca+2 while 72% monovalent ion (Na+) and 86.4% divalent ions (Mg+2 and Ca+2) were removed during desalination process.


image file: c5ra07191g-f8.tif
Fig. 8 Decrease of TDS (mg L−1) with time at 1.5 and 2 volt/cell pair applied potential during water desalination using CEM-3. The TDS of the feed solutions are 2000 mg L−1 for plots (a) and 5000 mg L−1 for plots (b).

Table 4 summarizes W, CE (%) and J values of CEM-3 and IONSEP-HC-C measured at applied potential 1.5 & 2 volt/cell pair at pH 7.9. Clearly, as the applied potential increases from 1.5–2.0 volt/cell pair, the W and J values increase for both CEM-3 and IONSEP-HC-C.

Table 4 Comparison of W, CE and J values of CEM-3/IONSEP-HC-A and IONSEP-HC-C/IONSEP-HC-A evaluated during diluted sea water desalination via ED at different applied potential
Type of membrane W (kW h kg−1) CE (%) J × 104 (kg m−2 sec−1)
1.5 volt/cell pair 2 volt/cell pair 1.5 volt/cell pair 2 volt/cell pair 1.5 volt/cell pair 2 volt/cell pair
a TDS 2000 mg L−1.b TDS 5000 mg L−1.    
CEM-3a 0.94 1.06 73.5 86 1.20 1.64
CEM-3b 0.96 1.19 72 76.8 1.85 1.80
IONSEP-HC-Ca 0.81 1.12 66 93 1.41 1.82
IONSEP-HC-Cb 1.02 1.28 69 88 1.65 2.85


The effect of pH on the efficiency (rate of desalination) of CEM-3 was determined during sea water desalination (concentration 2000 mg L−1) at applied potential 2 volt/cell pair at four different pH (5, 8, 10, 12). Fig. 9 shows decrease of TDS with time during desalination at different pH. The rate of desalination is closer at pH range 5–12. Therefore, CEM-3 can be used for sea water desalination via ED at a pH window 5–12.


image file: c5ra07191g-f9.tif
Fig. 9 TDS vs. time plots during diluted sea water desalination (TDS 2000 mg L−1) at pHs 5, 8, 10 and 12 using CEM-3.

The W, CE and J values at a fixed voltage of 2 volt/cell pair were also calculated during desalination of water (TDS 2000 mg L−1) at different pH using CEM-3 (Table S1, ESI). The value of W, CE (%) and J are similar at different pH, which once again establishes about the stability of CEM-3 during desalination at different pH.

Determination of pH, temperature and oxidative stability of CEM-3

Fig. 10a show the effect on Km of membrane up on exposure to diluted sea water of TDS 2000 mg L−1 at different pHs for 8 h. Temperature stability of the membrane was further determined by measuring the Km of the membrane after subjected to exposure to hot diluted sea water (TDS 2000 mg L−1) at 70 °C at different time interval for up to 9 h (Fig. 10b).29,30 It turned out that that Km value remains almost unchanged after exposure to pH range 3–10 while after exposure to pH 12, the value was little bit increased. The increase in Km after exposure to pH 12 is attributed to the slow hydrolysis of –CN groups to –COOH and finally to –COONa. On the other hand, marginal (4%) loss in conductivity was observed after exposure to hot diluted sea water (TDS 2000 mg L−1) (70 °C) water for 9 h.
image file: c5ra07191g-f10.tif
Fig. 10 Effect of exposure to diluted sea water of TDS 2000 mg L−1 at pHs 3–12 for 24 h (plot a) and to hot diluted sea water (TDS 2000 mg L−1) at 70 °C for different time (up to 9 h) (plot b) on the Km of CEM-3.

The oxidative stability of CEM-3 was determined by submerging it in diluted sea water of TDS 2000 mg L−1 followed by addition of Fenton's reagent and subsequently heating the solution at 70 °C for up to 9 h.30,31 After Fenton's reagent oxidative degradation test, 6.5% weight loss, 6.2% Km loss and 2% IEC loss were observed. The IR band at 1030 cm−1 and 1177 cm−1 for S[double bond, length as m-dash]O and O[double bond, length as m-dash]S[double bond, length as m-dash]O stretching vibration of CEM-3 did not disappear as evident from ATR IR analysis (Fig. S2 ESI). Therefore, it is concluded that CEM-3 has appreciable stability in terms of Km and IEC before and after subjected to exposure with Fenton's reagent.

Conclusion

The critical parameter for successful preparation of terpolymer (PAN-co-PStSO3Na-co-PnBA) based cation exchange membrane (CEM) for water desalination is the composition of the terpolymer. For example, copolymer containing ca. 30% PStSO3Na is sufficient to obtain desirable ion exchange capacity and ionic conductivity for use in water desalination. Moderate amount of hydrophobic polyn-butyl acrylate is also required to prevent excessive swelling of the membrane in water and to attain desirable transport number. Terpolymer of required composition was obtained by use of suitable mixed solvent (DMF[thin space (1/6-em)]:[thin space (1/6-em)]water = 1[thin space (1/6-em)]:[thin space (1/6-em)]1 v/v) and by adjusting the feed monomers concentration. The terpolymer (prepared from copolymerization of 75% (w/w) AN, 15% (w/w) StSO3Na and 10% (w/w) nBA monomers in feed) gave best CEM (CEM-3) in terms of stress–strain (8.7 MPa tensile stress and 34% strain at break) properties under water wet state. The IEC, Km and t+ values obtained with CEM-3 are 1.50 meq. g−1, 1.37 mS cm−1 and 0.87 respectively which are close to the commercial membrane e.g. IONSEP-HC-C. The W and CE value obtained with CEM-3 during sea water desalination (TDS 2000 mg L−1) were 1.06 kW h kg−1 and 86% at an applied potential 2 volt/cell pair. The prepared membrane also exhibited almost steady performance at pH range 3 to 12 and after exposure to hot diluted sea water (TDS 2000 mg L−1) (temperature up to 70 °C). The CEM-3 also exhibited stability after exposure to Fenton's reagent for 9 h at 70 °C. This process thus highlights the properties and desalination performance of terpolymer-based CEM prepared by avoiding the post sulfonation reaction.

Acknowledgements

CSMCRI registration number is 203. We thank Centralized Analytical Facility, CSIR-CSMCRI, for analytical support. This work was supported by CSIR in house project (MLP 0011 and MLP 0013) and CSIR network projects (CSC 0105 and CSC 0104). Vaibhavee Bhadja thanks CSC0104 network project for providing the fellowship.

Notes and references

  1. N. Asano, M. Aoki, S. Suzuki, K. Miyatake, H. Uchida and M. Watanabe, J. Am. Chem. Soc., 2006, 128, 1762 CrossRef CAS PubMed.
  2. S. C. Gil, J. C. Kim, D. Ahn, J.-S. Jang, H. Kim, J. C. Jung, S. Lim, D.-H. Jung and W. Lee, J. Membr. Sci., 2012, 417–418, 2 Search PubMed.
  3. S. K. Adhikary, P. K. Narayanan, S. K. Thampy, N. J. Dave, D. K. Chauhan and V. K. Indusekhar, Desalination, 1991, 84, 189 CrossRef CAS.
  4. B. G. Shah, V. K. Shahi, S. K. Thampy, R. Rangarajan and P. K. Ghosh, Desalination, 2005, 172, 257 CrossRef CAS PubMed.
  5. J. G. Hong and Y. Chen, J. Membr. Sci., 2015, 473, 210 CrossRef PubMed.
  6. V. E. Santarosa, F. Peretti, V. Caldart, J. Zoppas and M. Zeni, Desalination, 2002, 149, 389 CrossRef CAS.
  7. M. I. Ahmed, H. T. Chang, J. R. Selman and T. M. Holsen, J. Membr. Sci., 2002, 197, 63 CrossRef CAS.
  8. J. Carrillo-Abad, M. García-Gabaldón and V. Pérez-Herranz, Sep. Purif. Technol., 2014, 132, 479 CrossRef CAS PubMed.
  9. M. Rouilly, E. Koetz, O. Haas, G. Scherer and A. Chapiro, J. Membr. Sci., 1993, 81, 89 CrossRef CAS.
  10. B. Gupta, F. Büchi, M. Staub, D. Grman and G. G. Scherer, J. Polym. Sci., Part A: Polym. Chem., 1996, 34, 1873 CrossRef CAS.
  11. M. M. Nasef, H. Saidi, H. M. Nor and M. F. Ooi, Polym. Int., 2000, 49, 1572 CrossRef CAS.
  12. J. Horsfall and K. Lovell, Eur. Polym. J., 2002, 38, 1671 CrossRef CAS.
  13. M. M. Nasef and H. Saidi, J. Membr. Sci., 2003, 216, 27 CrossRef.
  14. S. M. Hosseini, B. Rahzani, H. Asiani, A. R. Khodabakhshi, A. R. Hamidi, S. S. Madaeni, A. R. Moghadassi and A. Seidypoor, Desalination, 2014, 345, 13 CrossRef CAS PubMed.
  15. F. Wang, M. Hickner, Y. S. Kim, T. A. Zawodzinski and J. E. McGrath, J. Membr. Sci., 2002, 197, 231 CrossRef CAS.
  16. M. S. Kang, Y. J. Choi, I. J. Choi, T. H. Yoon and S. H. Moon, J. Membr. Sci., 2003, 216, 39 CrossRef CAS.
  17. P. Xing, G. P. Robertson, M. D. Guiver, S. D. Mikhailenko, K. Wang and S. Kaliaguine, J. Membr. Sci., 2004, 229, 95 CrossRef CAS PubMed.
  18. J. Balster, O. Krupenko, I. Punt, D. F. Stamatialis and M. Wessling, J. Membr. Sci., 2005, 263, 137 CrossRef CAS PubMed.
  19. K. Miyake, Y. Chikashige and M. Watanabe, Macromolecules, 2003, 36, 9691 CrossRef.
  20. C. Klaysom, B. P. Ladewig, G. Q. M. Lua and L. Wang, J. Membr. Sci., 2011, 368, 48 CrossRef CAS PubMed.
  21. E. M. Choi, K. S. Shin and T. S. Hwang, Macromol. Res., 2010, 18, 577 CrossRef CAS.
  22. N.-S. Kwak, J. S. Koo, T. S. Hwang and E. M. Choi, Desalination, 2012, 285, 138 CrossRef CAS PubMed.
  23. J. Hao, Y. Wu, J. Ran, B. Wu and T. Xu, J. Membr. Sci., 2014, 433, 10 CrossRef PubMed.
  24. Y. Wu, J. Hao, C. Wu, F. Mao and T. Xu, J. Membr. Sci., 2012, 423–424, 383 CrossRef CAS PubMed.
  25. J. Pan, L. Ge, X. Lin, L. Wu, B. Wu and T. Xu, J. Membr. Sci., 2014, 470, 479 CrossRef CAS PubMed.
  26. S. M. Hosseini, S. Rafiei, A. R. Hamidi, A. R. Moghadassi and S. S. Madaeni, Desalination, 2014, 351, 138 CrossRef CAS PubMed.
  27. S. Gahlot, P. P. Sharma, H. Gupta, V. Kulshrestha and P. K. Jha, RSC Adv., 2014, 4, 24662 RSC.
  28. C. Klaysom, R. Marschall, S.-Y. Moon, B. P. Ladewig, G. Q. M. Lu and L. Wang, J. Mater. Chem. A, 2011, 21, 7401 RSC.
  29. U. Chatterjee and S. K. Jewrajka, J. Mater. Chem. A., 2014, 2, 8396 CAS.
  30. U. Chatterjee, V. Bhadja and S. K. Jewrajka, J. Mater. Chem. A., 2014, 2, 16124 CAS.
  31. S.-Y. Jang and S.-H. Han, J. Membr. Sci., 2013, 444, 1 CrossRef CAS PubMed.
  32. C. Y. Liang and S. Krimm, J. Polym. Sci., Part A: Polym. Chem., 1958, 31, 513 CAS.
  33. G. Wang, Iran. Polym. J., 2011, 20, 931 CAS.
  34. G. Merle, A. Chairuna, E. Van de Ven and K. Nijmeijer, J. Appl. Polym. Sci., 2013, 129, 1143 CrossRef CAS PubMed.
  35. Y.-J. Choi, J.-M. Park, K.-H. Yeon and S.-H. Moon, J. Membr. Sci., 2005, 250, 295 CrossRef CAS PubMed.

Footnote

Electronic supplementary information (ESI) available: Variation of I (amp) with time during diluted sea water desalination of concentration 2000 and 5000 mg L−1 respectively with CEM-3 at 1.5–2 volt/cell pair applied potential, ATR-IR spectra of CEM-3 before and after subjected to Fenton's reagent oxidation test, summary of W, CE and J with CEM-3 during ED using diluted sea water of TDS 2000 mg L−1 at different pH at applied potential 2 volt/cell pair. See DOI: 10.1039/c5ra07191g

This journal is © The Royal Society of Chemistry 2015